The GHG offset potential of the open woodland afforestation in the boreal forest of Eastern Canada
|
|
|
- Alvin Scott
- 5 years ago
- Views:
Transcription
1 The GHG offset potential of the open woodland afforestation in the boreal forest of Eastern Canada Jean-François Boucher 1, Claude Villeneuve 1, Jean-Robert Wells 1, Yves Bergeron 2, Sophie D'Amours 3, Isabelle Côté 1, Daniel Lord 1 1 Université du Québec à Chicoutimi, Qc, Canada 2 Université du Québec en Abitibi-Témiscamingue, Qc, Canada 3 Université Laval, Qc, Canada 3 rd North American Carbon Program All-investigators Meeting New-Orleans, LA February 3 rd 2011


2 Canadian boreal forest 295 Mha, approx. 30% of Canada s total land and 22% of the world s boreal forest 2
3
4

 Regeneration failure after")


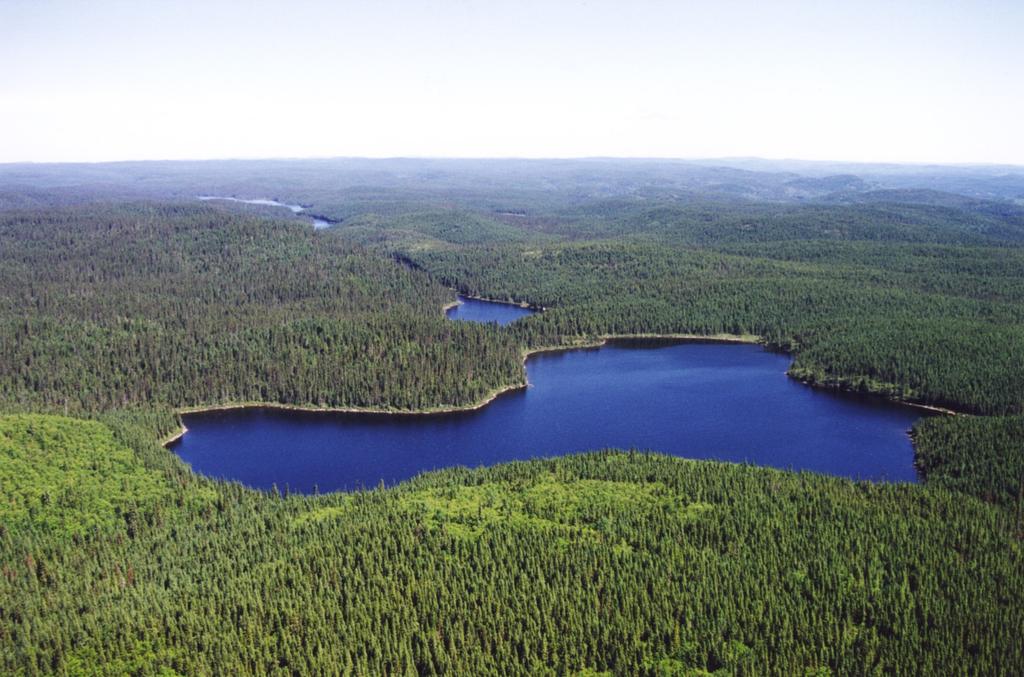
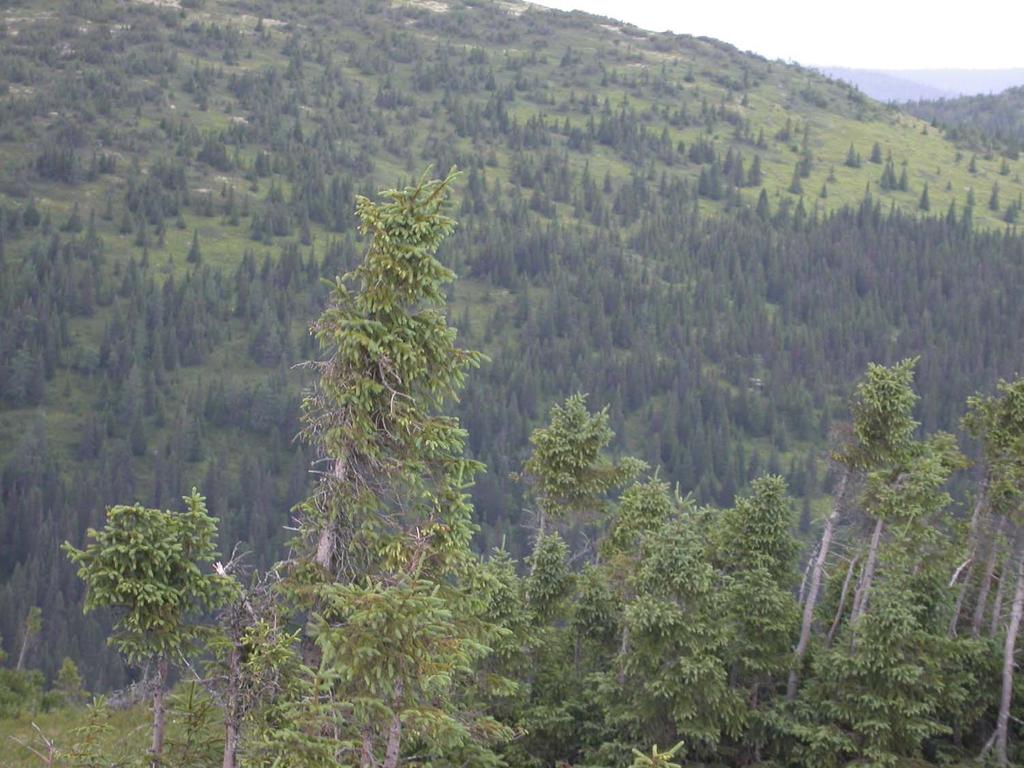
5 Natural crown cover patchiness of Canada s boreal forest Cyclic natural regeneration after wildfire of black spruce stands within the closedcrown boreal forest (~100 years) Regeneration failure after consecutive natural disturbances Alternative stable state or cyclic maintenance of open black spruce-lichen woodlands (OWs) (Arseneault and Payette 1992, Payette 1992, Gagnon et Morin 2001, Jasinsky et Payette 2005) 5
6 Natural crown cover patchiness of Canada s boreal forest Cyclic natural regeneration after wildfire of black spruce stands within the closedcrown boreal forest (~100 years) OWs= 7% or 1.6 M ha within Québec s closed-crown boreal forest? Regeneration failure after consecutive natural disturbances Alternative stable state or cyclic maintenance of open black spruce-lichen woodlands (OWs) (Arseneault and Payette 1992, Payette 1992, Gagnon et Morin 2001, Jasinsky et Payette 2005) 6
 Ecozone position class per ha Boreal Shield Vegetated - treed* Upland Sparse** 14")

7 7 Canadian extent of OWs? Terrestrial Landscape Density Volume Land cover Area (ha) Ecozone position class per ha Boreal Shield Vegetated - treed* Upland Sparse** Boreal Plains Vegetated - treed* Upland Sparse** Boreal Cordillera Vegetated - treed* Upland Sparse** Total boreal Vegetated - treed* Upland Sparse** *Vegetated - treed: Vegetated crown closure 5%, and Tree crown closure 10% **Sparse: Treed cover 10 25% Source: Canada's National Forest Inventory 2006 Boreal Cordillera Boreal plains Boreal shield
8 8 Assets of afforestation in the boreal zone Significant potential territories available across Canada No (or very few) loss of opportunities: Forestry Agriculture Cheap and low C-intensive mitigation method
 Life-Cycle Analysis (LCA) approach CO2 FIX model Baseline")
 (Site index 6m at 25 years, 175m 3 ha -1")
9 9 The C of simulated OW afforestation (Gaboury et al. 2009) Life-Cycle Analysis (LCA) approach CO2 FIX model Baseline scenario (intact OW) Afforestation scenario (planted OW) (30 m 3 ha -1 at 120 years) (Site index 6m at 25 years, 175m 3 ha -1 at 70 years)
10 The C of simulated OW afforestation (Gaboury et al. 2009) End-of-project sequestration (70 years) = 77 t C ha -1 Net C : positive after 27 years initial tree harvesting simulated 10

 Seed")


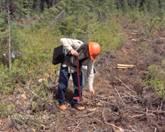
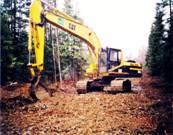
11 11 Operations related emissions (LCA) Seed production Plantation Containerized seedling Scarification GHG quantification <1% of net C sequestration Transport and site access Harvesting
12 12 Boreal OW afforestation: Known issues 1. Support? Growth and yield (C sequestration) Soil fertility 2. C stocks? Natural disturbances related reversal risk Harvested wood products 3. Albedo (surface radiative forcings)? Albedo management


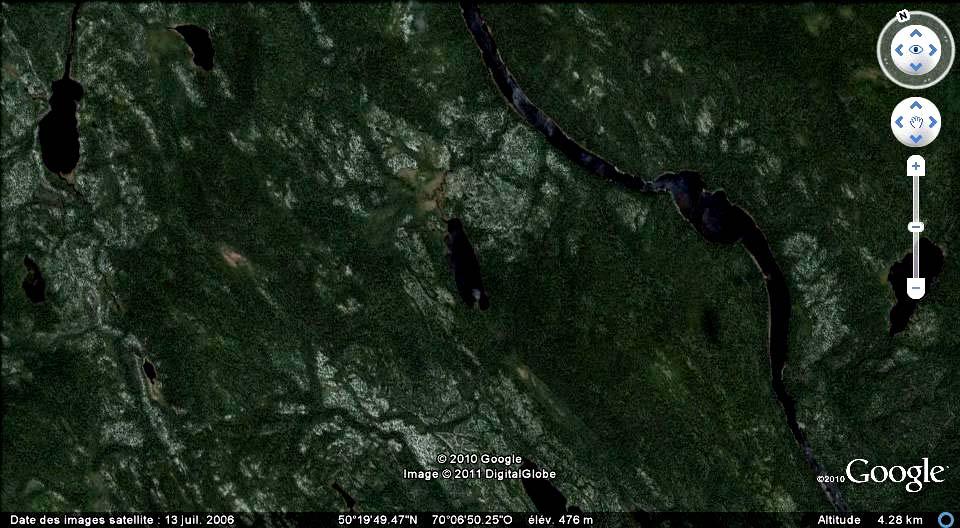
13 Support projects: Site location 7 experimental blocks among 3 sites in Québec s closed-crown boreal forest 13
 BSFM = productive")
14 Support projects: experimental design Baseline scenario (control) Open woodland (OW) Control Planted black spruces Planted jack pines Black-spruce feathermoss (BSFM) BSFM = productive control 14


15 Growth and yield of afforested OWs BSFM Planted JP OW Planted JP BSFM Planted BS OW Planted BS 65% less height growth in planted OWs than in planted BSFM 120% more height growth with jack pine than with black spruce in afforested OWs (posters #G-163 and #G-164) 15

 Projected yield: not with")
16 Growth and yield of afforested OWs Gaboury et al. (2009) Site Index used (143 cm at 10 yrs) Projected yield: not with black spruce! 16
 BSFM Fe stocks (t ha -1 ) Ca stocks")

17 Support : soil fertility OW Al stocks (t ha -1 ) Mg stocks (t ha -1 ) BSFM Fe stocks (t ha -1 ) Ca stocks (t ha -1 ) Sustained (10 years) lower nutrient stocks in OW mineral soils early growth limitation? (poster #G-162) 17
18 Support : C stock growth 70 p = 0,3124 Carbon (t/ha) Baseline scenario Afforested scenario p = 0, p = 0,0178* p = 0,0222* p = 0,9442 p = 0, Abovebground Roots Humus Mineral soil Dead wood Total 10 years after afforestation = predominance of mineral soils (first B horizon) No evidence of net C emissions after 10 years (poster #G-165) 18
19 Mature OWs VS mature BSFM stands Mature OWs Mature BSFM stands (=Baseline scenario) ( Afforestation scenario) Comparable stand characteristics (stand age, soil deposits, slope, aspect, drainage, etc.) 19

 15 t C ha -1 113 t C ha -1")
20 Mature OWs VS mature BSFM stands 80 yr-old OWs 80 yr-old BSFM stands (=Baseline scenario) ( Afforestation scenario) 15 t C ha t C ha -1 20
 Accounting")
 (from Gaboury et al.")
21 C stock : reversal risk Reversal risk management = Prevention (spatial dispersion, buffers, fuel management) Accounting (disturbance-explicit C, insurance products) Avoidance (harvested wood products + substitution) (from Gaboury et al. 2009) 21

22 22 Albedo change related forcing
? 2.")
23 Albedo change related forcing Some hypotheses to test: 1.Deciduous planted tree species (larch, birch, etc.)? 2. Inclusive baseline scenario = OWs + C-intensive products (concrete, steel, etc.) 23


24 Carbone in the voluntary C market a new research funding opportunity carboneboreal.uqac.ca 24


25 Merci! 25