A program of the WSMD within the ANR. Determines the condition of Vermont s wetlands
|
|
|
- Amos Martin
- 5 years ago
- Views:
Transcription
1
 to: current condition and water")

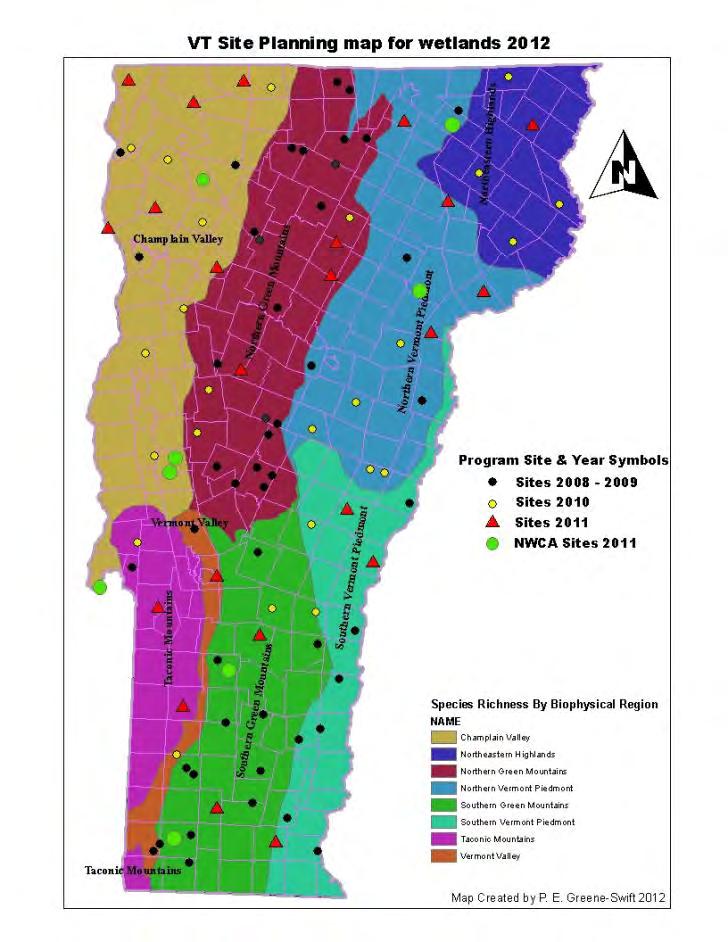
2 A program of the WSMD within the ANR A work in progress Links wetland impact(s) to: current condition and water quality the community structure of the flora water quality sampling Determines the condition of Vermont s wetlands

3 Vernal Pools and Northern White Cedar Swamps: macroinvertebrates water quality natural community ranking and condition Final report in The program restarts, inventorying lake associated and stream associated wetlands The program continues without macroinvertebrates The program focuses on refining the condition gradient using flora and water quality, and the VRAM 2012 Moving Forward: The new Floristic Quality Assessment Index (FQAI) ; VRAM; rotational basin assessment; sentinel sites
4


5 Inventory the plants and characterize the community Characterize the landscape setting and buffer condition remotely and in the field Determine potential water quality degradation sources on and off site
, and percent cover is estimated (shrubs) Soils are described using NRCS descriptions & Munsell at each plot Sources of hydrology and")
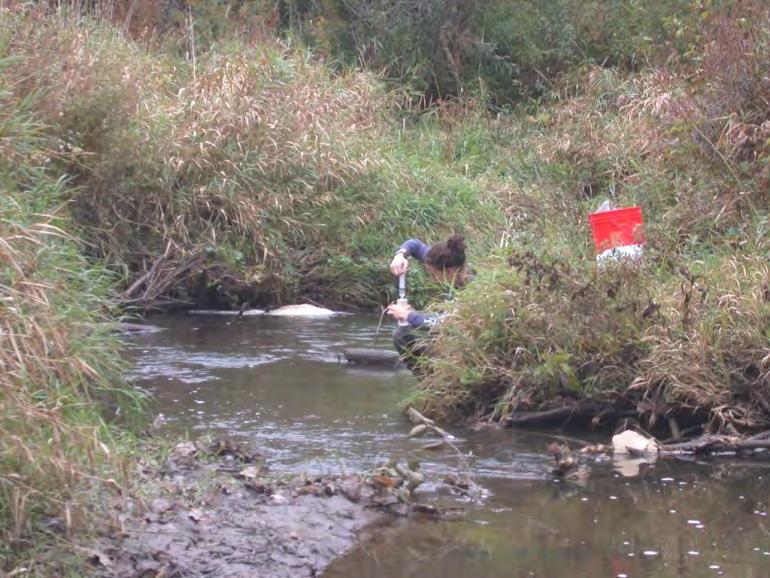
6 Sampled within each 5x5m plot: trees, shrubs, saplings, herbs, and vines Plants outside within 1m of the 5m square and RTE species anywhere outside the plot are noted Trees and shrubs within 10 meters surrounding the 5x5m plot are counted and DBH taken (trees), and percent cover is estimated (shrubs) Soils are described using NRCS descriptions & Munsell at each plot Sources of hydrology and periods of saturation/inundation are determined visually; water samples collected for chemical analysis Invasive species are indicated by percent in their strata and then noted by percent for the entire wetland sampled
7
8
9

10

11 To better understand a wetland s hydrology and stressors both permanent and ephemeral To ascertain the presence/absence of invasive species and their effect on the wetland community To determine the ecological intactness of the microtopography, water depth, habitat development, and if special wetland status is warranted To document disturbance present in the wetland and its buffer, and rate total impacts to the wetland
 1 to10 ha (2.5 to < 25 acres) (5 pts) 0.20 to <1 ha (.")
 (3 pt) *Exception - Vernal Pool or Fen Community")
12 Select one size class and assign score >10 ha (>25 acres) (5 pts) 1 to10 ha (2.5 to < 25 acres) (5 pts) 0.20 to <1 ha (.5 to < 2.5 acres) (3 pts) > 0.20 ha (< 0.5 acres) (3 pt) *Exception - Vernal Pool or Fen Community relative to size (3 5 pts) Hectares
 (7) NARROW. Buffers average 15m to < 100m (50 ft to < 325 ft) (5) VERY NARROW. Buffers average <15m (< 50 ft) (2) 2b.")
 MODERATE, Old field (>10 years), shrub lands, young second growth forest (5) MODERATELY HIGH, Residential, fenced pasture, park, conservation tillage, new fallow field (3) HIGH,")
13 2a. Calculate average buffer width. Select one type and assign score, or double check & average VERY WIDE. Buffers average >300m (>984 ft) or more (10) MEDIUM. Buffers average 100m to < 300m (326 ft to < 984 ft) (7) NARROW. Buffers average 15m to < 100m (50 ft to < 325 ft) (5) VERY NARROW. Buffers average <15m (< 50 ft) (2) 2b. Intensity of surrounding land use. Select one, or double check and average LOW, 2nd growth or older forest, wildlife preserve, etc. (10) MODERATE, Old field (>10 years), shrub lands, young second growth forest (5) MODERATELY HIGH, Residential, fenced pasture, park, conservation tillage, new fallow field (3) HIGH, Residential, transportation, industrial, open pasture, row cropping, mining, construction. (0)
 Perennial surface water (lake or stream) (3) Precipitation (1) Seasonal/Intermittent")
 Part of wetland/upland (e.g.")
 3c. Maximum water depth.")
14 3a. Sources of Water. Score all that apply Groundwater (3) Perennial surface water (lake or stream) (3) Precipitation (1) Seasonal/Intermittent surface water (2) 3b. Hydrologic Connectivity. Score all that apply Floodplain (1) Part of wetland/upland (e.g. forest), complex (1) Part of riparian/upland or stream/lake upland corridor (1) Isolated hydrology--bog or fen with no obvious hydrologic input or output (2) 3c. Maximum water depth. Select only one and assign score > 25 cm (10 in) (5) >13 cm to < 25 cm (5 < 10 in) (3) <12 cm (2) 3d. Anthropogenic modifications to natural hydrologic regime Score one or double check and average. None or none apparent (10) Recovering use for restoration or abandoned uses in wetlands (5) Recent or no recovery (0)
 Sedimentation - from an anthropogenic source (-5) Other Subtract Stressor Score Total from Total Score for Total Score Side 1 (VRAM 2.")
15 Ditching or dredging (- 5) Tiled (- 5) Dike (-5) Weir or Dam (-5) Stormwater input (- 5) Point source pollution (- 5) Filling and/or grading (- 5 ) Road bed or railroad track (-5) Sedimentation - from an anthropogenic source (-5) Other Subtract Stressor Score Total from Total Score for Total Score Side 1 (VRAM 2.2 April 1, 2012 modeled after Ohio ORAM)
 Recovering (3) Alteration present - no recovery (1) 4c.")
16 4a. Habitat development relative to community type: Select one and assign score. Excellent (5) Good (3) Poor (1) Very good (4) Fair (2) 4b. Substrate disturbance: Score one or double check and average. None or none apparent (5) Recovering (3) Alteration present - no recovery (1) 4c. Vegetation Alteration or Removal Mowing (-5) Grazing (-5) Clear-cutting (-5) Selective cutting (-5) Woody debris and/ or shrub or sapling removal (-5) Kill zone from toxic substances (-10) Herbaceous or aquatic bed removal (-5) Farming cropland (-5) Nutrient enrichment (eutrophication) (-5)
 Mature forested wetland (5) Bog (5) Northern White")
 Old growth forest (5) Alpine Peatland (5) Red or")
 Red")
 Hemlock Swamp (5) Deep Bulrush Marsh (5)")
17 Select one community and score for that type: Vernal Pool (5) Mature forested wetland (5) Bog (5) Northern White Cedar Swamp (5) Fen (5) Calcareous or Acidic Riverside Seep (5) Old growth forest (5) Alpine Peatland (5) Red or Silver Maple-Green Ash Swamp (5) Black Spruce Swamp (5) Sugar Maple-Ostrich Fern Riverine FP Forest (5) Red Maple-Black Gum Swamp (5) Calcareous Red Maple-Tamarack Swamp (5) Hemlock Swamp (5) Deep Bulrush Marsh (5) Buttonbush Swamp (5)
18 6a. Wetland Vegetation Strata Aquatic bed (floating carpets) (0 5) Emergent (0 5) Shrub (0 5) Forest (0 5) Open Water w/floating Veg. (0 5) Other 6b. Horizontal (elevation view) Interspersion. Select only one: High (5) Moderately high (4) Moderate (3) Moderately low (2) Low (1) 6c. Coverage of invasive plants Extensive >50% cover (-5) Moderate 5-25% cover (-3) Sparse 5-25% cover (-1) None (+5) 6d. Microtopography within the wetland community Vegetated hummocks or tussocks (0 5) Coarse woody debris > 6in (0 5) Standing dead >10 in dbh (0 5) Amphibian breeding pools (0 5) WETLAND CONDITION GRAND TOTAL
19 Site ID VRAM Metric 1: Wetland Area Metric 2: Upland buffers and surrounding land use Metric 3: Hydrology Metric 4: Habitat Alteration and development Metric 5: Special wetlands Metric 6: Plant communities, interspersion, microtopography Human Disturbance Ranking Disturbance Severity Landscape Quality Current Condition Dominant Wetland Type (Cowardin) JEBRO Forested Wetland LARI Forested Wetland MARI OTRI TRWR Scrub-Shrub Wetland Unconsolidated Bottom Emergent Wetland Road intersects wetland complex Some minor dumping on wetland edge Primary Disturbance Major road adjacent, filling/ grading Farming, stormwater runoff from road, filling Beaver activity, old farming fields

20 Predict undue adverse impacts WQ standards and anti-degredation Class I wetlands/class A waters/ ORW/ Very High Quality Waters Bioassessment and biocriteria system to identify wetland biological integrity
 to the exemplary reference condition wetlands (100) has proven challenging. The scoring is being revised.")
21 No water quality standards for wetlands; wetlands not addressed in standards No Floristic Quality Assessment Index (FQAI) available for Vermont until very recently The VRAM bell curve along a 100 point scale from the most disturbed wetlands (0) to the exemplary reference condition wetlands (100) has proven challenging. The scoring is being revised. Few shared resources between the Wetlands Program and Lakes, Ponds and Wadeable Streams. No permanent staff to fully support VRAM & Bioassessment, from 1998 to the present
22 VRAM reliably measures condition with predictable accuracy from most disturbed to reference condition wetlands Initial water chemistry and physical condition results correlate well with the existing VRAM Vermont now is close to having a user friendly FQAI for Coefficients of Conservatism, for all flora, to measure the tolerance plants have to disturbance and their related fidelity to Vermont s wetland communities Vermont is currently researching water quality standards for wetlands--and working with other states to attain wetland specific water quality standards Testing and tweaking of protocols have been an active part of the VRAM and sampling refinement process