SOC 60. Quantitative Analysis I. Creating Pictures
|
|
|
- Leo Newton
- 5 years ago
- Views:
Transcription
1 SOC 60 Quantitative Analysis I Creating Pictures
2 Introducing Statistics Descriptive vs. inferential statistics Preparing Data for Analysis Gather data Enter data Data matrix Clean data
3
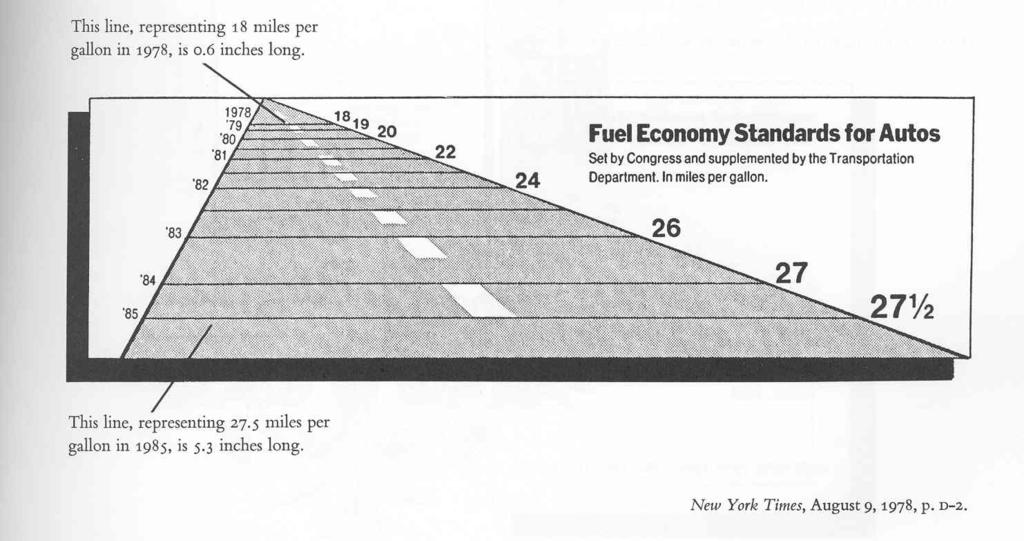
4 Lie Factor Lie factor = Size of effect shown/size of effect in data What is the actual growth from 18 to 27.5 mpg? ( )/18=.53 A growth of 53% Represented by a growth of 0.6 inches to 5.3 inches /0.6=7.83 A growth of 783% A Lie Factor of 7.83/.53=14.8
5

6 Attitudes about abortion on demand in the US. Bar Charts

7 Attitudes about abortion on demand in the US.

8 Ages of respondents on a bar chart

9 Age of respondents on a histogram Histogram
10 Describing ONE Variable What is the typical value? Central Tendency Measures Mode Median Mean How Typical is the typical value? Measures of Variation Range InterQuartile Range IQR Variance/Standard Deviation
11 Describing Relationships Between TWO Variables Tables Independent Variable Column/Dependent Variable Row Percentage Difference For dichotomies Cramer s V Gamma For nominal variables For ordinal variables difference of two column percentages in the same row 0 V 1 1 γ +1
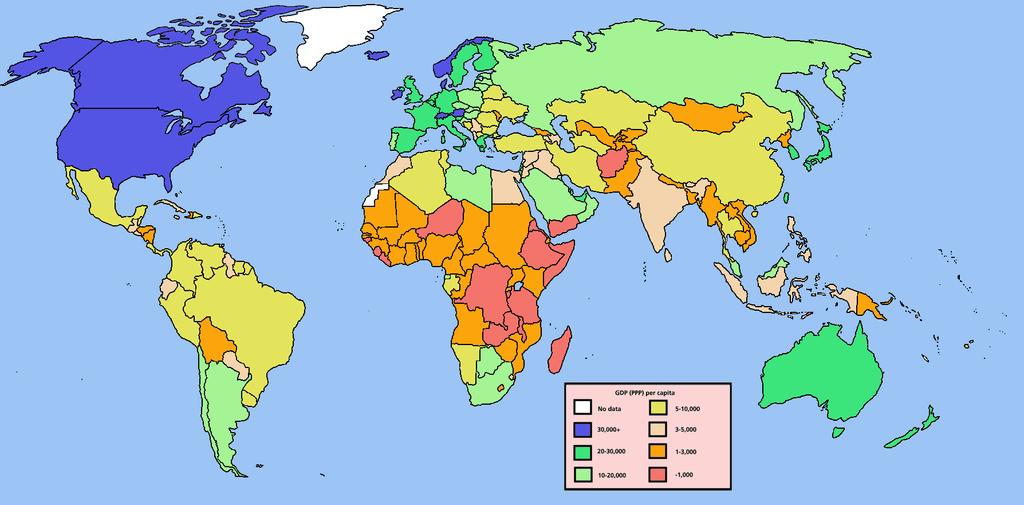
12 GNP per capita 1998, Albania 810 Algeria 1550 Angola 340 Antigua and Barbuda 8300 Argentina 8970 Armenia 480 Australia Austria Azerbaijan 490 Bahrain 7660 Bangladesh 350 Barbados 7890 Belarus 2200 Belgium Belize 2610 Benin 380 Bermuda Bolivia 1000 Botswana 3600 Brazil 4570 Brunei Bulgaria 1230 Burkina Faso 240 Burundi 140 Cambodia 280 Cameroon 610 Canada Cape Verde 1060 Cayman Islands Central African Rep. 300 Chad 230 Chile 4810 China 750 Colombia 2600 Comoros 370 Congo Dem. Rep. 110 Congo Rep. 690 Costa Rica 2780 Côte d'ivoire 700 Croatia 4520 Czech Republic 5040 Denmark Dominica 3010 Dominican Republic 1770 Ecuador 1530 Egypt 1290 El Salvador 1850 Equatorial Guinea 1500 Eritrea 200 Estonia 3390 Ethiopia 100 Fiji 2110 Finland France Gabon 3950 Gambia The 340 Georgia 930 Germany Atlas method (US Ghana 390 Greece Grenada 3170 Guatemala 1640 Guinea 540 Guinea-Bissau 160 Guyana 770 Haiti 410 Honduras 730 Hong Kong China Hungary 4510 Iceland India 430 Indonesia 680 Iran 1770 Ireland Israel Italy Jamaica 1680 Japan Jordan 1520 Kazakhstan 1310 Kenya 330 Kiribati 1180 Korea Rep Kyrgyz Republic 350 Lao PDR 330 Latvia 2430 Lebanon 3560 Lesotho 570 Liechtenstein Lithuania 2440 Luxembourg Macedonia FYR 1290 Madagascar 260 Malawi 200 Malaysia 3600 Maldives 1230 Mali 250 Malta 9440 Marshall Islands 1540 Mauritania 410 Mauritius 3700 Mexico 3970 Micronesia Fed. Sts Moldova 410 Monaco Mongolia 400 Morocco 1250 Mozambique 210 Namibia 1940 Nepal 210 Netherlands New Zealand Nicaragua 390 Niger 190 Nigeria 300 Norway Pakistan 480 Panama 3080 Papua New Guinea 890 Paraguay 1760 Peru 2460 Philippines 1050 Poland 3900 Portugal Romania 1390 Russian Federation 2300 Rwanda 230 Samoa 1020 São Tomé & Principe 280 Senega l 530 Seychelles 6450 Sierra Leone 140 Singapore Slovak Republic 3700 Slovenia 9760 Solomon Islands 750 South Africa 2880 Spain Sri Lanka 810 St. Kitts and Nevis 6130 St. Lucia 3410 St. Vincent&Gr 2420 Sudan 290 Suriname 1660 Swaziland 1400 Sweden Switzerland Syrian Arab Republic 1020 Tajikistan 350 Tanzania 210 Thailand 2200 Togo 330 Tonga 1690 Trinidad and Tobago 4430 Tunisia 2050 Turkey 3160 Uganda 320 Ukraine 850 United Arab Emirates United Kingdom United States Uruguay 6180 Uzbekistan 870 Vanuatu 1270 Venezuela 3500 Vietnam 330 Yemen Rep. 300 Zambia 330 Zimbabwe /databytopic/databytopic.html #MACROECONOMICS AND GROWTH
13
14 1.Liechtenstein Luxembourg Switzerland Norway Bermuda Denmark Japan Cayman Islands Singapore United States Iceland Austria Germany Sweden Belgium Monaco France Netherlands Finland Brunei Hong Kong China United Kingdom Australia Italy Canada Ireland Un. Arab Emirates Israel New Zealand Spain Greece Portugal Slovenia Malta Argentina Antigua&Barbuda Korea Rep Barbados Bahrain Seychelles Uruguay St.Kitts&Nevis Czech Republic Chile Brazil Croatia Hungary Trinidad&Tobago Mexico Gabon Poland Mauritius Slovak Republic Botswana Malaysia Lebanon Venezuela St. Lucia Estonia Grenada Turkey Panama Dominica South Africa Costa Rica Belize Colombia Peru Lithuania Latvia St.Vincent&Gr Russian Fed Belarus Thailand Fiji Tunisia Namibia El Salvador Micronesia Dominican Rep Iran Paraguay Tonga Jamaica Suriname Guatemala Algeria Marshall Islands Ecuador Jordan Eq. Guinea Swaziland Romania Kazakhstan Egypt Macedonia FYR Vanuatu Morocco Bulgaria Maldives Kiribati Cape Verde Philippines Samoa Syrian Arab Rep Bolivia Georgia Papua N. Guinea Uzbekistan Ukraine Albania Sri Lanka Guyana China Solomon Islands Honduras Côte d'ivoire Congo Rep Indonesia Cameroon Zimbabwe Lesotho Guinea Senegal Azerbaijan Armenia Pakistan India Haiti Mauritania Moldova Mongolia Ghana Nicaragua Benin Comoros Bangladesh Kyrgyzistan Tajikistan Angola Gambia The Kenya Lao PDR Togo Vietnam Zambia Uganda C. African Rep Nigeria Yemen Rep Sudan Cambodia São Tomé & Pr Madagascar Mali Burkina Faso Chad Rwanda Mozambique Nepal Tanzania Eritrea Malawi Niger Guinea-Bissau Burundi Sierra Leone Congo Dem. Rep Ethiopia 100
15 GNPCAP98
16 GNPCAP98 Frequency Percent Valid Percent Cumulative Percen Valid
17 Central Tendency Measures What is the typical value? Mode Median 50 th percentile Mean (Average) ΣX i /N
18 Examples Number of children people have: 0,0,0,0,0,1,1,2,2,2,3,3,4,5, Frequency Distribution N= 15 Mode 0 Median 2 Mean =30 30/15=2
19
20 Which central tendency measure to use when? Mode Median Mean Nominal Yes No No Ordinal Yes Yes No Interval and Ratio Yes Yes Yes
21 Measures of Variability How typical is the typical value? Range Maximum-Minimum Interquartile Range Difference between the 25 th and 75 th percentile Variance Average Squared Deviation from the Mean Σ[Xi-Mean(Xi)] 2 /N Corrected variance Σ[Xi-Mean(Xi)] 2 /(N-1)
22 Measures of Variability (cont.) Standard Deviation Square root of variance ( Xi Xi / N) s = N 1 2
23 Example N=15 Mean=2 # kids(x i ) [X i -Mean(X i )] [X i -Mean(X i )] =-2 (-2) 2 = =-2 (-2) 2 = =-2 (-2) 2 = =-2 (-2) 2 =4 Variance: 62/15= =-2 (-2) 2 = =-1 (-1) 2 = =-1 (-1) 2 = =0 (0) 2 = =0 (0) 2 =0 Corrected Variance 62/14= =0 (0) 2 = =+1 (1) 2 = =+1 (1) 2 = =+2 (2) 2 = =+3 (3) 2 = =+5 (5) 2 =25 Total 62
24 Measures of Variability (cont.) Standard Deviation σ Square root of variance Z-score or Standard Score Z=(Score-Mean)/Standard Deviation Tells you how many standard deviations away you are from the mean. Chebycheff s theorem If a Z score k>1 the probability of being this far or farther away from the mean is not more than 1/k 2 P( Z >=k) < =1/k 2 Eg.: If k= 4 P<1/16 or P<.0694
25 Which variability measure to use when? Range Interquartile Range Nominal No No No Variance/ Stand.Dev. Ordinal Yes Yes No Interval/ Ratio Yes Yes Yes