Using quantitative forest structure targets: the good, bad, and ugly
|
|
|
- Ethel Hubbard
- 5 years ago
- Views:
Transcription
1 Using quantitative forest structure targets: the good, bad, and ugly Kevin R. Gehringer, Ph.D. Biometrics Northwest LLC SAF 2010 National Convention October Albuquerque, New Mexico
2 Introduction Why? Definition Quantitative target components Washington State s Forests and Fish Law Target descriptions Target Comparison Part 1: Data Target Comparison Part 2: Models The good, bad, and ugly
3 Why is this important? Quantitative forest structure targets can: Reduce management uncertainty by clearly specifying the desired forest structure objectives Reduce regulatory uncertainty by clearly specifying the desired forest structure objectives With tight financial margins and increasing regulatory pressures it is critical to know what the forest structure objectives are
4 Definition A quantitative target consists of numerical assessment criteria derived from a reference data set selected to represent a desirable outcome or set of conditions that are specified by a distribution of numerical attribute values The distribution of attribute values may be used directly or indirectly Direct: Approximate distribution of attributes Indirect: Summary statistics of attributes
5 Target components Target data: A well defined, pedigreed data set that is representative of the desired forest structures used to define assessment criteria Observations: actual data or output from a credible forest growth model that are to be assessed relative to the targeted criteria Assessment: A statistically and biologically consistent assessment procedure
6 Should Target data be clearly and unambiguously defined be pedigreed: minimum of peer review of sampling and/or analysis methods be representative of desired forest structures be multidimensional to better specify a target Why? You re going to derive assessment criteria from them
7 Observations Actual measurement data to assess whether management objectives or regulatory criteria have been met on the ground Output from a credible forest growth or other model for assessment during planning and management scenario development Credible implies a model that is consistent with reality for the attributes of interest
8 Assessment Statistical consistency Emphasize the distribution, joint distribution for multiple dimensions, of the target data when establishing the assessment criteria Biological consistency Use actual data to derive assessment criteria Use relevant attributes Aim for the relevant part of the distribution State-space may be more relevant than attributes vs. time
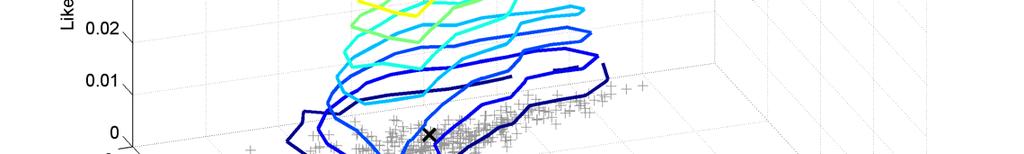
9 Consistency example
10 Forests and Fish Law Specifies riparian forest management rules for Washington State since 2001 Different rules for eastern and western Washington Focus on western Washington rules Defines width of riparian management zone (RMZ) for each side of a stream using Douglas-fir site potential tree height
11 Forests and Fish Law (cont.) Each RMZ is divided into three subzones parallel to a stream A 50 foot wide no harvest zone adjacent to the stream An inner zone where limited harvest may be permitted subject to leave tree and other constraints An outer zone where harvest is permitted subject to leave tree and other constraints Inner and outer zone widths vary by site class and stream width: < 10 ft or 10 ft
12 Forests and Fish Law (cont.) Assessments are performed in two steps: Growth model projections of current conditions to an age of 140 years Comparing core and inner zone combined basal area per acre (BAPA) to a threshold at 140 years BAPA < threshold: no inner zone harvest BAPA threshold: inner zone harvest is permitted provided the residual trees when projected allow the BAPA threshold to be met at 140 years
13 Forests and Fish Law (cont.) Inner zone leave tree requirements: Option 1 (the complicated option): Thin from below, leaving at least 57 TPA (conifer) with DBH 12 inches or the largest TPA in the harvested area Option 2 (the less complicated option): Remove trees furthest from the stream first, up to 30 ft (< 10) or 50 ft ( 10 ft ) from the core zone boundary, leaving at least 20 TPA (conifer) with DBH 12 inches or the largest trees in the harvested area
14 Forests and Fish Law (cont.) Outer zone leave tree requirements Option 1: 20 TPA (conifer) with DBH 12 inches May be reduced by LWD placement or trees located in channel migration zones on a basal area-for-basal area basis Option 2: 20 TPA (conifer) with DBH 12 inches May be reduced to a minimum of 10 TPA (conifer) if the core and inner zones have a projected BAPA surplus at age 140 on a basal area-for-basal area basis
15 Forests and Fish Law (cont.) The BAPA thresholds are referred to as the desired future conditions (DFC) target Given the complexity of the rules, a DFC model was created to provide a simple to use tool to perform the assessments The DFC model consists of thousands of growth model runs for a wide variety of initial stand conditions and thinning treatments converted into lookup tables for interpolation
16 Forests and Fish Law (cont.) The initial (interim) DFC BAPA targets were site class dependent Site class I: 285 sq ft per acre Site class II: 275 sq ft per acre Site class III: 258 sq ft per acre Site class IV: 224 sq ft per acre Site class V: 190 sq ft per acre Current DFC target One size fits all 325 sq ft per acre
17 Forests and Fish Law (cont.) Initial (interim) BAPA targets were negotiated based on a found data set pieced together from several sources WA collected its own riparian data set, the DFC validation data set (DFCVDS) To perform hypothesis tests to validate or invalidate the interim BAPA targets To derive alternative BAPA, or other, targets Current BAPA DFC value is the DFCVDS median
18 Forests and Fish Law (cont.) Management objective Create or retain stands that will develop characteristics similar to mature, unmanaged conifer dominated or mixed riparian stands when they reach age 140 DFCVDS objective Document characteristics of mature, 140 year old, unmanaged conifer and mixed composition riparian stands in western Washington
19 Data descriptions Two target data sets are considered DFCVDS: The conifer dominated riparian forest data collected by Washington State FIAREF: A reference data set for Douglas-fir dominated stands from the FIA IDB v2.0 consistent with the stated sampling objectives of the DFCVDS but emphasizing Douglas-fir Both data sets are used to define targets and as observations to be assessed relative to those targets
20 DFCVDS description 113 sample plots Targeted age 140: 120 to 160 years (map) Got ages from 80 to 200+ (field) Sampled conifer dominated and mixed stands Majority of plots in the Coast and Cascade Ranges Filtered sample: potential sample plots removed If they had < 30% canopy closure Or the had conditions unsuitable for tree growth: rock outcrops, talus slopes, landslide scarps or standing water Potential for selection bias toward stands with more complete stocking
21 FIAREF description 553 sample plots from FIA IDB v2.0 Age range from 100 to 180 years Douglas-fir dominated stands At least 50% of BAPA Douglas-fir and FIA stand type of Douglas-fir Not specifically riparian For gross characteristics likely not an issue All plots are not demonstrably untreated Given natural variability, likely not an issue
22 Target types Forests and Fish Law minimum BAPA Nonparametric targets using approximate joint distribution of TPA and quadratic mean diameter (QMD) for 95%, 90%, 80%, and 50% acceptance regions centered on the mode of the TPA-QMD distribution Why TPA-QMD? Used to compute BAPA: separate values avoids size-density issues for equal BAPA
23 Four targets are compared SI/BA: Site class dependent BAPA targets OSFA/BA: One size fits all BAPA target FIAREF: TPA-QMD Douglas-fir dominated reference condition target from the FIA IDB DFCVDS: TPA-QMD conifer dominated DFC validation data set target from Washington State

24 FIAREF Targets DFCVDS Targets
25 Caveats Apples and oranges comparisons Conifer dominated DFCVDS vs. Douglas-fir dominated FIAREF Lowland Douglas-fir zone is typical area of application for Forests and Fish Law Hence Douglas-fir site classes in Forests and Fish Law, but applied across conifer species Use of DFCVDS and BAPA targets here is consistent with that of Washington State
26 Comparison part 1: Data Assess each data set against each target Compute an acceptance percentage for each data set, target, and acceptance level Compare assessments Look for statistical and biological consistency Potential bias
27 FIAREF assessment results Target Name 95% 90% 80% 50% SI/BA 47% 47% 47% 47% OSFA/BA 13% 13% 13% 13% FIAREF 95% 90% 80% 50% DFCVDS 80% 61% 51% 20%
28 FIAREF 95 %
29 FIAREF 90%
30 FIAREF 80%

31 FIAREF 50%
32 DFCVDS assessment results Target Name 95% 90% 80% 50% SI/BA 88% 88% 88% 88% OSFA/BA 50% 50% 50% 50% FIAREF 94% 88% 83% 39% DFCVDS 94% 88% 79% 49%
33 DFCVDS 95%
34 DFCVDS 90%
35 DFCVDS 80%
36 DFCVDS 50%
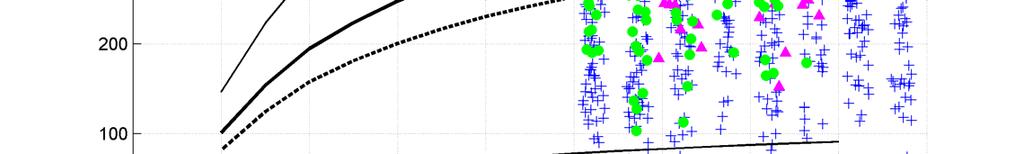
37 Data: Potential bias Issues to consider Conifer vs. Douglas-fir stands Riparian vs. upland stands Untreated vs. manipulated stands Compare with historic reference: Bulletin 201 McArdle, R.E., Meyer, W.H., and D. Bruce. 1949, The yield of Douglas-fir in the Pacific Northwest. Washington, DC. USDA Forest Service Tech. Bul. No p. (rev.)
38 Data: scatter plot

39 Data: BAPA all stands
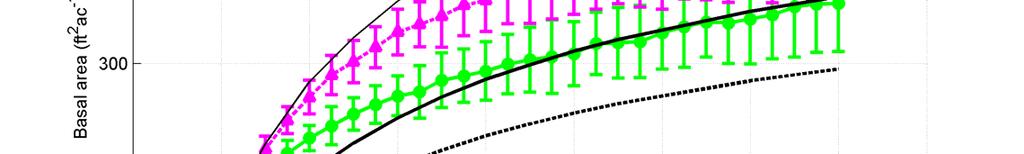
40 Data: BAPA summary all stands
41 Data: BAPA SC-II
42 Data: BAPA summary SC-II
43 Comparison part 2: Models Project five management scenarios with two growth models Compute assessments and acceptance percentages for each target and model Acceptance level of 90% for 2-D targets Compare assessments Look for statistical and biological consistency Potential bias
44 Models used ORGANON-SMC V 6.0 Model used to create the DFC Model assessment tool ORGANON-SMC 8.x (8.2 used here) New version initially released November 2005 New diameter growth, height growth, and mortality equations for Douglas-fir and western Hemlock Models used out of the box
45 Management scenarios Douglas-fir dominant/pure stands Site Class II: feet at 50 years Scenarios 50 foot no harvest with 50 year rotation Bio-Pathway (produces multistory canopy) Forest and Fish Option 2 10 feet Forest and Fish Option 2 < 10 feet No action
46 Forests and Fish Law RMZ definition Core: 0-50 feet Inner: feet for stream width < 10 feet feet for stream width 10 feet Outer: 114 or 120 to 170 feet Option 2 (the simple option) Increases no harvest buffer to 80 or 100 feet for stream widths < 10 feet or 10 feet Minimum BAPA 275 ft 2 ac -1 for SI/BA (initial rules) 325 ft 2 ac -1 for OSFA/BA (current rules)
47 Initial conditions/treatments 471 TPA planted Douglas-fir stand 20 years old Site index 120 feet at 50 years Located in southwest Washington Treatments Do nothing 50 year rotation with multiple thinnings Multiple thinnings with underplanting 10 and 20 TPA leave tree 50 year rotations
48 Results: Forest and Fish Law Target SI/BA age 140 OSFA/BA age 140 Model O6.0 O8.2 O6.0 O ft no harvest Yes No No No Bio-Pathway Yes No No No FF Option 2 10 Yes Yes Yes No FF Option 2 < 10 Yes Yes Yes No No Action Yes Yes Yes Yes
49 Results: TPA-QMD Target 90% Target FIAREF DFCVDS Model O6.0 O8.2 O6.0 O ft no harvest 100% 100% 38% 34% Bio-Pathway 100% 100% 34% 21% FF Option % 100% 79% 72% FF Option 2 < % 100% 69% 55% No Action 83% 83% 83% 83%
50 Models: Potential bias Issues to consider Model bias State space vs. time-attribute trajectories Compare with historic reference: Bulletin 201: McArdle, R.E., Meyer, W.H., and D. Bruce. 1949, The yield of Douglas-fir in the Pacific Northwest. Washington, DC. USDA Forest Service Tech. Bul. No p. (rev.)

51 Time-Attribute Trajectory

52 State space trajectory
53 Relevant attributes Why use BAPA as surrogate for riparian forest function? Tree size, distance to stream are most relevant What about an estimate of large woody debris supply from the adjacent forest? Two components: pieces and volume Proposed target (not by me!) Box constraints using median values as minimums Excludes mode of distribution

54 Large woody debris supply
55 The good Using quantitative targets Multidimensional targets/joint distribution Statistically and biologically consistent assessment methods Using attributes directly related to problem of interest, if available, rather than correlated surrogates
56 The bad Using weakly correlated surrogate attributes Biased data sets or models Single value lower bounds Inappropriate lower bounds, e.g., median values
57 The ugly Leaving the mode out of an acceptance region Marginal distribution based box constraints Single point in time assessments Difficult to maintain assessment tools Complex rules with little direct scientific justification for the complexity
58 Take home messages Be sure your data represent what you want or say you want to target Be sure the output from models you use is close enough to reality to be useful Be sure to select relevant attributes Be sure to use statistically and biologically consistent assessment methods
59
60 Consistency example
61 Target types Two types of targets considered Minimum BAPA as in Forests and Fish Law Multivariate, nonparametric targets using approximate joint distribution of TPA and quadratic mean diameter (QMD) for 95%, 90%, 80%, and 50% acceptance regions centered on the mode of the TPA-QMD distribution Interested in investigating statistical and biological consistency of targets
62 Multivariate target
63 Nonparametric target

64 FIAREF targets
65 DFCVDS targets
66 Data: BAPA summary all stands


67 Data: BAPA summary SC-II
68 50 ft no harvest O6.0 O8.2
69 Bio-pathway O6.0 O8.2
70 FF Option 2 10 O6.0 O8.2
71 FF Option 2 < 10 O6.0 O8.2
72 No action O6.0 O8.2