CHAPTER 2 FOREST THE PROTECTOR AND PROVIDER
|
|
|
- Donald Clark
- 5 years ago
- Views:
Transcription
1
2
3 CHAPTER 2 FOREST THE PROTECTOR AND PROVIDER Introduction The term Forest is generally defined as a large area covered chiefly with trees and undergrowth. The services provided by forests cover a wide spectrum of ecological, economic, social and cultural considerations and processes. A multitude of benefits are received from them which includes goods such as timber, food, fuel and bio-products; ecological functions such as carbon storage, nutrient cycling, water and air purification, and maintenance of wildlife habitat; and social and cultural benefits such as recreation and spirituality. The contribution of forest resources in protecting top soil, watershed and irrigation structures, reclaiming land from the sea, protecting coastal areas from storm damage and in maintaining and upgrading the environmental quality is much beyond quantification. The range of essential ecosystem services provided by forests further extend to other aspects such as health (through disease regulation), livelihoods (providing jobs and local employment), water (watershed protection, water flow regulation, rainfall generation), nutrient cycling and climate security. Intergovernmental Panel on Climate Change (IPCC), 2013 specifically mentions that protecting tropical forests therefore not only has a double-cooling effect, by reducing carbon emissions and maintaining high levels of evaporation from the canopy, but is also vital for the continued provision of essential life-sustaining services. Though these services are obviously essential for the well-being of people and the planet, they remain undervalued and therefore, cannot compete with the more immediate gains delivered from converting forests into commodities (Mitchel et al., 2008) 1. Recognizing that ecosystem services operate from local to global scales and are not confined within national borders and that the existence of mankind relies on them, it is in collective interest to ensure their sustained provisioning into the future. It is no surprise, therefore, that economic, social and environmental importance of ecosystem services provided by forests is increasingly recognized globally and forms the core of many discussions and resolutions worldwide. The primary challenge for 1 Mitchell, A.W., Secoy, K., Mardas, N., Trivedi, M., Howard, R. and Parker, C. (2008). Forests NOW in the Fight Against Climate Change. Forest Foresight Report 1.v4 Global Canopy Programme, Oxford. pp.23;
4 sustainable forest management is finding ways to continue to benefit from ecological services without compromising the forest s ability to provide those services. Owing to factors such as over exploitation, conversion of forestland into cropland, forest fires and uncontrolled grazing, there is a need to enhance or maintain the forest resources both in terms of their area and quality so as to ensure that these essential services continue to be received by mankind in a sustainable manner. The 2030 Agenda for Sustainable Development adopted by countries across the world, lists out the Sustainable Development Goals, an intergovernmental set of aspirations with 17 goals and 169 specific targets to be achieved over the next 15 years. Of these global goals and targets, as many as 21 targets spread over 8 SDGs are directly or indirectly related to forestry activities. But forests are linked to the other SDGs as well this can be exemplified by defining forestry to include all of the ways that forests and trees contribute to sustainable development (CIFOR, ). With the forest cover in India occupying more than 20% of the total geographical area of country, forests plays an important role in sustainable development, especially due to their role in providing livelihood to a significant portion of the population and hence in income generation. Concept of Forest Accounts in SEEA-CF Forests are at the centre of many environmental and economic issues including climate change, biodiversity protection, tourism, soil erosion, stability of water cycles etc. Forest accounts provide a framework in this context to capture the economic contribution of forests and their connection with the economy. Recognizing the fact that timber is a prime economic resource, SEEA-Central Framework prescribes the compilation of physical asset accounts for forest and other wooded land (the term forests would be used to refer to forest and other wooded land in the rest of this chapter for the sake of simplicity) in conjunction with the compilation of asset accounts for timber resources. In principle, however, accounts for forests are a type of land account. A key distinction between the asset accounts for forests and those for timber resources is that the scope of timber resources is not limited to timber from forests. For example, depending on their significance, orchards would fall within scope of timber resources but are not considered areas of forests. In addition, while the asset account for timber 2 Centre for International Forestry Research (CIFOR) EnviStats-India 2018: Environmental Accounts
5 resources is focused on the volume of timber resources rather than on the area of land covered by forests, the focus of the asset accounts for forests is on changes in the area due to activities like deforestation and afforestation. Nevertheless, despite having the clear distinction in purpose and scope, there are strong connections between asset accounts for timber resources and those for forests. This is because the majority of timber resources are found in forest areas. Asset Accounts for Forests Forest land, as per FAO Global Forest Resources Assessment 2010, is defined as land spanning more than 0.5 hectares with trees higher than 5 metres and a canopy cover of more than 10 per cent, or trees able to reach these thresholds in situ. The scope of the asset accounts for forests follows a land use perspective. Thus, it does not include land that is predominantly under agricultural or urban land use and is not strictly defined on the basis of changes in tree-covered areas. Forest land is classified according to different types of forest. Forest land can be further classified as naturally regenerated forest (including primary forest) and planted forest. Other wooded land is land not classified as forest land, spanning more than 0.5 hectares; with trees higher than 5 metres and a canopy cover of 5-10 per cent, or trees able to reach these thresholds in situ; or with a combined cover of shrubs, bushes and trees above 10 per cent. It does not include land that is predominantly under agricultural or urban land use. The structure of physical asset account for forests as per the SEEA-CF is given in the Table 2.1 below. It shows the opening and closing stock by area and changes in the area of forests. The area of forests should be measured inclusive of relevant access roads, rivers and streams. Table 2.1: Physical asset account for forests Type of forests Primary Other Planted forest naturally forest regenerated forest Opening stock of forests Additions to stock Afforestation Natural expansion Total additions to stock Reductions in stock 2.3 EnviStats-India 2018: Environmental Accounts Other wooded land Total
6 Deforestation Natural regression Total reductions in stock Closing stock of forests Forests in India In India, the term Forest Cover 3 refers to all lands more than one hectare in area with a tree canopy of more than 10% irrespective of land use, ownership and legal status. It may include even orchards, bamboo and palm and is assessed through remote sensing. In India, forest cover has been classified in terms of the following tree canopy density: Very Dense Forest(VDF) All lands with tree canopy density of 70% and above Moderately Dense Forest(MDF) All lands with tree canopy density of 40% - 70% Open Forest (OF) All lands with tree canopy density of 10% - 40% Scrub Degraded forest lands with canopy density less than 10% In addition, the term Recorded Forest Area or Forest Area refers to all the geographical areas recorded as Forests in government records. Recorded forest area consists of Reserved Forest, Protected Forest or any area notified under the provision of Indian Forest Act, 1927 or any state act or local laws. The recorded forest area may also include all such areas which have been recorded as forests in the revenue records. As per Champion and Seth, 1968 classification, Indian forests can be classified into four major classes namely tropical, sub-tropical, temperate and alpine. These major classes are further divided into 16 type groups. The regional distribution of the forest type is given in the Table As per India State of Forest Report (ISFR), Forest Survey of India (FSI) 2.4 EnviStats-India 2018: Environmental Accounts
7 S. No. Table 2.2: Regional distribution of the forest types in India Forest Type Group General Composition Regional Occurrence (States of India) 1 Himalayan Dry Temperate Forests (HDTF) 2 Himalayan Moist Temperate Forest (HMTF) 3 Montane Wet Temperate Forests (MWTF) Temperate Forests Coniferous forests with sparse Jammu & Kashmir and Himachal Pradesh xerophytic under-growth Evergreen forests mainly sclerophyllous oak and coniferous species Evergreen without coniferous species Sub-alpine & Alpine Forests 4 Sub- Alpine Stunted deciduous or evergreen forests, usually close formation with or without conifers 5 Moist Alpine Scrub Low but often dense scrub of evergreen species 6 Dry Alpine Scrub Xerophytic scrub in open formation mostly of deciduous in nature 7 Sub-Tropical Broad- Leaved Hill Forests (STBLHF) 8 Sub-Tropical Dry Evergreen Forests (STDEF) 9 Sub-Tropical Pine Forests (STPF) 10 Littoral and Swamp Forests (L&SF) 11 Tropical Dry Deciduous Forests (TDDF) 12 Tropical Dry Evergreen Forests (TDEF) 13 Tropical Moist Deciduous Forests (TMDF) 14 Tropical Semi- Evergreen Forests (TSEF) 15 Tropical Thorn Forests (TTF) 16 Tropical Wet Evergreen Forest (TWEF) Broad-leaved largely evergreen high forests Low xerophytic forest and scrubs Himachal Pradesh. Jammu & Kashmir and Uttar Pradesh Arunachal Pradesh, Manipur and Nagaland Arunachal Pradesh, Himachal Pradesh, Jammu & Kashmir and Uttar Pradesh Arunachal Pradesh, Himachal Pradesh, Jammu & Kashmir and Uttar Pradesh Arunachal Pradesh, Himachal Pradesh, Jammu & Kashmir and Uttar Pradesh Sub-tropical Forests Assam and Meghalaya Himachal Pradesh and Jammu & Kashmir Pine associated predominates Arunachal Pradesh, Haryana, Himachal Pradesh, Jammu & Kashmir, Manipur, Meghalaya, Nagaland, Punjab and Uttar Pradesh Tropical Forests Mainly evergreens of varying density and height but always associated predominantly with wetness Entirely deciduous or nearly so top canopy uneven rarely over 25 m high Hard leaved evergreen trees predominates with some deciduous emergent often dense but usually under 20 m high Dominants mainly deciduous but sub-dominants and lower story largely evergreen top canopy even and dense but 25m high Dominants includes deciduous species but evergreens predominant Deciduous with low thorny trees and xerophytes predominant top canopy more or less broken, less than 10 m high Dense tall forests, entirely evergreen or nearly so Andhra Pradesh, Gujarat, Maharashtra, Odisha, Tamil Nadu, West Bengal and Andaman & Nicobar Islands. Andhra Pradesh, Bihar, Gujarat, Haryana, Himachal Pradesh, Karnataka, Madhya Pradesh, Maharashtra, Jammu & Kashmir, Odisha, Punjab, Rajasthan, Tamil Nadu, Uttar Pradesh and West Bengal. Andhra Pradesh and Tamil Nadu Andhra Pradesh, NER excluding Arunachal Pradesh & Sikkim, Bihar, Gujarat, Karnataka, Kerala, Madhya Pradesh, Maharashtra, Odisha, Tamil Nadu, Uttar Pradesh, West Bengal, Andaman & Nicobar Islands, Goa and Dadra & Nagar Haveli. Assam, Karnataka, Kerala, Maharashtra, Nagaland, Odisha, Sikkim, Tamil Nadu, Andaman & Nicobar Islands and Goa. Andhra Pradesh, Gujarat, Haryana, Himachal Pradesh, Karnataka, Madhya Pradesh, Maharashtra, Punjab, Rajasthan, Tamil Nadu and Uttar Pradesh. NER excluding Meghalaya and Tripura, Karnataka, Kerala, Tamil Nadu, Andaman & Nicobar Islands and Goa. 2.5 EnviStats-India 2018: Environmental Accounts
8 India is one of the few countries which have a National Forest Policy since The policy has been revised twice in 1952 and 1988 to account for the changing circumstances. It is currently under revision and the draft National Forest Policy 2018 aims to integrate the vision of sustainable forest management by incorporating elements of ecosystem security, climate change mitigation and adaptation, forest hydrology, participatory forest management, urban forestry, robust monitoring and evaluation framework and establishment of mechanisms to oversee multi-stakeholder convergence in forest management, while building on the rich cultural heritage of co-existence and relying on the rich and diverse forest resources. The new draft policy has the objective to safeguard the ecological and livelihood security of people, of the present and future generations, based on sustainable management of the forests for the flow of ecosystem services. The new policy also aims to bring a minimum one-third of India s total geographical area under forest cover through scientific interventions and enforcing strict rules to protect the dense cover. Unlike the previous policies, which focused on environmental stability and maintenance of ecological balance, the 2018 policy focuses on the international challenge of climate change. Forest Cover Forest Survey of India, under the MOEF&CC, has been bringing out a biennial publication, India State of Forest Report (ISFR), since The report provides state/district-wise forest cover of the country and changes thereon with respect to the previous assessment, with a specific reference to the forest cover in hill and tribal areas, as also in the north-eastern states. It also provides the estimates of growing stock within and outside the forest areas, carbon stock and tree, bamboo & mangrove cover. In addition, the report includes information on water bodies in the forest and forest fires. As per India State of Forest Report 2017, the total forest cover of the country is 7, 08,273 sq. km. which is 21.54% of the total geographic area of the country. From the distribution of forest cover given in the Table 2.3 and Figure 2.1, it can be seen that the total forest cover has marginally increased by 0.54% from to This increase is notable since an area of sq. km. of forest land has been diverted during the period under the Forest (Conservation) Act 1980 for various developmental works such as road and railway construction, mining activities, power & irrigation projects as also industrial requirements. The state-wise distribution of forest cover of the same period is given at Annexure EnviStats-India 2018: Environmental Accounts
 Forest Classes Assessment Period (2004-05) Assessment Period (2010-11) Assessment Period (2015-16) ISFR 2005 ISFR 2013 ISFR 2017 Very Dense Forest 83,472 83,502 98,158 Moderately Dense Forest")
 Very Dense Forest 2.54 2.54 2.99 Moderately Dense Forest 9.73 9.70 9.38 Open Forest 8.72 8.99 9.18 Total Forest Cover 21.00 21.23 21.54 Scrub 1.26 1.")
9 FOREST THE PROTECTOR AND PROVIDER Table 2.3: Forest Cover of India in terms of canopy density cover (sq. km.) Forest Classes Assessment Period ( ) Assessment Period ( ) Assessment Period ( ) ISFR 2005 ISFR 2013 ISFR 2017 Very Dense Forest 83,472 83,502 98,158 Moderately Dense Forest 3,19,948 3,18,745 3,08,318 Open Forest 2,86,751 2,95,651 3,01,797 Mangroves Total Forest Cover 6,90,171 6,97,898 7,08,273 Scrub 41,286 41,383 45,979 Non-Forest 25,55,806 25,47,982 25,33,217 Percentage to Total Geographic Area (%) Very Dense Forest Moderately Dense Forest Open Forest Total Forest Cover Scrub Non-Forest Figure 2.1: Forest Cover in India % Very Dense Forest Moderately Dense Forest Open Forest Scrub The ISFR 2017 report also reveals that 15 States/UTs have more than 33 per cent of the geographical area under forest cover. Out of these States and Union Territories, seven States/UTs have more than 75% forest cover namely Mizoram, Lakshadweep, Andaman & Nicobar Islands, Arunachal Pradesh, Nagaland, Meghalaya and Manipur, while EnviStats-India 2018: Environmental Accounts
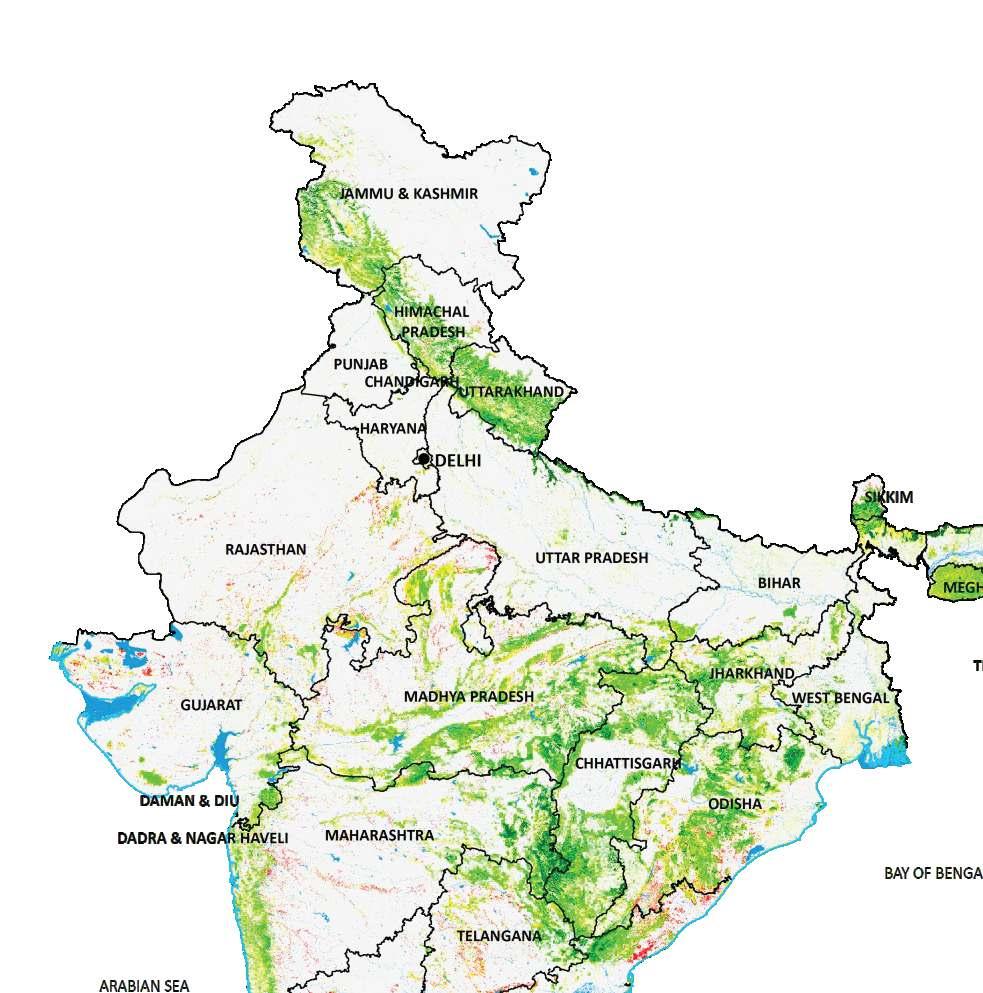
10 states namely Tripura, Goa, Sikkim, Kerala, Uttarakhand, Dadra & Nagar Haveli, Chhattisgarh and Assam have forest cover between 33% and 75%. The total forest cover in the North-Eastern Region is 1,71,306 sq. km., which is 65.34% of its geographical area in comparison to the national forest cover of 21.54%. Madhya Pradesh (77,414 sq. km.) has the largest forest cover in the country in terms of area, followed by Arunachal Pradesh (66,964 sq. km.) and Chhattisgarh (55,547 sq. km.). In terms of percentage of forest cover with respect to the total geographical area, Lakshadweep with (90.33%) has the highest forest cover, followed by Mizoram (86.27%) and Andaman and Nicobar Island (81.73%). The State-wise analysis of forest cover (as per Annexure 2.1) from to shows that the total forest cover area as percentage to the total geographical area has increased in the State of Kerala (8%) followed by West Bengal (4%) and 2% each in the States of Odisha, Tamil Nadu, Goa and Manipur. The majority of increase in the total forest cover area has been contributed by very dense forest and open forest in the States of Kerala and Tamil Nadu; very dense and moderate forest in Manipur; open forest in the States of West Bengal, Odisha and Goa. Similarly, the forest cover has shown decrease in the States of Nagaland (7%), Tripura (4%), Mizoram (2%) and Dadra & Nagar Haveli (2%). This decline in the total forest cover area has been on account of decrease in the moderate and open forests in Nagaland and moderate forest in Mizoram & Dadra & Nagar Haveli. The State of Tripura also shows an increase in the area of very dense and moderate forest accompanied by a simultaneous decrease in the open forest by 44% from to Growing Stock The precise information on growing stock, which is a measure of tree wealth and includes distribution of stems in different diameter class, volume, biomass, carbon stock etc. both within and outside forest area, is required for strategic planning of the forestry sector at various levels. Traditionally, growing stock is considered as an important indicator of forest health and productivity. The growing stock is estimated through forest inventory under which both qualitative and quantitative parameters are recorded. The growing stock at all India level is presented in Table 2.4 which shows that total growing stock substantially decreased by 7.22% from to but increased by 2.90% in Similarly, the growing stock within forest decreased by 7.23% from to but later increased by 1.07% in EnviStats-India 2018: Environmental Accounts

11 (ISFR 2009) (ISFR 2013) (ISFR 2017) Table 2.4: All India Growing Stock (million cum) In Forest In Trees Outside Forest (TOF) Total The state-wise estimate of growing stock for both within as well as outside forest areas for the years , and is given at Annexure 2.2. In the North-Eastern region, total growing stock has decreased from million cum in to million cum in The States of Arunachal Pradesh and Assam, which contribute around 58% of growing stock within the NE Region, have shown a significant reduction in growing stock within the forest. Most of the remaining states have shown mixed trends in the growing stock during the period. The changes in the growing stocks in the States during to are depicted in the Figure 2.2. Figure 2.2: Change in Growing Stock from to From to , almost all the states have shown decline in growing stock except Goa and Sikkim. However, from to , even though there was a marginal change in Forest cover in Assam and Uttarakhand, growing stock has significantly reduced by more than 10%. But in case of Jharkhand, Madhya Pradesh, 2.9 EnviStats-India 2018: Environmental Accounts
12 Maharashtra and Rajasthan despite a marginal change in Forest cover, growing stock has significantly increased by more than 10%. Carbon Stock The variability in climate, referred to as climate change, poses a threat to the environment and quality of human life all over the world. The parties to the United Nations Framework Convention on Climate Change (UNFCCC) have undertaken a comprehensive exercise to address the issues of climate change adaptation and mitigation, in which forests play an important role. Forests sequester and store more carbon than any other terrestrial ecosystem and are, therefore, an important natural deterrent to climate change. The total carbon stocked in the forests is divided into five pools by Good Practice Guidance (GPG) 4 and the emission factors are derived from the assessments of changes in carbon stocks in these carbon pools. The living portion of biomass carbon is classified as above ground biomass (AGB) and below ground biomass (BGB) and stores significant amount of carbon. The dead organic matter (DOM) is classified as dead wood and litter. The fifth pool is soil organic carbon (SOC) which contains substantial amount of organic carbon. The national level estimates of carbon stock for and under different pool is given in the Table 2.5. Table 2.5: Carbon Stock in forests between and Component Carbon Stock in forests in Carbon Stock in forests in (Million tonnes) Net Change in Carbon Stock Above Ground Biomass Below Ground Biomass Dead wood Litter Soil Organic Carbon Total It can be seen from Table 2.5 that there is an increase of 419 million tonnes of carbon stock in as compared to the estimates of , with an average annual increase of carbon stock of about million tonnes. Soil organic carbon is the largest pool of carbon followed by AGB, BGB, Litter and Dead Wood. State-wise estimate of EnviStats-India 2018: Environmental Accounts
13 carbon stock for the years and is given in Annexure 2.3 and 2.4. Around 42% of increased carbon stock at the national level is contributed by five states Arunachal Pradesh, Jammu & Kashmir, Madhya Pradesh, Odisha and West Bengal. State/ UT-wise analysis shows that Arunachal Pradesh, Sikkim and Andaman & Nicobar Island each have maintained more than 14 thousand tonnes carbon stock per sq. km. Similarly, the States of Karnataka, Kerala, Jammu & Kashmir, Himachal Pradesh, Uttarakhand and Nagaland have maintained 10 to 12 thousand tonnes carbon stock per sq. km. Physical Asset Account for Forests The framework suggested in the SEEA CF as mentioned in the Table 2.1 for preparation of physical asset account for forests requires detailed information on the sources of addition in stock and reduction in stock. In view of the limited availability of such details, an abridged version of the asset account is given in Table 2.6. Table 2.6: Physical Asset Account for Forests (Area in sq. km.) Opening Changes during the period Closing Class Stock in Additions Reductions stock in to stock in stock Very Dense Forest Moderately Dense Forest Open Forest Scrub Non Forest Total Opening Changes during the period Closing Class Stock in Additions Reductions stock in to stock in stock Very Dense Forest Moderately Dense Forest Open Forest Scrub Non Forest Total EnviStats-India 2018: Environmental Accounts
14 Some of the salient changes highlighted by the physical asset account of forests is given below: Changes from to Under the Very Dense Forest (VDF), more than 90% of the addition was contributed by Moderately Dense Forests. On the other hand, conversion of VDF to MDF and open forest was the major reason for the reduction in this class of forest. Under the Moderately Dense Forest (MDF), more than 56% of the addition was contributed by open forest followed by non-forest (36%). On the other side, the degradation of MDF to open forest (46%) and non-forest (45%) was the major reason for reduction in this class of forest. Under the Open Forest, more than 70% of the addition was contributed by nonforest followed by MDF (23%). Similarly, conversion of open forest to MDF (35%) and degradation of forest to non-forest (60%) was the major reason for reduction in this class. Under the scrub, more than 60% of the addition was contributed by non-forest followed by open forest (34%). On the other hand, conversion of scrub forest to open forest (50%) and degradation of scrub forest to non-forest (46%) was the major reason for the reduction in this class. The non-forest area decreased by 2.98% (% of forest area) on account of conversion of non- forest area into forest area. The conversion of major non-forest area into 2.48% open forest followed by 0.51% moderate dense forest. On the other hand, the forest area has also reduced by 2.14% (% of Total Forest Area) on account of diversion of forest area into non-forest area. The major reduction in forest area contributed by open forest (1.35%) followed by moderately dense forest (0.79%). Changes from to Under the Very Dense Forest (VDF), more than 88% of the addition was contributed by Moderately Dense Forests. On the other hand, conversion of VDF to MDF (77.32%) was the major reason for reduction in this class of forest. Under the Moderately Dense Forest (MDF), more than 69% of the addition was contributed by open forest followed by non-forest (15%). On the other side, the conversion of MDF to VDF (40%) and degradation of MDF to open forest (37%) and non-forest (22%) was the major reason for reduction in this class of forest EnviStats-India 2018: Environmental Accounts
15 Conclusion Under the Open Forest, more than 58% of the addition was contributed by nonforest followed by MDF (26%). Similarly, conversion of open forest to MDF (45%) and degradation of forest to non-forest (45%) was the major reason for reduction in this class. Under the scrub, more than 80% of the addition was contributed by non-forest followed by open forest (17%). On the other hand, conversion of scrub forest to open forest (52%) and degradation of scrub forest to non-forest (45%) was the major reason for the reduction in this class. The non-forest area decreased by 6.96% (% of Total Forest Area) on account of conversion of non- forest area into forest area. The conversions of major nonforest area into 4.29% open forest followed by 2.048% scrub and 0.63% moderate dense forest. On the other hand, the forest area has also reduced by 4.90% (% of Total Forest Area) on account of diversion of forest area into non-forest area. The major reduction in forest area contributed by open forest (2.86%) followed by moderately dense forest (1.17%) and scrub (0.87%). Compilation of forest statistics and accounts play significant role in incorporating the forests in the planning processes. In view of their contribution towards food security, livelihoods and the many products and ecosystem services they provide, SDG 15, Life on land, puts forests and mountains at the centre of the sustainability of terrestrial ecosystems. The targets explicitly refer to forests and sustainable forest management, and also on land degradation and conservation of mountain ecosystems. Accurate information on a country s forest area is crucial for forest policy and planning. Changes in forest area reflect changes in demand for land for other uses and may help in identifying (un)sustainable practices in the forest and agriculture sectors. Monitoring the information can help in identifying negative change factors such as overgrazing, land clearing, urbanization, timber extraction, wood fuel collection and fire as also positive factors such as land restoration, reforestation, afforestation and sustainable agricultural practices EnviStats-India 2018: Environmental Accounts