Identifying and and Understanding Carbon Cycle Implications of of North American Natural and and Anthropogenic Disturbances:
|
|
|
- Bruce Boone
- 5 years ago
- Views:
Transcription
1 Identifying and and Understanding Carbon Cycle Implications of of North American Natural and and Anthropogenic Disturbances: Progress Progress Report Report NRA-04-OES-01 NRA-04-OES-01 Christopher S.R. Neigh Compton J. Tucker G. James Collatz Goddard Space Flight Center Hydrospheric and Biospheric Sciences Laboratory Code 614.4

2 Carbon Cycle North American Carbon Sink, What controls it??? Bousquet, et al. 1999, Pacala, S.W., et al., 2001, Caspersen, et al.,, Hicke, J.A., et al., 2004
3 Schematic of Research Objectives Identified regions of Change NDVI Bi-monthly anomaly Identified causes of Change Landsat Land Cover ETM+ TM 1990 MSS 1975 Climate Identified amounts of Carbon Change CASA Biogeochemistry Model Carbon NPP NEP NBP
 NIR = Channel 2 (0.73-1.")
4 NDVI = (NIR-VIS)/(NIR+VIS) VIS = Channel 1 ( µm) NIR = Channel 2 ( µm) 8km pixel resolution 1982-> Present
5 GIMMS AVHRR NDVI Anomaly
6 GIMMS AVHRR NDVI Anomaly

7 GIMMS AVHRR NDVI Anomaly ?
8 Landsat Classification Methods: Geocover Orthorectified Landsat TM (i.e., ETM+) All Bands 1( µm), 2 ( ), 3 ( ), 4 ( ), 5 ( ) & 7( ) 28.5 m spatial resolution Landsat MSS All bands: 1 ( µm), 2 ( ), 3 ( ), & 4 ( ) 57 m spatial resolution Classified using Isodata Clustering & Multidate Tassel Cap Transformation IGBP Land Cover Classes Needleleaf evergreen Mixed Needle leaf evergreen Broadleaf Deciduous Broadleaf Deciduous Dwarf Trees and Shrubs Short Vegetation Grassland Agriculture C3 Vegetation Water Barren Clouds and Snow

9 Landsat Classification Methods: Leaf-on ISODATA Interpret/ Recode Land Cover B,G,W Multidate Tassel Cap ISODATA Mask Change on Classification 1990 B,G,W 1975 B,G,W Identify Change Clusters

10 Landsat Land Cover Results for the Yukon Yukon & Northwest Territories Land Cover 1990 Note: current results are illustrative and not yet validated 1990 Millions Needleleaf Evergreen Mixed Broadleaf/Needleleaf Evergreen Broadleaf Decidous Dwarf Trees Shrubs Short Vegetation/C4 Grassland Agriculture/C3 Grassland Water Barren Cloud IGBP classes Hectaress


11 Landsat Land Cover Results for Northern Saskatchewan Northern Saskatchewan Land Cover Note: current results are illustrative and not yet validated Needleleaf Evergreen Mixed Broadleaf/Needleleaf Evergreen Broadleaf Decidous Dwarf Trees Shrubs Short Vegetation/C4 Grassland Agriculture/C3 Grassland Water Barren Cloud Hectaress Millions IGBP classes Saskatchewan Fire Fire Disturbance Trends Hectares Year Year Hectares burned for for all all of of Saskatchewan from the the Canadian Forest Service


12 Landsat Land Cover Results for Quebec Quebec Land Cover Needleleaf Evergreen Mixed Mixed Broadleaf/Needleleaf Evergreen Broadleaf Decidous Dwarf Dwarf Trees Trees Shrubs Short Short Vegetation/C4 Grassland Agriculture/C3 Grassland Water Water Hectaress Millions Barren Cloud Cloud IGBP IGBP classes Note: current results are illustrative and not yet validated

13 Landsat Land Cover Results for Labrador and Newfoundland Newfoundland & Labrador Land Cover Needleleaf Evergreen Mixed Broadleaf/Needleleaf Evergreen Broadleaf Decidous Dwarf Trees Shrubs Short Vegetation/C4 Grassland Agriculture/C3 Grassland Water Barren Cloud Hectaress Millions IGBP classes Note: current results are illustrative and not yet validated 1990
14 Land Cover Summary Observed Land Cover change: Northern Saskatchewan & Quebec Reduction in needle leaf evergreen forests Regeneration following fire or logging Minimal changes in Land Cover: Yukon/Northwest Territories & Newfoundland/Labrador


15 Carbon, Succession, & NDVI After the initial Disturbance it has been noted net primary productivity exceeds respired carbon for ~120 years into the future creating a Carbon Pool 8/27/1989, 453-RGB 8/27/1989, NDVI 6/01/2001, 453-RGB 6/01/2001, NDVI
16 Daily Meteorological Station Data
17 Climate Indices Temperature Extremes- Number of days above 0 C and 32.2 C Easterling et al Growing Season Length First appearance of five consecutive days above 5 C to the last apperance of five consecutive days below 5 C Peterson and Folland, Frich et al. 2002, Robeson et al Frost Days Defined as the number of days in a year with the daily minimum air temperature equal to or below 0 C Feng et al. 2004, Robeson et al Frost Free Days Defined as the number of days between the last frost day in spring and the first frost day in Autumn of the same year Feng et al. 2004, Robeson et al Extreme Precipitation- Number of Days exceeding 50.8 mm annually (2 inches) Karl 1996
18 Climate Trends North West Territories/Yukon Marked increase growing season length (90s) & Marked decline in snow depth (80s & 90s) Warmer Northern Saskatchewan Increase in growing season length (80s & 90s) Decline in precipitation (80s & 90s) Small decline in snow depth (80s & 90s) Warmer & Dryer Southern Saskatchewan/Dakotas Increase in growing season length (80s & 90s) Increase in Precipitation (90s) Warmer & Wetter Texas/Oklahoma Pan Handle No Marked Changes Southern Quebec Slight increase in growing season length (80s & 90s) Slight decline in snow depth (90s) Newfoundland/Labrador Marked increase in growing season length (90s) Decline in snow depth (90s) Warmer
19 Next Steps (Work in Progress ) Quantify Climate Disturbances Complete Land Cover Maps Validate Land Cover Maps CASA Biogeochemical Modeling
20
21 Theoretical model of Proposed Research Tasks NDVI NDVI GIMMS G 8km 8km Bi-monthly Location anomaly Identified areas areas of of Change MrSID 256m 256m LC LC Change No No Change Logging Fire Fire USFS USFS CFS CFS Hectares Year 1 LCLUC Climate Landsat ETM+ ETM+ TM TM MSS MSS GISS GISS GHCN 28.5m LC LC Monthly Precipitation Temperature Daily Daily Precipitation Temperature Short Short vegetation C4/grassland Agriculture C3/grassland Irrigated agriculture Dwarf trees trees and and shrubs Mixed broadleaf & needleleaf Needleleaf-evergreen Broadleaf-deciduous Agriculture USDA USDA CCA CCA LUC LUC By By County Corn Corn Sorghum Wheat Cause CMS CMS Daily Daily Precipitation Temperature Snow Snow Depth Growing Season Station Observations Identified causes of of Change LAI LAI FPAR FPAR Year 2 CASA CASA LAI LAI FPAR FPAR Solar Solar radiation Light Light utilization efficiency Temperature Precipitation Soil Soil type type deg deg Precipitation Carbon NPP NPP NEP NEP Identified amounts of of CO CO 2 Change 2 NCEP/NCAR deg deg Temperature Amount USDA USDA SURGO 2 km km Soil Soil Legend Primary Objectives Remote Sensing Data Data Statistical Data Data Conceptual Objectives Data Data Description Direct Input Conceptual Input
22 Theoretical model of Proposed Research Tasks NDVI NDVI GIMMS G 8km 8km Bi-monthly Location anomaly Identified areas areas of of Change MrSID 256m 256m LC LC Change No No Change Logging Fire Fire USFS USFS CFS CFS Hectares Year 1 LCLUC Climate Landsat ETM+ ETM+ TM TM MSS MSS GISS GISS GHCN 28.5m LC LC Monthly Precipitation Temperature Daily Daily Precipitation Temperature Short Short vegetation C4/grassland Agriculture C3/grassland Irrigated agriculture Dwarf trees trees and and shrubs Mixed broadleaf & needleleaf Needleleaf-evergreen Broadleaf-deciduous Agriculture USDA USDA CCA CCA LUC LUC By By County Corn Corn Sorghum Wheat Cause CMS CMS Daily Daily Precipitation Temperature Snow Snow Depth Growing Season Station Observations Identified causes of of Change LAI LAI FPAR FPAR Year 2 CASA CASA LAI LAI FPAR FPAR Solar Solar radiation Light Light utilization efficiency Temperature Precipitation Soil Soil type type deg deg Precipitation Carbon NPP NPP NEP NEP Identified amounts of of CO CO 2 Change 2 NCEP/NCAR deg deg Temperature Amount USDA USDA SURGO 2 km km Soil Soil Legend Primary Objectives Remote Sensing Data Data Statistical Data Data Conceptual Objectives Data Data Description Direct Input Conceptual Input


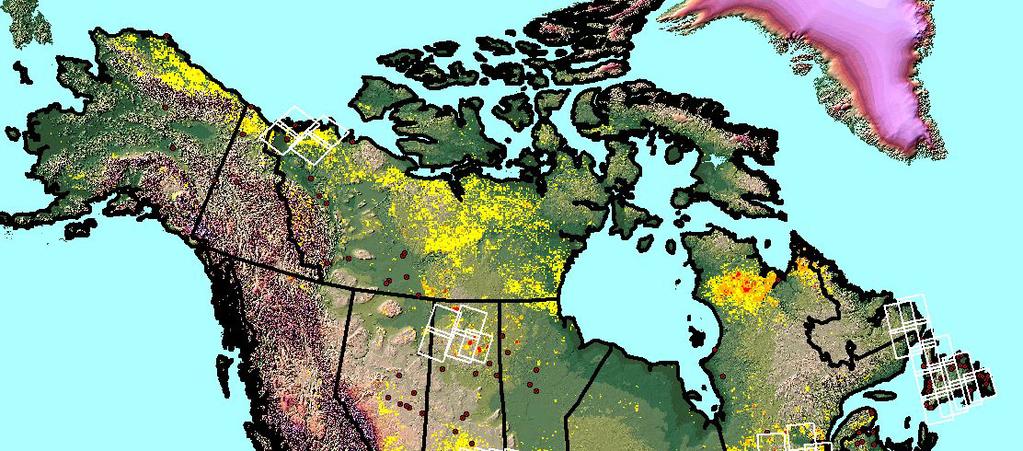
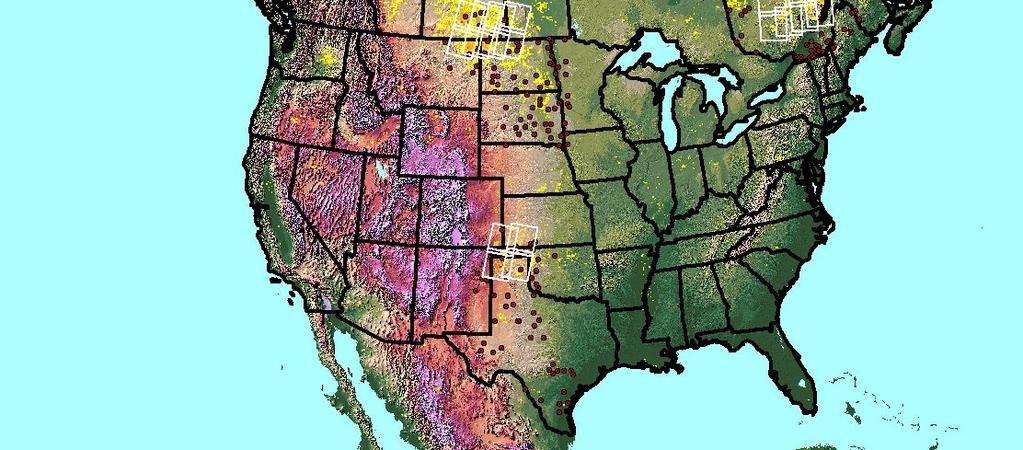
23 Geographic locations of Regional Study Sites and Data
24 Land Cover Validation Dataset Production Land Cover 1990 Land Cover 1975 Land Cover In Situ Field Samples In situ Aerial GPS Photography Isolated Land Cover Change Sites From predetermines Sampling Distribution Historical Air Photos Validation Dataset
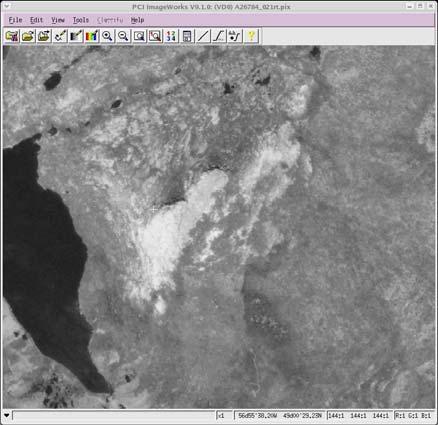
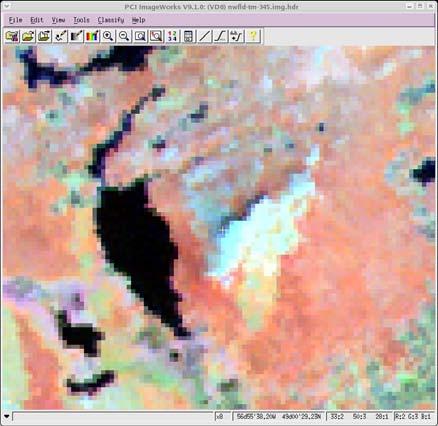


25 Validation Example Air Photo ETM+ 4,5,3 R,G,B Stehman et al (NLCD)


26 Air Photo Validation Example ETM+ 4,5,3 R,G,B