GLOBAL PARTNERSHIP FOR BUSINESS AND BIODIVERSITY (Third Meeting) Canadian Peat Industry s Sustainability. MONTREAL, CANADA October 2/3, 2013
|
|
|
- Sharon Parsons
- 5 years ago
- Views:
Transcription
")

1 GLOBAL PARTNERSHIP FOR BUSINESS AND BIODIVERSITY (Third Meeting) Canadian Peat Industry s Sustainability MONTREAL, CANADA October 2/3, 2013

2 Overview Canadian peatland resource Peatland restoration research Sustainability Initiatives Conclusions
3
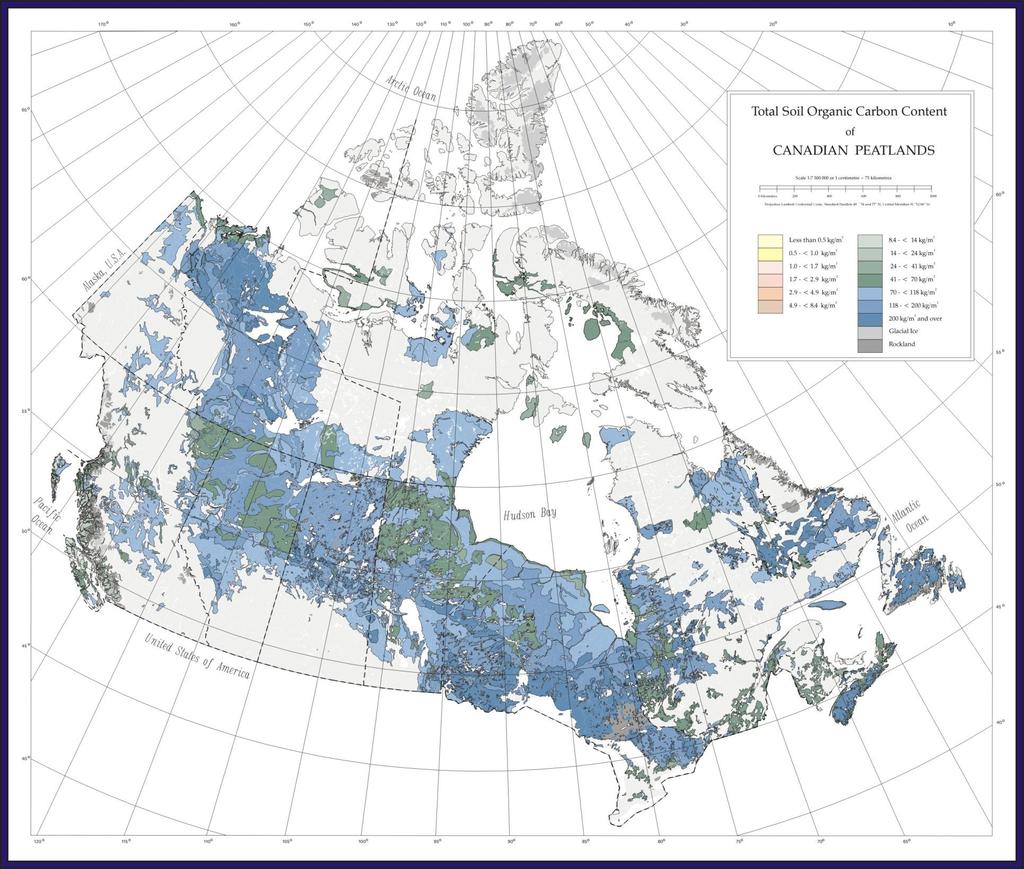
4 Canadian peatland resource Over 70 million 1 tonnes of peat accumulates each year in Canada 1.3 million 2 tonnes of peat is harvested each year in Canada 1. Canadian Peat Harvesting and the Environment, Second Edition, Issues Paper, No , North American Wetlands Conservation Council 2. Statistics Canada, 2005 (

5 Peatland uses in Canada 81% Virgin Peatlands 15% Agriculture 0.8% Urban Development 0.8% Reservoirs 0.7% Misc. Development 0.3% Ports 0.02 % Forestry 0.016% Peat Moss Production


6 Importance of peat in horticulture Peat is underpinning of multi-billion dollar horticultural industry.

7 Importance of peat in horticulture Canada is largest producer of horticultural peat. Supplies 98% of Sphagnum peat to U.S.


8 Restoration Progress since 1992 Restoration workshop in 1992 Greenhouse experiments in 1992 Field experiments in 1997 Full scale restoration in hectare industrial restoration in 2000
 appointed chair In 2008 a second five-year term of the Industrial Research Chair began There are 17 Canadian peat producers that are")
9 Chair in Peatland Management In 2003, established first five-year term of the Industrial Research Chair in Peatland Management Line Rochefort (U. Laval) appointed chair In 2008 a second five-year term of the Industrial Research Chair began There are 17 Canadian peat producers that are partners
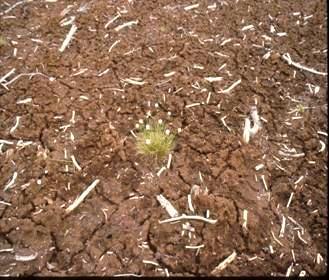
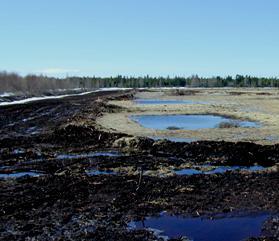
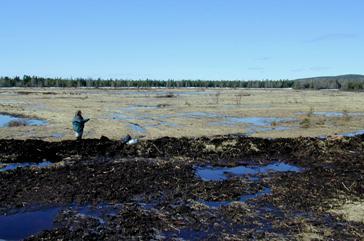

10 2000 Restoration of Peatland Ecosystem: the Case of Bois-des-Bel


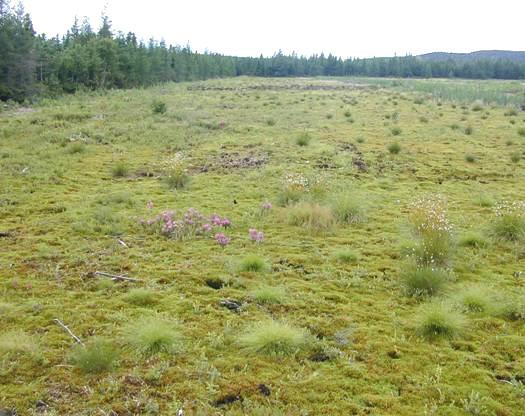
11 Current state of knowledge: Biodiversity Peat moss abundance in restored peatland Experimental site Bois-des-Bel Central Quebec Restored in 2000 Sphagnum cover increase = production and decomposition


12 Current state of knowledge : Biodiversity of restored sites Number of plant species Unrestored Restored Natural Plant composition Berries Forest plants Peatland species Wetland species Blueberry Cranberry Cloudberry


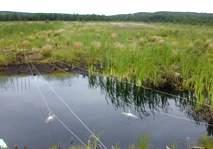
13 Current state of knowledge : Biodiversity of restored sites Birds: Coleoptera: Amphibian s: Some species typical of natural peatlands are present Low abundance Species are different than in natural peatlands Higher abundance

14 Current state of knowledge: Carbon cycling in peatlands Unrestored Restored Natural CO 2 Carbon dioxyde Source Sink or Source Sink CH 4 Methane Source Source Source Net balanc e Source Sink or Source Sink
15 Peat Industry Sustainability Initiatives Strategy for Responsible Peatland Management. (IPS Sponsored) Life Cycle Assessment Studies. Certification: Peatland Harvesting. Industry Social Responsibility Report
16 Approaches Canadian Sphagnum peatmoss CSR process Diagnostic Strategic integration Stakeholder dialogue CSR reporting Supply chains Sector Environmental dimension ( ) Social dimension ( ) Economic dimension ( ) Soc Env Gov Eco Issues identification and prioritization (adaptation of SAFA framework) E- LCA S- LCA I/O SAFA (V.1.1) Focus groups Indicators Commitments External review 16

17 Horticultural peat life cycle


18 Life cycle impact assessment: From cause to effect According to the IMPACT methodology (2003, 2011)


19 The Social LCA perspective A recent assessment tool (2009) Assesses behavior not processes By identifying the organizations involved all along a product s life cycle By referring to a list of issues of concern Related to five main stakeholder categories Workers Consumers Society Local communities Suppliers & partners
20 COMMUNAUTÉS LOCALES ET SOCIÉTÉ Dével. durable App. responsable Certification GRH Travail-famille Accueil TRAVAILLEURS Équité/Égalité Gestion des risques Lutte à la discrimination Éducation Primes Intégration Avantages sociaux Emploi local Vacances Cohabitation Salaire Consultation Plan d intervention Engagement Entretien préventif Communication Rétroaction CONSOMMATEURS Achat local SST Activités de prévention Exigences Collaboration FOURNISSEURS
21
22 Implementation Seven peat producers have achieved certification. Approximately 70% of the peat produced is covered under this certification label. additional companies are in the process of acquiring certification.

23 THE SOCIAL RESPONSIBILITY REPORT
24 Context and objectives Structure and organise in a coherent and systematic way the various LCA-based initiatives as well the Veriflora certification process conducted so far by the industry Identify a recognized accounting method suited to the need of the CSPMA Make an Industry Social Responsibility (ISR) Report to provide a benchmark for sustainable accounting of the industry s social, environmental and economic impacts Communicate information to stakeholders on the performance, targets, and actions planned towards sustainability indicators; highlights the actions taken by the sector toward sustainability and sets the stepping stones for the future 24
 pilot project The")


25 Sustainability Assessment of Food and Agriculture systems (SAFA) pilot project The SAFA framework An international reference tool for assessing the sustainability performance of food and agriculture businesses Based on selected sustainability themes, sub-themes and indicators of performances Developed by United Nations Food and Agriculture Organization (FAO) over a 4 year period as a holistic proposal for assessing sustainable agriculture The SAFA guidelines are a test version 23 pilots from developed and developing countries Peat moss (Canada) 25
26 Approaches Canadian Sphagnum peatmoss CSR process Diagnostic Strategic integration Stakeholder dialogue CSR reporting Supply chains Sector Environmental dimension ( ) Social dimension ( ) Economic dimension ( ) Soc Env Gov Eco Issues identification and prioritization (adaptation of SAFA framework) E- LCA S- LCA I/O SAFA (V.1.1) Focus groups Indicators Commitments External review 26

27 For the coming years, priorities are to: Encourage sustainability research in environmental areas that impact the peat moss industry Ensure that restoration of post-harvest sites are conducted by the association s members in accordance with government compliance Enhance close, positive and supportive relationships with various levels of government including the First Nations Engage in constructive dialogue with NGO, and consumer stakeholders 27
28 Thank you 28
29 results
30 LOCAL COMMUNITIES AND SOCIETY WORKERS CONSUMMER SUPPLIERS
31 COMMUNAUTÉS LOCALES ET SOCIÉTÉ Dével. durable App. responsable Certification GRH Travail-famille Accueil TRAVAILLEURS Équité/Égalité Gestion des risques Lutte à la discrimination Éducation Primes Intégration Avantages sociaux Emploi local Vacances Cohabitation Salaire Consultation Plan d intervention Engagement Entretien préventif Communication SST Rétroaction Activités de prévention CONSOMMATEURS Achat local Exigences Collaboration FOURNISSEURS
32 COMMUNAUTÉS LOCALES ET SOCIÉTÉ Dével. durable App. responsable Certification GRH Travail-famille Accueil TRAVAILLEURS Équité/Égalité Gestion des risques Lutte à la discrimination Éducation Primes Intégration Avantages sociaux Emploi local Vacances Cohabitation Salaire Consultation Plan d intervention Engagement Entretien préventif Communication Rétroaction CONSOMMATEURS Achat local SST Activités de prévention Exigences Collaboration FOURNISSEURS
33 Canadian Peatlands: Climate Change Globally peatlands storage estimated between 455 Gt carbon (C) (Gajewske et al. 2001). In Canada, peatlands store an estimated 147 Gt C (Tarnocai, 2006).
34 Peatlands: Wildfire vs. Harvesting Direct and indirect effects of fire amounts to a source to the atmosphere totaling 23.1 Mt CO 2 y -1 (6.3 Mt C yr -1 ) in western Canada. It is estimated that decomposition from all harvested peatlands in Canada is 0.26 Mt CO 2 yr -1 (0.07 Mt of C y)

35 Canadian Peatlands: Industry Emissions A study was conducted to examine the net GHG from the horticultural harvesting process. The study revealed that the entire life cycle of peat extraction emitted 0.54 Mt of CO 2 in 1999 rising to 0.89 Mt CO 2 in The study showed that 71% of the emissions was associated with peat decomposition, 15 % from land use change, 10% from transportation to market and 4% from processing (Cleary et al., 2005).
36 Canadian Industry Restoration While emission studies from restored peatlands in Canada are limited, emissions from European studies suggest that restored peatlands can be annual sinks of g CO 2 m 2 y -1 [31 g C m 2 y] (Yli-Petays et al., 2007). If applied to current restoration, this would amount to 2000 t CO 2 m 2 of current sequestration a year with an additional uptake of 4000 t CO 2 m 2 yr -1 in the future.
37 Canadian Peat Emissions Canadian peat horticultural emissions (all sources) of (0.89 Mt) represent 0.03 per cent of all degraded peatlands (3 Gt) worldwide. Emissions are per cent of all total global net anthropogenic emissions (15.7 Gt). With national total GHG in Canada at 771 Mt CO 2 in 2006, the peat industry represented 0.1% of total GHG. Manitoba s GHG emissions are 20.8MT CO2/yr.


38 C sources ±8940 Gg C yr -1 Flooding: Gg C Fire: Gg C C sinks Thaw: Gg C Mining: - 50 Gg C Extraction: Gg C = C balance
 in Canada, in 2006, and distribute and use them in greenhouse in Canada, US or Japan. Use category 1.")
39 E-LCA for growth media: what did we compare? Functional Unit : Providing 1 m 3 of horticultural substrate (professional use) in Canada, in 2006, and distribute and use them in greenhouse in Canada, US or Japan. Use category 1. High Porosity Professional Physicochemical parameters 1 to 5 Referenc e use Annual/ Perennial Reference mix Peat/perlite Substitution mix 1. Coco duo: coir and crush 2. Peat/Barks 3. Sawdust/Peat 4. Coco coir/barks 2. All-Purpose Professional 1 to 5 in greenhous e production Peat/perlite/ vermiculite 1. Peat/Barks 2. Sawdust/Peat 3. Sifted peat 4. Compost/Barks/Peat 5. Coco coir 3. Retail None Flower box Best seller (peat based) Best seller (without peat)


40 E-LCA results for growth media 1 m³ of horticultural substrate (professional use)


41 E-LCA results for growth media 1 m³ of horticultural substrate (professional use)


42 Four-level evaluation scale Risky behaviour Compliant behaviour Proactive behaviour A behaviour that may have negative consequences A normal and minimally expected behaviour An in-between socially responsible behaviour Assessed using benchmarks such as best expected practices Committed behaviour A leading socially responsible behaviour