Monitoring Potential Climateinduced Impacts on Woodland Habitats with Earth Observation Methods
|
|
|
- Darleen Lawson
- 5 years ago
- Views:
Transcription

1 Image_ RapidEye Neusiedler See Monitoring Potential Climateinduced Impacts on Woodland Habitats with Earth Observation Methods Michael Förster, Tobias Schmidt, Birgit Kleinschmit Photo: author This project is implemented through the CENTRAL EUROPE Programme co-financed by the ERDF
2 2 Introduction Monitoring of vegetation and habitats for nature conservation with remote sensing is possible, BUT: no general solution on deriving information on habitats due to Data availability Diversity of species and habitats Scales of detection (e.g. forest vs. grassland species) Monitoring should be (Vanden Borre 2011) multi-scale versatile user-friendly cost-efficient Vanden Borre, J., Haest, B., Lang, S., Spanhove, T., Förster, M., & Sifakis, N. (2011). Towards a wider uptake of remote sensing in Natura 2000 monitoring: Streamlining remote sensing products with users' needs and expectations. In, Second International Coference on Space Technology (pp. 1-4). Athens, Greece
3 3 Framework of the study Aim of the utilization of Remote Sensing Habitat Mapping Habitat Monitoring and assessment with indicators Data is RapidEye (short-term) and Landsat or orthophotos (long-term) methodological approach specified for the needs of focus regions no impacts of climate change can be evaluated (just three years), but methods how to assess climate change each region has individual indicators according to their needs / the basic land-type / the ground truth data

 high repetition rate Landsat Mision since begin of")
4 4 Data RapidEye 5 Satellites (Start August 2008) 6.5 m geometric resolution 5 spectral bands (e.g. red edge band) high repetition rate Landsat Mision since begin of the 80 s operational 30 m geometric resolution 7 spectral bands (e.g. SWIR) appox. 25 years of coverage
5 Regions and Data Vessertal Lake Neusiedl Rieserferner- Ahrn Indicator forest rejuvenation salt marsh detection, development of reed belt shrub encroachment Bucegi biotope mapping Balaton Uplands change in vegetation composition 6 Available data Landsat ( ) Landsat ( ) Orthophotos ( ) General Method RapidEye (4 x 2011) Classification (pixelbased) RapidEye (2 x 2009) Classification (pixelbased) RapidEye (4 x 2009 /10) Classification (pixelbased) RapidEye (3 x 2009) Object-based classification RapidEye (1 x 2009) Object-based classification Derviation of indicators for rejunevation (objetbased) Derivation of a pixelbased probability map for salt marshes Derivation of indicators (objectbased)

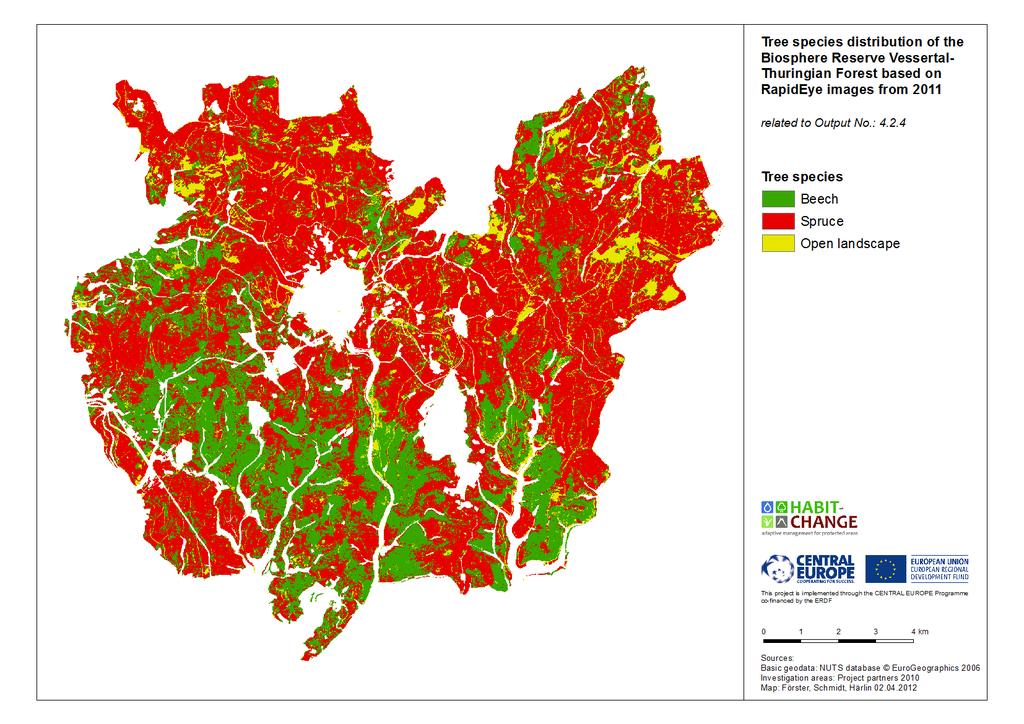
6 7 Case study - Biosphere Reserve Vessertal part of the Thuringian- Franconian highlands mountain ridge area with a system of deep valleys about 17,000 ha 88 % forest 9 % grassland can be characterised as an almost completely forested landscape
7 8 NATURA 2000 habitat types Habitat code Abundant NATURA 2000 habitat types Cover % of the study site Cover % of all habitats 9110 Luzulo-Fagetum beech forests Asperulo-Fagetum beech forests Tilio-Acerion forests of slopes, screes and ravines D0 Bog woodland with coniferous and broad-leaved forests on a humid to wet peaty substrate 91E0 Alluvial forests with Alnus glutinosa and Fraxinus excelsior (Alno-Padion, Alnion incanae, Salicion albae) 9410 Acidophilous Picea forests of the montane to alpine levels (Vaccinio-Piceetea)
8 9 Long-term monitoring Indicator: Forest rejuvenation (immigration of beech into spruce area) Data: 8 Landsat TM 4/5 images (1984, 1990, 1992, 1999, 2003, 2006, 2009, 2010) Method: - ISOData classification for each image - Calculation of tree species compostions - within forest segments (vector data) - Compairsion of segments per image (over - time)

9 10 Long-term monitoring

10 11 Long-term monitoring Tree species composition Vessertal 1986
11 12 Long-term monitoring Tree species composition Vessertal 2010

12 13 Long-term monitoring Area proportions of the tree species composition classes
13 14 Short-term habitat quality Indicator: Percentage of natural tree types Data: 4 RapidEye images from April, 08.May, 26.Aug & 23.Sept Method: - ISO Data classification of a layerstack - Random sample generation within classes - Support Vector Machine algorithm - Validation - Calculation of tree species compostions within - habitat boundaries (vector data)
14 15
15 16
16 17 Short-term habitat quality Conservation status Luzulo Fagetum (9110) Asperulo Fagetum (9130) Favourable % % Unfavourable - inadequate % % Unfavourable - bad % 4.58 % Differences between Luzulo Fagetum and Asperulo Fagetum beech forest Can be seen in the terrestrial mapping, too BUT: just one indicator out of a selection (e.g. understorey vegetation)
17 18 Conclusions GENERAL Remote sensing approaches require very individual approaches to derive indicators for monitoring changes The time-span covered by (non-military) satellites is sometimes still too short to record changes due to climate change (example forest) EXAMPLE Short-term indicator s can be used to monitor the percentage of natural tree types in Natura 2000 sites Long-term indicators can be utilised to monitor the immigration of beech in a spruce dominated region regions

18 19 Thank you for your Attention!