Broadening the Scope:
|
|
|
- Cameron Hodges
- 5 years ago
- Views:
Transcription

1 Broadening the Scope: Fertilization of Lodgepole Pine and Subalpine Fir Rob Brockley Research Branch BC Ministry of Forests & Range Fertilization Working Group February 11/09
2 Lodgepole pine
3 Susceptibility of fertilized lodgepole pine to MPB attack Fertilized lodgepole pine is more susceptible to attack, especially under high MPB pressure
4 Susceptibility of fertilized lodgepole pine to MPB attack Fertilized lodgepole pine is more susceptible to attack, especially under high MPB pressure Larger dbh
5 Susceptibility of fertilized lodgepole pine to MPB attack Fertilized lodgepole pine is more susceptible to attack, especially under high MPB pressure Larger dbh Microclimate changes
6 Susceptibility of fertilized lodgepole pine to MPB attack Fertilized lodgepole pine is more susceptible to attack, especially under high MPB pressure Larger dbh Microclimate changes Dilution of resin canal defences
7 Susceptibility of fertilized lodgepole pine to MPB attack Fertilized lodgepole pine is more susceptible to attack, especially under high MPB pressure Larger dbh Microclimate changes Dilution of resin canal defences Sensory cues due to nutrient imbalance

8 Lodgepole pine fertilization research ~ 70 screening trials

9 Lodgepole pine fertilization research ~ 70 screening trials 50 area-based trials
10 Lodgepole pine fertilizer research trials Distribution by biogeoclimatic zone (n=49) Number of installations SBS MS SBPS ICH ESSF IDF BEC zone
11 Lodgepole pine fertilizer research trials Distribution by stand age (n=49) Number of installations < >30 Stand age (years)
12 Lodgepole pine foliar N concentration Relative cumulative frequency distribution (n=58) Relative cumulative frequency Foliar nitrogen (%)
13 Lodgepole pine foliar N concentration Relative cumulative frequency distribution (n=58) Relative cumulative frequency Foliar nitrogen (%)
14 Lodgepole pine foliar N concentration Relative cumulative frequency distribution (n=58) Relative cumulative frequency Foliar nitrogen (%)
15 Lodgepole pine foliar N concentration Relative cumulative frequency distribution (n=58) Relative cumulative frequency Foliar nitrogen (%)
16 Lodgepole pine foliar N concentration Relative cumulative frequency distribution (n=58) Relative cumulative frequency Foliar nitrogen (%)
17 Relative 6-year BA response following N fertilization Relative cumulative frequency distribution (n=46) Relative cumulative frequency Relative BA response (control=100)
18 Relative 6-year BA response following N fertilization Relative cumulative frequency distribution (n=46) Relative cumulative frequency Relative BA response (control=100)
19 Relative 6-year BA response following N fertilization Relative cumulative frequency distribution (n=46) Relative cumulative frequency Relative BA response (control=100)
20 Relative 6-year BA response following N fertilization Relative cumulative frequency distribution (n=46) Relative cumulative frequency Relative BA response (control=100)
21 Relative 6-year BA response following N fertilization Relative cumulative frequency distribution (n=46) Relative cumulative frequency Relative BA response (control=100)
22 Foliar N/S ratio by treatment and year EP Inst. #17 Foliar N/S ratio critical value Control 200N Years after fertilization
23 Foliar N/S ratio by treatment and year EP Inst. #24 Foliar N/S ratio critical value Control 200N Years after fertilization

24 Control 200N 200N + 50S 200N + 100S
25 Effect of N and N+S fertilization on foliar N/S ratio EP (n=7) 25 Foliar N/S ratio Critical value 0 Control 200N 200N+50S 200N+100S Treatment
26 BA response following N and N+S fertilization Relative cumulative frequency distribution (n=26) Relative cumulative frequency N 0.4 N+S Relative 6-year BA response (control=100)
27 BA response following N and N+S fertilization Relative cumulative frequency distribution (n=26) Relative cumulative frequency N 0.4 N+S Relative 6-year BA response (control=100)
28 BA response following N and N+S fertilization Relative cumulative frequency distribution (n=26) Relative cumulative frequency N 0.4 N+S Relative 6-year BA response (control=100)
29 BA response following N and N+S fertilization Relative cumulative frequency distribution (n=26) Relative cumulative frequency N 0.4 N+S Relative 6-year BA response (control=100)
30 BA response following N and N+S fertilization Relative cumulative frequency distribution (n=26) Relative cumulative frequency N 0.4 N+S Relative 6-year BA response (control=100)
31 BA response following N and N+S fertilization Relative cumulative frequency distribution (n=26) Relative cumulative frequency N 0.4 N+S Relative 6-year BA response (control=100)
32 BA response following N and N+S fertilization Relative cumulative frequency distribution (n=26) Relative cumulative frequency N 0.4 N+S Relative 6-year BA response (control=100)
33 Effect of N and N+S fertilization on 6-year volume response of lodgepole pine in north-central B.C. EP (n=8) Volume increment (m 3 /ha) % Control N N+S Treatment
34 Effect of N and N+S fertilization on 6-year volume response of lodgepole pine in north-central B.C. EP (n=8) Volume increment (m 3 /ha) % 13% Control N N+S Treatment
35 Effect of N and N+S fertilization on 6-year volume response of lodgepole pine in south-central B.C. EP (n=7) Volume increment (m 3 /ha) % Control N N+S Treatment
36 Effect of N and N+S fertilization on 6-year volume response of lodgepole pine in south-central B.C. EP (n=7) Volume increment (m 3 /ha) % 27% Control N N+S Treatment
37 6-year relative BA response vs. initial foliar N year relative BA response (control=100) 150 R 2 = Pre-fertilization foliar N (%)
38 6-year relative BA response vs. initial foliar SO 4 6-year relative BA response (control=100) R 2 = Pre-fertilization foliar sulphate-s (ppm)
39 Lodgepole pine foliar SO 4 -S concentration Relative cumulative frequency distribution (n=58) Relative cumulative frequency Foliar sulphate-s (ppm)
40 Lodgepole pine foliar SO 4 -S concentration Relative cumulative frequency distribution (n=58) Relative cumulative frequency Foliar sulphate-s (ppm)
41 Lodgepole pine foliar SO 4 -S concentration Relative cumulative frequency distribution (n=58) Relative cumulative frequency Foliar sulphate-s (ppm)
42 Lodgepole pine foliar boron concentration Relative cumulative frequency distribution (n=58) Relative cumulative frequency Foliar boron (ppm)
43 Lodgepole pine foliar boron concentration Relative cumulative frequency distribution (n=58) Relative cumulative frequency Foliar boron (ppm)
44 Lodgepole pine foliar boron concentration Relative cumulative frequency distribution (n=58) Relative cumulative frequency Foliar boron (ppm)
45
46 Effects of N and B fertilization on foliar B concentration EP Foliar boron (ppm) critical value Control 200N 200N+3B Years after fertilization
47 Pl fertilization response in TIPSY (m 3 /ha) Planted: 1600 st/ha OAF1 & 2 = 1.00 Fert. Effectiveness = 80% SI 50 (m) fertilization
48 Pl fertilization response in TIPSY (m 3 /ha) Planted: 1600 st/ha OAF1 & 2 = 1.00 Fert. Effectiveness = 80% SI 50 (m) fertilization
49 Pl fertilization response in TIPSY (m 3 /ha) Planted: 1600 st/ha OAF1 & 2 = 1.00 Fert. Effectiveness = 80% SI 50 (m) fertilization
50 Pl fertilization response in TIPSY (m 3 /ha) Planted: 1600 st/ha OAF1 & 2 = 1.00 Fert. Effectiveness = 80% SI 50 (m) fertilization
51 Effects of post-thinning stand density on the growth of unfertilized and fertilized lodgepole pine EP Inst. #16 (Brockley 2005) 10-year volume increment (m 3 /ha) Unfertilized Fertilized 60% 59% 36% Post-thinning density (st/ha)
52 Summary
53 Summary N deficiencies are widespread and serious
54 Summary N deficiencies are widespread and serious growth response following N fertilization is variable
55 Summary N deficiencies are widespread and serious growth response following N fertilization is variable other deficiencies may be induced by N fertilization
56 Summary N deficiencies are widespread and serious growth response following N fertilization is variable other deficiencies may be induced by N fertilization combined application of N and S often improves growth response
57 Summary N deficiencies are widespread and serious growth response following N fertilization is variable other deficiencies may be induced by N fertilization combined application of N and S often improves growth response available foliar diagnostic criteria and predictive tools reduce uncertainty regarding fertilizer operations
58 Fertilization of repressed lodgepole pine
59 Fertilization of 36-year-old repressed lodgepole pine: 4-year volume increment (all trees) Blevins et al. (2005) Volume increment (m 3 /ha) % Unfertilized Fertilized 118% Unthinned Thinned
60 Fertilization of 36-year-old repressed lodgepole pine: 4-year height increment (all trees) Blevins et al. (2005) Height increment (cm) Unfertilized Fertilized 131% 79% Unthinned Thinned
61 Subalpine fir fertilization
62 Subalpine fir fertilization Subalpine fir (Abies lasiocarpa) represents a large portion of the THLB in many interior TSA s
63 Subalpine fir fertilization Subalpine fir (Abies lasiocarpa) represents a large portion of the THLB in many interior TSA s Fertilization of subalpine forests may be a potentially viable timber supply mitigation strategy
64 Subalpine fir fertilization Subalpine fir (Abies lasiocarpa) represents a large portion of the THLB in many interior TSA s Fertilization of subalpine forests may be a potentially viable timber supply mitigation strategy Several Abies species (grand fir, red fir, white fir, noble fir) respond well to fertilization
65 Subalpine fir fertilization Subalpine fir (Abies lasiocarpa) represents a large portion of the THLB in many interior TSA s Fertilization of subalpine forests may be a potentially viable timber supply mitigation strategy Several Abies species (grand fir, red fir, white fir, noble fir) respond well to fertilization Reliable fertilization response information for subalpine fir is virtually non-existent
66 Blunt fire retrospective fertilization assessment
67 Blunt fire retrospective fertilization assessment Study area ~ 65 km north of Smithers (ESSF)
68 Blunt fire retrospective fertilization assessment Study area ~ 65 km north of Smithers (ESSF) ~ 60- to 70-year-old naturally regenerated subalpine fir
69 Blunt fire retrospective fertilization assessment Study area ~ 65 km north of Smithers (ESSF) ~ 60- to 70-year-old naturally regenerated subalpine fir 950 ha operationally thinned (1997 and 1998) and fertilized (2000 to 2003)
70 Blunt fire retrospective fertilization assessment Study area ~ 65 km north of Smithers (ESSF) ~ 60- to 70-year-old naturally regenerated subalpine fir 950 ha operationally thinned (1997 and 1998) and fertilized (2000 to 2003) Cooperators: MoFR, West Fraser, Silvicon
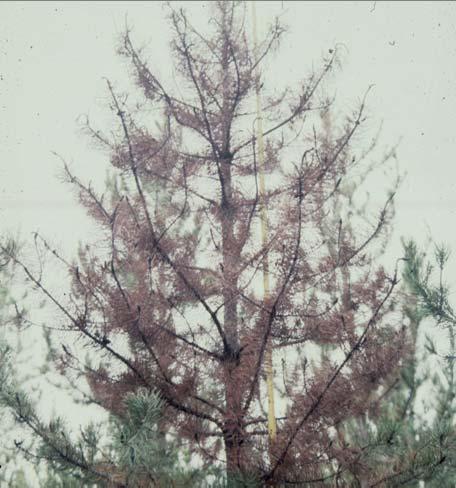
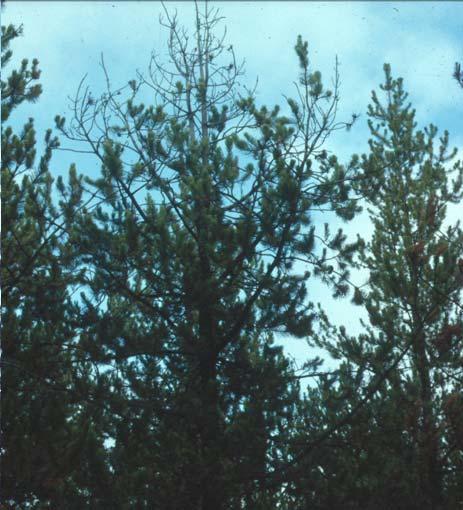
71 What caused the growth response? Thinned 1997 Fertilized 2000
72 How is fertilization response measured? R f = where: R f = growth response of a fertilized tree
73 How is fertilization response measured? R f = A f where: R f = growth response of a fertilized tree A f = post-fertilization growth of a fertilized tree
74 How is fertilization response measured? R f = A f E f where: R f = growth response of a fertilized tree A f = post-fertilization growth of a fertilized tree E f = growth that would have occurred had tree not been fertilized
75 How is fertilization response measured? R f = A f E f where: R f = growth response of a fertilized tree A f = post-fertilization growth of a fertilized tree E f = growth that would have occurred had tree not been fertilized E f can only be estimated (i.e., cannot be measured)
76 How is fertilization response measured? R f = A f A u where: R f = growth response of a fertilized tree A f = post-fertilization growth of a fertilized tree A u = post-fertilization growth of an unfertilized tree
77 R f = A f -A u Unfertilized Fertilized Year of fertilization Au Year of fertilization Af
78 How is fertilization response measured? R f = A f A u where: R f = growth response of a fertilized tree A f = post-fertilization growth of a fertilized tree A u = post-fertilization growth of an unfertilized tree A u may be a poor estimate of E f because of stand and site differences between the unfertilized and fertilized stands
79 How is fertilization response measured? R f = A f B f where: R f = growth response of a fertilized tree A f = post-fertilization growth of a fertilized tree B f = pre-fertilization growth of a fertilized tree
80 R f = A f -B f Fertilize Bf Af
81 How is fertilization response measured? R f = A f B f where: R f = growth response of a fertilized tree A f = post-fertilization growth of a fertilized tree B f = pre-fertilization growth of a fertilized tree B f may be a poor estimate of E f because of climatic differences between pre- and post-fertilization periods and other treatment effects (e.g., thinning)
82 B u = pre-fertilization growth of an unfertilized tree How is fertilization response measured? R f = A f (B f )av(a u /B u ) where: R f = growth response of a fertilized tree A f = post-fertilization growth of a fertilized tree B f = pre-fertilization growth of a fertilized tree A u = post-fertilization growth of an unfertilized tree
83 Field sampling methodology
84 Field sampling methodology Locate ~35 sampling points at paced intervals along transect lines in both a thinned and a thinned + fertilized stand
85 Thinned

86 Thinned + Fertilized Thinned
87 Field sampling methodology Locate ~35 sampling points at paced intervals along transect lines in both a thinned and a thinned + fertilized stand Select a nearby, healthy average tree (13 cm +/- 2 cm DBH) at each sampling point
88 Field sampling methodology Locate ~35 sampling points at paced intervals along transect lines in both a thinned and a thinned + fertilized stand Select a nearby, healthy average tree (13 cm +/- 2 cm DBH) at each sampling point Disc cut at DBH for each tree
89 Planned fertilization assessment protocol Select a thinned (1997) stand
90 Planned fertilization assessment protocol Select a thinned (1997) stand Select a comparable thinned (1997) and fertilized (2002) stand
91 Planned fertilization assessment protocol Select a thinned (1997) stand Select a comparable thinned (1997) and fertilized (2002) stand av(r f ) = av(a f ) av[(b f )av(a u /B u )] A u and A f = 5-year post-fertilization mean radial growth ( ) of trees in unfertilized and fertilized stands, respectively
92 Planned fertilization assessment protocol Select a thinned (1997) stand Select a comparable thinned (1997) and fertilized (2002) stand av(r f ) = av(a f ) av[(b f )av(a u /B u )] A u and A f = 5-year post-fertilization mean radial growth ( ) of trees in unfertilized and fertilized stands, respectively B u and B f = 5-year pre-fertilization mean radial growth ( ) of trees in unfertilized and fertilized stands, respectively
93 Actual fertilization assessment protocol Thinned (1998) stand
94 Actual fertilization assessment protocol Thinned (1998) stand Thinned (1997) and fertilized (2000) stand
95 Actual fertilization assessment protocol Thinned (1998) stand Thinned (1997) and fertilized (2000) stand av(r f ) = av(a f ) av[(b f )av(a u /B u )] A u and A f = 7-year post-fertilization mean radial growth ( ) of trees in unfertilized and fertilized stands, respectively
96 Actual fertilization assessment protocol Thinned (1998) stand Thinned (1997) and fertilized (2000) stand av(r f ) = av(a f ) av[(b f )av(a u /B u )] A u and A f = 7-year post-fertilization mean radial growth ( ) of trees in unfertilized and fertilized stands, respectively B u and B f = 7-year pre-fertilization mean radial growth ( ) of trees in unfertilized and fertilized stands, respectively
97 Disc measurement Measure the largest diameter (D1) on each disc
98 D1
99 Disc measurement Measure the largest diameter (D1) on each disc Measure the diameter (D2) of the perpendicular bisector of D1
100 D1 D2
101 Disc measurement Measure the largest diameter (D1) on each disc Measure the diameter (D2) of the perpendicular bisector of D1 Calculate the average radius and locate and mark two average radii on each disc
102 R2 R1 D2 D1
103 Disc measurement Measure the largest diameter (D1) on each disc Measure the diameter (D2) of the perpendicular bisector of D1 Calculate the average radius and locate and mark two average radii on each disc On each of the two radii, measure: Distance from pith to the outer edge of 1993 growth ring (year of thinning), X
104 Disc measurement Measure the largest diameter (D1) on each disc Measure the diameter (D2) of the perpendicular bisector of D1 Calculate the average radius and locate and mark two average radii on each disc On each of the two radii, measure: Distance from pith to the outer edge of 1993 growth ring (year of thinning), X Distance from pith to the outer edge of the 2000 growth ring (year of fertilization), Y
105 Disc measurement Measure the largest diameter (D1) on each disc Measure the diameter (D2) of the perpendicular bisector of D1 Calculate the average radius and locate and mark two average radii on each disc On each of the two radii, measure: Distance from pith to the outer edge of 1993 growth ring (year of thinning), X Distance from pith to the outer edge of the 2000 growth ring (year of fertilization), Y Distance from the pith to the outer edge of the 2007 growth ring, Z
106 Z1 Y1 Z1 X1 Y1 X2 R2 R1 D2 D1
107 A u, A f Z1 A u, A f Y1 Z1 X1 Y1 X2 R2 R1 D2 D1

108 Z1 Y1 X2 R2 D1 R1 Y1 X1 D2 Z1 Au, A f Bu, B f A u, A f B u, B f
109 Pre- and post-fertilization radial growth (cm) in unfertilized and fertilized stands B u B f A u A f Mean CV n number of samples needed to achieve a precision of ± 0.10 cm at 90% confidence
110 Pre- and post-fertilization radial growth (cm) in unfertilized and fertilized stands B u B f A u A f Mean CV n number of samples needed to achieve a precision of ± 0.10 cm at 90% confidence
111 Pre- and post-fertilization radial growth (cm) in unfertilized and fertilized stands B u B f A u A f Mean CV n number of samples needed to achieve a precision of ± 0.10 cm at 90% confidence
112 Pre- and post-fertilization radial growth (cm) in unfertilized and fertilized stands B u B f A u A f Mean CV n number of samples needed to achieve a precision of ± 0.10 cm at 90% confidence
113 Blunt Fire fertilization response av(r f ) = av(a f ) av[(b f )av(a u /B u )]
114 Blunt Fire fertilization response av(r f ) = av(a f ) av[(b f )av(a u /B u )] av(r f ) = 1.24 cm 0.82 cm
115 Blunt Fire fertilization response av(r f ) = av(a f ) av[(b f )av(a u /B u )] av(r f ) = 1.24 cm 0.82 cm av(r f ) = 0.42 cm
116 Blunt Fire fertilization response av(r f ) = av(a f ) av[(b f )av(a u /B u )] av(r f ) = 1.24 cm 0.82 cm av(r f ) = 0.42 cm av(r f ) = 51%
117 Blunt Fire fertilization response I = av(a f /B f ) av(a u /B u )
118 Blunt Fire fertilization response I = av(a f /B f ) av(a u /B u ) I =
119 Blunt Fire fertilization response I = av(a f /B f ) av(a u /B u ) I = I = 1.00
120 Blunt Fire fertilization response I = av(a f /B f ) av(a u /B u ) I = I = 1.00 I = 57%
")
121 Thinned (1998)

122 Thinned (1997) + Fertilized (2000)
123 Summary
124 Summary Thinned subalpine fir at Blunt Fire apparently responded very well to fertilization
125 Summary Thinned subalpine fir at Blunt Fire apparently responded very well to fertilization Response potential under different site and stand conditions is still unknown
126 Summary Thinned subalpine fir at Blunt Fire apparently responded very well to fertilization Response potential under different site and stand conditions is still unknown Reliable G&Y data from a small network of well designed, area-based research field installations is needed
127 Summary Thinned subalpine fir at Blunt Fire apparently responded very well to fertilization Response potential under different site and stand conditions is still unknown Reliable G&Y data from a small network of well designed, areabased research field installations is needed In the interim, some operational fertilization of subalpine fir may be justifiable, especially in stands with a moderate component of spruce