Vegetation Resources Inventory British Columbia
|
|
|
- Lauren Joseph
- 5 years ago
- Views:
Transcription
1 Vegetation Resources Inventory British Columbia Ground Sampling Procedures Prepared by Ministry of Forests, Lands and Natural Resource Operations Forest Analysis and Inventory Branch March 2018 Version 5.5
2 The Province of British Columbia Published by the Resources Information Standards Committee Digital Copies are available on the Internet at:
3 Acknowledgments The Government of British Columbia provides funding of the Resources Information Standards Committee work, including the preparation of this document. The Resources Information Standards Committee supports the effective, timely and integrated use of land and resource information for planning and decision making by developing and delivering focused, cost-effective, common provincial standards and procedures for information collection, management and analysis. Representatives to the Committee and its Task Forces are drawn from the ministries and agencies of the Canadian and the British Columbia governments, including academic, industry and First Nations involvement. The Resources Information Standards Committee evolved from the Resources Inventory Committee which received funding from the Canada-British Columbia Partnership Agreement of Forest Resource Development (FRDA II), the Corporate Resource Inventory Initiative (CRII) and by Forest Renewal BC (FRBC), and addressed concerns of the 1991 Forest Resources Commission. For further information about the Resources Information Standards Committee, please access the RISC website at: For questions concerning the content of this publication please contact: Manager, Vegetation Resources Inventory Forest Analysis and Inventory Branch PO Box 9512, Stn Prov Govt Victoria, BC V8W 9C2 Phone: (250) Fax: (250) March 2018 iii
4
5 Major Amendments for Explanatory text added regarding how to determine when a border plot is needed for a variable-radius plot. (sec. 4.1). 2. Clarity added regarding measuring and recording tree length on trees with unusual form. (sec. 4.2) 3. Explanatory text added regarding how to deal with DRS when found on the main stem. (sec. 4.5 and 5.3) 4. Clarity added regarding the assessment of suppression in tree cores for site index suitability. (sec. 4.8) 5. Requirement added to record broken top loss indicators (BTP) on all aux-plot trees (if present) along with either the corresponding broken top diameter or projected height. (sec. 4.9) 6. Clarity added regarding best practice for grading a log with ¼ butt rott. (sec. 6.2) March 2018 v
6
7 Table of Contents Acknowledgments... iii Major Amendments for v 1. Introduction... 1 Background... 1 Vegetation Resources Inventory Process... 1 Principles of the Ground Sampling Process... 1 How to Use This Document Field Orientation and Navigation Plot Establishment Introduction Objectives Definitions General Procedures Field Cards for this Section Detailed Procedures Establishing the Plots at the Integrated Plot Centre Establishing the Auxiliary Plots Replacement of Dropped Auxiliary Plots Taking Ground Photographs Completing the Header Card (CH) Completing the Compass Card (CP) Completing the Cluster Layout (CL) Card) Inventory Cruising Introduction Objectives General Procedures Field Cards for this Section Detailed Procedures Establishing Plot Layout, BAF, and Partial Plots Identifying and Recording Tree Attributes Assessing Tree Attributes for Wildlife Assessing Damage Agents and Severity March 2018 vii
8 4.5 Assessing Tree Loss Indicators Stem Mapping Measuring Small Trees and Stumps Recording Sample Tree Data Recording Auxiliary Plot Measurements Sampling and Enhancement of VRI Ground Samples for NVAF Literature Cited Net Factoring Introduction Objectives Definitions General Procedures Field Cards for this Section Detailed Procedures Net Factoring Procedures Calculating Volume Applying Deduction Rules Call Grading Introduction Objectives Definitions General Procedures Field Cards for this Section Detailed Procedures Call Grading Procedures Grading Conventions and Guidelines Inventory Call Grading Criteria Summary of Log Grades by Species Plants, Soils, and Old Growth Introduction Objectives General Procedures Field Cards for this Section Detailed Procedures Establishing Plots viii March 2018
9 7.2 Assessing Ecological Variability Identifying and Recording Site and Soil Features Describing Vegetation Interpreting Succession Literature Cited Coarse Woody Debris Introduction Objectives Definitions General Procedures Field Cards for this Section Detailed Procedures Establishing the Sampling Transects Assessing the Transect Conditions Sampling CWD Along the Transects Range Resources Introduction Objectives Definitions General Procedures Field Cards for this Section Detailed Procedures Establishing Forage Sampling Micro-Plots Estimating Forage Utilization Clipping the Plot Recording Shrub Species, Phenology, and Abundance Literature Cited Index March 2018 ix
10
11 List of Figures Figure Major Activities in the Ground Sampling Process... 4 Figure Components of Field Orientation and Navigation... 6 Figure Example of Tag for the Reference Tree Figure The Five-Point Cluster Layout for the Vegetation Resources Inventory Figure Layout of Sampling Plots and Transects and Summary of Data Collected Figure Variable Radius Plot Layout Figure m Fixed-Radius Plot Layout Figure Small Tree and Stump 2.50m Fixed-Radius Plot Layout Figure Top-Height Tree 5.64m Fixed-Radius Plot Figure Ecological Data Collection Plot Layout Figure Coarse Woody Debris Line Transect Layout Figure Shrub Transects and forage Production Micro-Plots Layout Figure Auxiliary Sampling Plot Layout Figure Examples of Auxiliary Plot Replacement Figure Polygon Border - Half Plot Layout Figure 4.2- Polygon Border - Quarter Plot Layout Figure DBH in Relation to High Side Ground and Point of Germination (diagrams courtesy of Canadian Forest Service) Figure 4.4- Measurement of Remaining Bark Figure 4.5- Measurement of Odd-Shaped Trees Figure 4.6- Visual Appearance Codes Figure 4.7- Measurement of "In" and "Out" Stumps Figure 4.8- Measuring Height of Broken Stumps Figure Calculation Area for Leading Species Determination on Back of TD Field Card Figure Recording of Height and Age Information on the TS and TA Field Card Figure Recording Age for Full Boring Figure Recording Age for Tree with Missing Core (Rot) Figure Recording of Age for Partial Boring (CRC) Figure Recording Age for Out-of-Plot Tree Figure Recording Age Using Whorl Count Figure Recording Physiological Age Figure 5.1- Example of net factor calculation for Frost Cracks March 2018 xi
12 Figure Example of Net Factor Calculation for Scar with known Depth Figure Example of Net Factor Calculation for Scar with Unknown Depth Figure Example of Net Factor Calculation for Cat Face (Cylindrical Defect) Figure Example of Net Factor Calculation for Cat Face (Conical Depth) Figure Example of Net Factor Calculation for Cat Face (Using Butt Rot Table) Figure 5.7 Example of Net Factor Calculation for Dead Tops Figure Example of Net Factor Calculation for Broken Tops Figure Example of isolated sections between defects Figure Example of Grade Calculation for Sun Checked Logs Figure Examples of Grade Calculation for Twist Figure Assessing Uniformity and Attributes in Areas with Ecological Variability Within the 10m Fixed-Radius Plot Figure Side View Showing Meso Slope Descriptive Terms Figure Example of Recording Horizon Depth in Organic Soils and Mineral Soils Figure VRI Unknown Plant Label Figure Comparison Charts for Visual Estimation of Foliage Cover Figure An Example of Percent Coverages in a Plot, Viewed From Above Figure Taller Vegetation Layers Figure 7.8 Stratification of forest stands, shrubs, and trees Figure CWD Transect Encounters an Anomaly Within the Polygon Figure 8.2 The Bounce-Back Method When the Transect Intersects the Polygon Boundary Figure Measuring Suspended CWD Figure Side View of Partially Buried Coarse Woody Debris Figure Centreline of a CWD Piece (Top View) Figure Measuring CWD Near the Centreline of the Piece (viewed from above) Figure Measuring Diameter of Circular CWD Cross Sections Figure The Sample Line Intersects the CWD More Than Once Figure Measuring the Tilt Angle of CWD Pieces Figure Measuring the Horizontal Length and Vertical Depth of Odd-Shaped CWD. 194 Figure Measuring an Accumulation of Coarse Woody Debris Figure Range Resources Sampling Transects and Micro-Plots Figure Label for the Production Plot Bags Figure The Line-Intersect Method for Shrubs Figure Determining the Horizontal Intercept of a Shrub on a Slope xii March 2018
13 List of Tables Table Summary of data collected at IPC and sampling method employed Table 3.2 Field cards for Ground Sample Types Table Approved BAFs to be used Table 4.2 Tree status codes Table 4.3 Crown class codes Table 4.4 Crown condition codes Table Bark retention codes Table 4.6- Wood condition codes Table 4.7 Loss indicator codes Table 4.8 Guide for selection of sample trees Table 5.1 Formula for calculating volume Table 5.2 Summary of procedures for determining net factor for loss indicators Table 5.3 Deduction rule for Heart Rot Conk Table 5.4 Deduction rule for Root Rot Table Example of Net Factor Calculation for Root Rot Table 5.6 Deduction rule for Blind Conk Table 5.7 Deduction rule for Frost Crack Table Deduction rule for Scar Table 5.9 Deduction rule for Cat Face Table 5.10 Butt Rot guide for length deductions Table 5.11 Deduction rule for Fork Table 5.12 Deduction rule for Crook Table 5.13 Deduction rule for Rotten Branch Table 5.14 Deduction rule for Dead Tops Table 5.15 Deduction rule for Broken Tops Table 5.16 Deduction rule for Rot Associated with Broken Tops Table 5.17 Deduction rule for Direct Observation Table 5.18 Deduction rule for Other Table 6.1 Minimum log lengths (in m) by grade and species (highest grade at left) Table 6.2 Butt rot guide for length deductions Table 6.3 Maximum twist displacement by grade Table 6.4 Fir/Pine/Larch Grades and Grade Requirements March 2018 xiii
14 Table 6.5 Cedar Grades and Grade Requirements Table 6.6 Hemlock/Balsam Grades and Grade Requirements Table 6.7 Spruce Grades and Grade Requirements Table 6.8 Cypress/Yew Grades and Grade Requirements Table 6.9 Deciduous Grades and Grade Requirements Table 6.10 Fir/Pine/Larch log grade summary Table 6.11 Cedar log grade summary Table 6.12 Hemlock/Balsam log grade summary Table 6.13 Spruce log grade summary Table 6.14 Cypress/Yew log grade summary Table 6.15 Coniferous Common Grades log grade summary Table 6.16 Deciduous Species log grade summary Table 7.1 Plot uniformity codes Table 7.2 Relative Soil Moisture Regime codes Table 7.3 Soil Nutrient Regime codes Table 7.4 B.C. Land Cover Classification codes in condensed form Table 7.5 Meso slope codes Table 7.6 Microtopography codes Table 7.7 Rocky substrate codes Table 7.8 Indicators of slope instability Table 7.9 Indicators of flood hazard Table 7.10 Surficial material codes Table 7.11 Soil features codes Table 7.12 Humus form codes Table 7.13 Soil colour codes Table 7.14 Examples of important soil horizons Table 7.15 Suggested coding conventions for collected unknown species Table 7.16 Vegetation layer codes Table 7.17 Conversion factors from percent coverage to horizontal area Table 7.18 Site disturbance codes Table 7.19 Indications of site disturbances Table 7.20 Snags/CWD codes Table 7.21 Canopy gap codes Table 7.22 Vertical structure codes Table 7.23 Successional stability codes xiv March 2018
15 Table 7.24 Stand age codes Table 7.25 Structural stage codes Table 8.1 Coarse woody debris decay classes Table Herbaceous forage utilization classes and codes Table Vegetative phenological classes March 2018 xv
16
17 1. Introduction Background The Forest Resources Commission recommended a review of the provincial resource inventory process in its report The Future of our Forests. The Resources Inventory Committee (RIC) was established with the objective of achieving common standards and procedures and it, in turn, established several task forces. One of these task forces, the Terrestrial Ecosystems Task Force, set up the Vegetation Inventory Working Group and charged its members with:... making recommendations pertaining to the vegetation inventory... (and)... designing and recommending standards and procedures for an accurate, flexible... inventory process. The Vegetation Inventory Working Group recommended a photo-based, two-phased vegetation inventory program: Phase I: Photo Interpretation Phase II: Ground Sampling The Ministry of Forests, Lands and Natural Resource Operations, assisted by the Ministry of Environment is implementing the recommendations in the Vegetation Resources Inventory. Vegetation Resources Inventory Process The Vegetation Resources Inventory is designed to answer two questions: 1. Where is the resource located? 2. How much of a given vegetation resource (for example, timber or coarse woody debris) is within an inventory unit? The Vegetation Resources Inventory is carried out in two phases. Phase I (Photo Interpretation) involves estimating vegetation polygon characteristics, from existing information, aerial photography, or other sources. No sampling is done in Phase I. Phase II (Ground Sampling) provides the information necessary to determine how much of a given characteristic is within the inventory area. Ground samples alone cannot be collected in sufficient numbers to provide the specific locations of the land cover characteristics being inventoried. The ground measurements are used to estimate the proper total for the population. Principles of the Ground Sampling Process 1. The Vegetation Resources Inventory is designed to be able to cover the entire land base of British Columbia irrespective of ownership or vegetation values. 2. Samples will be selected from the target population within an inventory unit using the probability proportional to size with replacement sampling design [PPSWR]. It is recommended that pre-stratification be used in the selection process. A detailed description of the selection methodology is available on the Ministry website entitled Sample Selection Procedures for Ground Sampling. March
18 3. Moving plots to more typical locations is never acceptable. Sample plots must be placed where they fall. Special procedures will be used when this constitutes a temporary or permanent safety hazard. 4. All data attaches to the Integrated Plot Centre. 5. The ground sampling must be done correctly and carefully. Errors in the ground samples are translated directly into errors in the inventory. Accuracy is the watchword. 6. Quality of answer includes the concepts of no bias and small sampling error. It is achieved by ensuring the following: No bias The sampling processes are statistically valid. The calculation and adjustment procedures are valid and documented. Inventory sampling is done separately by inventory unit, so that updates and reinventories can be done at arbitrary intervals, then combined in an unbiased manner for a provincial estimate. Rounding and vague definitions are avoided. Small sampling error Initial estimates are used to reduce sampling error and cost. The selection method may be combined with traditional stratification to ensure a sample that stabilizes more quickly than a random sample and that ensures controlled sample sizes in all land types. 7. Measurements are made to a known level of precision. Estimates made at the sample plot are acceptable where measurements cannot be taken. 8. Procedures (such as splitting plots) exist to reduce onerous workload, which might lead to error. 9. All measurements are to be completed and recorded in the field. 10. Net Volume Adjustment Factor (NVAF) sampling is a required component of any ground sampling project that collects timber information. NVAF data is used to adjust cruiser estimated net volumes. 2 March 2018
19 How to Use This Document This document deals with the ground sampling component of the Vegetation Resources Inventory. It describes procedures for the location and establishment of sample plots, and the collection of data related to: trees site, soils, plants and succession coarse woody debris range resources The major activities associated with the ground sampling process are illustrated in Figure 1.1. Sample tally sheets for recording field information are also included in this document. A brief background is provided in Section 1 to explain the rationale behind the procedures. The remainder of the document describes the procedures or methods required for ground sampling. Section 2 and 3 describe the procedures required to locate and establish sample plots. Section 4 explains the measurement and recording of tree information at the Integrated Plot Centre and at the Auxiliary Plots. Sections 5 and 6 describe the call grading and net factoring criteria, guidelines, and rules. Section 7 describes the procedures required to gather site, soils, plants and succession information. Section 8 contains the procedures for measuring coarse woody debris, and Section 9 describes the procedures for measuring range resources. Each of these sections contains a brief introduction, objectives, general procedures, and detailed procedures. Definitions, examples, and tips are also provided. A glossary of terms and a detailed index are included in this document to ensure the usability of the document as a reference tool. March
20 Sorted List Selects Grid Location to Visit Select one or more points inside the polygon Navigate to Cluster Centres Compass Card CP Cluster Header Card CH Establish Plot Cluster Cluster Layout Card CL Tree and Shrub Layers Card Herb and Moss Layers Card Succession Interpretations Card ET EH EO PLANT LIST 1. Tree/Shrub Layer (10 m radius) 2. Herb and Moss Layer (5.64 m radius) OLD GROWTH Integrated Plot Center TREES 1. Trees (Fixed/Variable) Size Grade Defects 2. Small Trees and Stumps Top Height Trees (5.64 m Radius) 3. Pathology Tree Details Card Small Tree, Stump and Site Tree Card Tree Loss Indicators Card TD TS TL Coarse Woody Debris Transect 1 Card EW Coarse Woody Debris Transect 2 Card Range Transect 1 Card EC RS RANGE / CWD 1. Coarse Woody Debris (2) 24 m Transects 2. Range Information (2) 24 m Transects with (4) m radius plots AUXILIARY PLOTS 1. Trees Counts 2. New Species Measurements 3. Top Height Auxiliary Plot Card TA Range Transect 2 Card RS ECOLOGICAL 1. Soil Horizons 2. Ecological Descriptions Ecological Description 1 Card Ecological Description 2 Card EP ED Figure Major Activities in the Ground Sampling Process 4 March 2018
21 2. Field Orientation and Navigation Introduction This section outlines the steps needed to traverse from a geographically located feature (the access point) to the Integrated Plot Centre. The field crew is responsible for selecting suitable access points, navigating to the tie point/reference point and integrated sample plot centre, and recording the information on the field cards. The route must be suitably marked to locate the plot centre and to aid revisitation in the near future. The current preferred method of establishing the Integrated Plot Centre (IPC) is to establish the reference point at m from the IPC using a hand-held GPS unit (effectively making the reference point the tie point), and then measuring out the m with a tape to establish the IPC. As this method will not always be practicable, the traditional method of tightchaining from a tie point location is contained in Appendix H. Throughout this chapter, which has been updated to reflect the new GPS-based sample establishment, reference point and tie point are synonymous and can be used interchangeably. Care must be taken when using GPS as the source of navigation, especially in areas where the inventory is quite old. The Forest Cover Polygons on some maps in the province are not spatially correct in relation to TRIM. This could mean that by going to a coordinate you will NOT be in the correct polygon. Discussions with a Provincial Inventory Forester must be made to confirm the quality of linework in a project area prior to using GPS for navigation. Objectives 1. To locate the Integrated Plot Centre within the polygon of interest (in the position indicated on the orthophoto). 2. To mark and document the cluster location and navigation points to allow for short and long-term sample relocation. General Procedures Office Preparation 1. Prepare and become familiar with polygon characteristics, Integrated Plot Centre, and access prior to field visitation. Identify the location of the Integrated Plot Centre on the orthophoto. Identify the location of the Integrated Plot Centre on the map. Determine the relative accuracy of the map:orthophoto relationship. 2. Determine if GPS-based establishment of the reference point will be possible. It may not be possible in steep terrain or dense timber that leads to GPS signal interference. 3. Locate a potential tie point and alternatives on the map and orthophoto, in case GPSbased establishment is not possible. March
22 Field Location 1. Locate and confirm an access point in the field and mark it. 2. Roughly navigate to the reference point using any desired means, including GPS. 3. Ensure you are in the correct ground position as indicated on the orthophoto. 4. Use a hand-held GPS unit to provide a final location for the reference point. 5. Drive the Reference Pin in the ground. 6. Paint and tag the Reference Tree and measure the bearing and distance to the Reference Pin. 7. Measure m to the Integrated Plot Centre. 8. Drive a pin in the ground. This is the Integrated Plot Centre. A simple illustration of the components of field orientation and navigation is contained in Figure 2.1. Tie Point / Reference Tree Access Line Tie Point Pin Integrated Plot Centre Access Point (Road) m * G.P.S. Record * G.P.S. Record Figure Components of Field Orientation and Navigation Field Cards for this Section Header Card (CH) (Appendix A, Figures A.1 and A.2) polygon ID, project ID, sample plot, date, crew, general notes and access details. Compass Card (CP) (Appendix A, Figures A.3 and A.4) Access Point, Reference Pin Location, Reference Tree, GPS, location, field survey notes. Cluster Layout (CL) (Appendix A, Figures A.5 and A.6) Integrated plot details, sample cluster details. 6 March 2018
23 Detailed Procedures Standard procedures of location, marking, and recording must be followed so that sample plots are easy to relocate for quality control and other purposes. The following procedures are designed to be used with a hand-held GPS unit as the primary means of navigation and plot location. Traditional survey methods of plot location (such as compass, clinometer, and distance-measuring equipment) are contained in Appendix H for reference in cases where GPS navigation is not used. Now that the selective availability of GPS has been turned off, the use of GPS to locate sample plot locations is another tool that can be used. It is mandatory that the use of GPS only be used up to the location of the reference point. It is important to remember there is still error in GPS readings, especially in dense timber and on steep slopes. The crew will still need to confirm that the sample is in the correct location. In addition, it is mandatory to check with a Provincial Inventory Forester regarding the relative accuracy of the Forest Cover Polygons in relation to TRIM in a project area prior to using GPS for navigation. GPS data will be recorded at the access point, reference point (as the tie point), and the Integrated Plot Centre. Detailed standards and procedures for GPS data collection can be found in the document: GPS Data Collection Procedures for Georeferencing Vegetation Resources Inventory and National Forest Inventory Field Sample Plots (January 2004). This document is available on the MFLNRO Vegetation Resources Inventory website. 2.1 Locating and Marking the Access Point An access point is selected and marked to ensure it can be found again with reasonable effort using the field crew s documentation. This is typically at a roadside location or helicopter landing spot. The access point is the first physical point of contact that a revisiting field crew has with a sample, and therefore, an access point should be established for every sample. Office Preparation 1. Determine if the access point will be stand-alone or double with the reference tree: In most instances the reference point will not be directly accessible, unless the IPC is very near the location where the truck is parked or the helicopter puts down: If the reference point will not be in very close proximity to the roadside/helispot or will not be visible from this location, a stand-alone access point is required. In rare instances where the reference point is close enough to the roadside/helispot and will be easily visible from this location, a single tree (or other suitable feature) can be selected and marked to serve as both the access point and the reference tree. 2. Locate the access point: The field crew is responsible for the selection of a suitable access point. An access point should have the following characteristics: must be locatable on the ground preferably should be locatable on the orthophoto preferably should be locatable on the appropriate Phase I polygon map should permit efficient access to the sample should be very near to where the field crew leaves the truck or helicopter March
24 If reasonable to do so, an access point should be a tree located at some distinct roadside ground feature that can be easily referenced in the access notes. Where this would unnecessarily increase the distance to the reference point, a tree at the closest roadside location to the IPC that allows efficient access to the sample will suffice. Some possible features are: road junction bridge on a stream crossing timber boundary features singular tree or small clump of trees swamp, pond, or lake edges significant bend in the road helicopter put down location Field Location 1. Establish the access point in the field: Confirm the access point location or select an alternative. Select an Access Point Tree or stump of suitable size (20+ cm) so that the stem will be present for a number of years (not immediately beside a road where it may be removed during road maintenance). Where no suitable trees or stumps are available, use another feature, such as a rock cut, boulder, and so on. A small rock cairn can aid relocation. 2. Mark the access point tree for relocation of the sample in the short term (up to 5 years): Make the access point visible to a field crew conducting surveys, but not overly visible to the general public. For example: if available the tree should be greater than 20 cm in diameter choose conifers over deciduous, cedars over other conifers limb the complete stem to shoulder height remove understory vegetation around the tree, if practical paint the tree on 4 sides ribbon the tree bole record the project name and sample number on the flagging 8 March 2018
25 Ribbons Painted on four sides above dbh Figure Marking the Access Point Tree Note: Tree marking and ribboning must be coordinated with the appropriate land manager or owner. 3. Describe the access point in the access notes: The back of the Header field card provides space for the crew to record access notes to aid in relocation of the sample. The notes should include a narration of the route traveled from a known location (e.g., the junction of a highway and a secondary road) to the access point, in enough detail to aid relocation by a different crew. Provide a thorough physical description of the access point at the end of the access notes. Note the approximate bearing(s) and distance(s) (or whatever other navigation notes are appropriate) from the access point to the reference point following the description of the access point. Note: An increasing number of samples are being visited by various field crews, which may or may not have GPS capability or GPS data was not available at the site. Extra effort should be made in providing detailed access notes for future visitation. March
26 QO1 KM 0 J c t o f H i g h w a y a n d h i g h w a y 1 0 a. G o n o r t h o n h i g h w a y B r i d g e o v e r S m i t h R i v e r 3. 8 D a v i s r o a d o n r i g h t, s t a y o n h w y F r a n k l i n C r e e k b r i d g e J a m e s rd o n r i g h t, s t a y o n h w y B l u e Lk h w y r e s t s t o p o n r i g h t M a c k l i n F S R o n l e f t, t u r n o n t o M a c k l i n F S R a n d r e s e t o d o m e t e r Reference Pin Log bridge, cross creek due east of sample 1. 4 C r o s s b r i d g e 1. 9 R i g h t 2. 1 R i g h t 3. 4 L e f t 3. 6 K e e p r i g h t 4. 0 L e f t 4. 2 S t a y l e f t 4. 5 R i g h t 4. 6 R i g h t 4. 8 P a r k, A c c e s s P o i n t o n l e f t ( ~ 80 c m D B H Sx v e t ). W a l k ~ 650m a t 350 t o r e f e r e n c e p i n Creek Macklin FSR Access Point Figure Example of Completed Access Notes. 4. Collect and record GPS data at the access point location: Record a brief description of the location in the Descrip. field on the CP card. Collect a GPS file and record the file number in the field for GPS Access Point on the CP field card. Access point coordinates may be collected using any reliable GPS unit, and do not need to be post-processed. When GPS data cannot be collected at the access point, move to an area where data can be collected (such as an opening). Measure the distance and bearing from the point where data was collected back to the access point. Record these measurements in the Comments section on the Compass Card. If GPS data cannot be collected for the access point at any site, enter NoData for the GPS file ID. 2.2 Navigating to the Reference Point From the Access Point navigate to the Reference Point location. Procedures 1. Locate the Reference Point using a rough bearing and distance and/or a hand-held GPS unit. 2. Walk around unsafe or difficult situations. 3. Flag the access line well enough to be easily followed. Flagging is to aid in short-term relocation of the Integrated Plot Centre (within one field season). 10 March 2018
27 4. Evaluate the location. When you find that the orthophoto and ground location agree, proceed with establishing the Reference Point and Reference Tree. When you arrive at the Reference Point and find that the orthophoto and ground location do not agree, evaluate the problems and find the correct sample location. The objective is to find the correct ground location of the sample point (as indicated on an orthophoto), not the map position. You will not be moving the plot location if there is a conflict, you will be finding it. The map, GPS, and other tools are aids in finding the correct location. 2.3 Establishing the Reference Point and Reference Tree The purpose of establishing a Reference Point is to eliminate potential small-scale bias for the Integrated Plot Centre location. The Reference Point will also help in relocating the Integrated Plot Centre. Procedures 1. Determine the intended Reference Point coordinates by subtracting 15 m off of the IPC intended northing coordinate; this point will be 15 m south of the IPC. If it appears that another cardinal direction out from the IPC would provide a more practical or safer location, adjust from the IPC intended coordinates as required, for example: Adding to the northing or easting puts the reference point north or east of the IPC, respectfully. Subtracting from the northing or easting puts the reference point south or west of the IPC, respectively. 2. Navigate via any preferred method (including GPS) from the Access Point to the predetermined reference point coordinates as calculated above. 3. Stop at the approximate coordinates for the reference point and use a hand-held GPS unit to record an averaged waypoint (collect between 100 and 150 averaged points). 4. Compare the averaged waypoint coordinates to the intended reference point coordinates, and adjust the required X (easting) and Y (northing) distances with a tape to get to the intended tie point/reference point coordinates. The following table provides an example of this exercise. Easting Northing Intended IPC coordinates: Intended RP coordinates (-15 m from Northing): Averaged waypoint coordinates (from GPS unit): Required adjustment to get from waypoint to RP: Go 4 m West and 2 m North 5. Establish the Reference Pin at this point by driving the pin firmly into the ground. 6. Choose a suitable Reference Tree (greater than 20 cm in diameter, if possible). The Reference Tree should be reasonably close, in relatively good health, with a high probability of survival, and with particular distinguishing features when possible (such as a forked tree, aspen in spruce stand, veteran in immature stand). The Reference Tree should not be a tree in the sample plots. March
. 8.")
28 7. Record the species, diameter, azimuth and distance from the Reference Tree to the Reference Pin on the Compass Card (discussed in Section 3.5). This data is replicated for the Tie Point Reference Details on the same card (establishing the reference point by GPS essentially results in the reference point being the tie point). 8. Mark the tree with flagging tape and paint on four sides above DBH. Securely nail an aluminum identification tag (Figure 2.4) with aluminum nails at the base of the tree below potential felling height (0.3 m) and facing the Reference Pin. If site conditions make this impossible, the tag location is at the discretion of the crew. Record the tag number on the Header Card (CH) and Compass Card (CP). 9. Record 15 m at the appropriate azimuth (e.g., 0 degrees if the reference point is south of the IPC) for the straight line bearing and distance to IPC on the Compass Card (CP). 10. When the reference point (i.e., tie point) is established using the GPS methods described above, the field crew is not required to collect a GPS file at this point. Instead, derive the reference point coordinates by removing 15 m from the corrected IPC UTM northing (or other required adjustment if the reference point is not south of the IPC). These derived coordinates are then entered for the tie point on the Compass Card (CP). The GPS file ID should be entered as Derived. Figure Example of Tag for the Reference Tree 2.4 Establishing the Integrated Plot Centre From the Reference Point, measure to the Integrated Plot Centre. Procedures 1. Accurately measure the m along the correct bearing to the Integrated Plot Centre to eliminate any possible small-scale bias in placing the centre (Figure 2.5). This point becomes the Integrated Plot Centre regardless of the site or conditions. The plot centre may be in an open forest, a rocky area, a road, a creek, or inside a standing tree. Note: If you feel that the site is unsafe or poses an undue hazard, the plot cluster or portion of a plot cluster may be dropped (see Section 2.5). The project supervisor will review other means of completing all or some of these hazardous plots. 12 March 2018

29 2. Drive a pin firmly into the ground at the Integrated Plot Centre. If site conditions make it impossible or inappropriate to imbed the aluminum pin at the Integrated Plot Centre, place it as close as possible to the plot centre, and record the offset distance and bearing from the pin to the plot centre on the Cluster Layout (CL) card (Figure A.5). 3. Collect GPS data at the Integrated Plot Centre. When GPS data cannot be collected at the plot centre, move to an area where data can be collected (such as an opening). Measure the distance and bearing from the point where data was collected back to the Integrated Plot Centre. Record these measurements in the appropriate section on the Cluster Layout card.. The final coordinate entered into the software must include any adjustments for offsets. If GPS data cannot be collected for the IPC at any site, the intended coordinates must be recorded using Intended as the GPS file ID and the intended coordinates entered in the corrected UTM field on the CL card. Note: It is critical that IPC coordinates are as accurate as possible in order to ensure samples can be used in a variety of analyses where knowing the precise location of the IPC is crucial. This is also important as the IPC is the only location requiring post-processed coordinates. Figure Layout of Reference Pin and Integrated Plot Centre March
30 2.5 When the sample is inaccessible In some instances, the complete sample or some part will not be accessible because of factors such as dangerous slopes, denied access, or physical safety concerns. It may be readily apparent from the access point or earlier that the area is inaccessible, or only as the sample location is approached. In some cases, small unmapped local features such as beaver ponds and water bodies may be encountered. The field crew is not expected to sample beyond what is considered reasonable and safe. For example, if the water level is above the "boot tops," then estimate the attributes if possible or drop the plot if reasonable estimates can t be made. The safety of the field crew is the first priority. Complete as much information as possible on the field cards, maps, and orthophotos to the point where field work was terminated. It is appropriate to estimate the portion of a sample not physically accessible [for example if the last few metres of a line transect is inaccessible but it can be seen that no pieces or a few pieces have to be estimated it is preferable to record the estimate(s) rather than recording the line portion as not sampled]. In another example, if ½ of the large tree plot is accessible and ½ is not accessible but can be estimated it is preferable to estimate the inaccessible portion. When all or part of a sample is dropped, complete the CH card and return it to the project manager. Specify why the cluster or plots cannot be established, for example: access to plot is too dangerous plot would be located in an unsafe area plot would be located in a river or lake permission denied to access private land Provide detailed comments as required. 2.6 When the sample is in a harvested site In some instances, recent harvesting has not been captured in the inventory files and the harvested polygon may have been selected for VRI ground sampling. The establishment of a VRI ground sample will depend on the nature of the harvesting. Clearcut portions of the polygon would be, by their nature, non-forested or vegetated and may be outside of the population of interest, whereas selectively logged sites may still be considered to be forested and within the population. Project Planning: The project manager who prepares the sample plan (VPIP) and sample packages will obtain the most current satellite image of the area to check to see if any of the proposed samples have been clearcut. If it obvious at this stage that the sample has been clearcut and is outside the population of interest, the sample will be dropped and replaced with another one. The sample will be kept if it is unclear whether it has been clearcut. Field Procedures: The VRI field crew will establish all points in the VRI cluster according to the polygon boundaries shown in the inventory, unless it is clear that the Integrated Plot Centre (IPC) has been clearcut. A clearcut would be an area that is estimated to be greater than 1 hectare in size. All other cases will require that the sample be established. These include samples that fall in partially (selective) harvested blocks or samples where one or more of the auxiliary plots have been logged. The stand disturbance portion of Section 3.4 provides instructions on the recording of details around the disturbance type and estimates of volume loss in the comments section of the field card. A decision as to whether these samples should be kept in for analysis purposes will be made on an individual sample basis by the Ministry in conjunction with the analysis contractor 14 March 2018
31 3. Plot Establishment Introduction This section outlines the layout of plots and measurement procedures at the Integrated Plot and Auxiliary Plots. For more detailed procedures refer to the appropriate sections. Objectives To establish sample plots for the Vegetation Resources Inventory. Definitions The Vegetation Resources Inventory sample design is a five-point cluster consisting of an Integrated Plot located at the centre of the cluster, and four Auxiliary Plots located in cardinal directions around the Integrated Plot. The location of the cluster is pre-determined, using statistically appropriate procedures, at the project planning stage. The Integrated Plot Centre is the location around which the detailed sample information will be collected. All attributes are attached to the plot centre point. Data is collected on the following major items using the sampling methods listed. Table Summary of data collected at IPC and sampling method employed. Data tree attributes top height tree wildlife tree attributes small trees and stumps vegetation species and percent coverage ecological site soils old growth designation coarse woody debris range resources Sampling Method variable and/or fixed area fixed area (5.64 m radius) variable or fixed area fixed area (2.50 m radius) fixed area centre point point point line transect line transect and fixed area March
32 The Auxiliary Sampling Plots are used to supplement the basal area information collected at the Integrated Plot. Only tree-specific data is collected at Auxiliary Plots. The five-point cluster layout is illustrated in Figure 3.1 and an illustration of all sampling plots is shown in Figure 3.2. N 50 m Integrated Plot Centre W 50 m 50 m E Auxiliary Plot 50 m S Figure The Five-Point Cluster Layout for the Vegetation Resources Inventory General Procedures 1. Confirm that the Integrated Plot Centre is in the correct location. 2. Assess safety considerations. 3. Verify plot configuration. Is the plot on the border of the polygon? Are the Auxiliary Plots within the polygon? Note: Both these items should be obvious from the orthophoto used. 4. Determine and carry out the sequence of activities. Assess the site vegetation and determine the most efficient sequence of measurements to ensure that specific values are not degraded by other activities. For example, on a site that has forage value, plants of interest may be trampled if tree heights are measured first. 5. Record the Integrated Plot and Auxiliary Plot characteristics (for example, project and sample ID, type of plot, BAF). 16 March 2018
33 Auxiliary Plot at 50m 24m random transect 1 Plot 2 24m transect 2 Plot 1 Plot 3 Plot m IPC 2.50m 5.64m 6 and 12 m range micro plots 10.00m ~25m Figure Layout of Sampling Plots and Transects and Summary of Data Collected Integrated Plot Centre (IPC) all attributes are attached to the location of the plot centre point 2.50 m fixed-radius small tree and stump data 3.99 m fixed radius optional project based small tree plot size 5.64 m fixed-radius tree detail (sometimes); top height tree; herbs, grasses, bryoids and optional project based small tree plot size variable-radius within 10 m fixed-radius approximately 25 m radius tree detail estimated tree and shrub cover percentage, ecological data, soil pit succession 50 m in cardinal directions auxiliary plots 24 m transects m radius coarse woody debris transects, range transects range micro-plots along the transects at 6 m and 12 m March
34 Field Cards for this Section Header Card (CH) (Appendix A, Figures A.1 and A.2) Polygon ID, project ID, sample plot, date, crew, notes Compass Card (CP) (Appendix A, Figures A.3 and A.4) Tie-Point Tree, Reference Pin Location, Reference Tree, GPS, file numbers, field survey notes Cluster Layout (CL) (Appendix A, Figures A.5 and A.6) Integrated plot details sample cluster details Detailed Procedures Depending on the sequence of measurements, perform the functions described below. 3.1 Establishing the Plots at the Integrated Plot Centre Selection of Plot Type Tree Detail Plot 1. Establish a variable-radius plot (Figure 3.3), or a fixed-radius plot (Figure 3.4), for trees 4.0 cm DBH and larger. Note: The VRI cruiser will select the sampling method to be employed for each polygon prior to reaching the IPC 2. Select all potential in or out trees. 3. Decide if plot is a border plot or a plot that must be split. 4. Number the trees sequentially clockwise from the north. 5. Measure all borderline trees to determine in or out. 6. Mark all numbered out trees with an X. 7. Make detailed measurements on the selected in trees for diameter, length, grade, wildlife tree attributes, damage agents, loss indicators, and other details. 18 March 2018
35 North In 1 Borderline tree measured in 5 IPC 2 In 3 In In 4 Tree is in when measured as a circle Out Figure Variable Radius Plot Layout North Integrated Plot Centre m Radius 4 5 Centre of tree 5 is out of 5.64m plot 3 Figure m Fixed-Radius Plot Layout March
36 Small Tree Plot (2.50 m, 3.99m, or 5.64m fixed-radius) 1. Establish a 2.50 m, 3.99 m or 5.64 m fixed-radius plot (as determined by the project specifications), centred on the Integrated Plot Centre (Figure 3.5). 2. Count live trees less than 4.0 cm DBH and more than 10 cm in length. Record in three predetermined classes. Procedures are available for splitting small-tree plots with an excessive number of trees. Stump Plot (2.50 m fixed-radius) 1. Establish a 2.50 m fixed-radius plot, centred on the Integrated Plot Centre (Figure 3.5). 2. Collect stump data (larger than 4.0 cm top diameter inside bark) on this plot. The stump plot is never split for too many stumps. Trees =>4.0cm DBH (do not tally) IPC Trees <4.0cm DBH and > 10cm length (tally) Stump >4.0cm diameter inside bark (tally) 2.50m Plot Radius (Small tree plot may instead be 3.99m or 5.64m plot radius) Figure Small Tree and Stump 2.50m Fixed-Radius Plot Layout Top Height Tree Plot (5.64 m fixed-radius plot) 1. Establish a 5.64 m fixed-radius plot, at the Integrated Plot Centre (Figure 3.6). The top height tree plot is never split. 2. Measure a top-height tree, if a dominant or co-dominant tree is available within this plot. 3. Determine the species composition (by basal area) for the sample cluster. 4. Measure a sample tree of the species leading in basal area, if a suitable tree is available within this plot. 5. If a suitable leading species tree is not found within this plot, select a replacement leading species tree that is suitable within 25m of the plot centre. The original nonsuitable tree is not recorded.. 6. Measure a sample tree of the next species in order of basal area, if a dominant or codominant tree of that species is available within this plot. 20 March 2018
37 The first tree selected at the IPC is the top height tree; for example this tree may be a cedar tree. After completing the cluster, the leading species by basal area for the cluster is determined to be Cedar. The cedar tree is now also the "leading species tree" and the data will be recopied on the field card into the leading species information data fields. Alternatively, if the cluster leading species by basal area is hemlock, then the cedar tree may be the second species sample tree and the data will be recopied as required. 1 5 IPC m radius nested plot 5.64m radius nested plot 3 4 Figure Top-Height Tree 5.64m Fixed-Radius Plot Ecological Data Plots 1. Establish a full fixed-radius plot (10 m radius) centred on the Integrated Plot Centre to measure trees and shrubs (Figure 3.7). 2. Establish a full fixed-radius plot (5.64 m radius) to measure herbs, grasses, and bryoids. 3. Within a 25 m radius of the Integrated Plot Centre determine succession and old-growth characteristics of the Integrated Plot Centre within the polygon. 4. Establish a soil pit describing the Integrated Plot Centre within the 10 m radius plot. March
38 1 5 IPC m m 10.00m Soil Pit describing plot centre (within the 10m plot, but as close as possible to the IPC ~25m radius (within the polygon) Figure Ecological Data Collection Plot Layout Coarse Woody Debris Line Transects 1. Establish a 24 m horizontal line transect from the Integrated Plot Centre along a previously selected random bearing (Figure 3.8). 2. Measure all coarse woody debris greater than 7.5 cm diameter at the point of intersection. 3. Include detailed measurements at the transect crossing point on diameter, tilt angle, and decay class. Also record species and piece description. 4. Establish a second 24 m transect from the Integrated Plot Centre at plus 90 from the first line and take measurements again. 22 March 2018
39 24m transect random bearing 24m transect 90 IPC 2.50m 5.64m 10.00m ~25m Figure Coarse Woody Debris Line Transect Layout Forage Production Micro-Plots and Shrub Transects Forage Production Plots 1. Establish four plots of m radius on the coarse woody debris transects at 6 m and 12 m from the Integrated Plot Centre (Figure 3.9). 2. Determine the forage utilization. 3. Collect and label samples of forbs and graminoids. March
40 Shrub Transects 4. Identify the shrub species and measure foliar cover intercepts along the full length of the transect lines, if possible. 24m transect random bearing ~25m 24m transect Plot 2 12m Plot 1 6m Plot 4 12m IPC 2.50m Plot 3 6m 5.64m 10.00m Figure Shrub Transects and forage Production Micro-Plots Layout 3.2 Establishing the Auxiliary Plots 1. Establish Auxiliary Plots at points 50 m out from the Integrated Plot Centre along the cardinal directions (Figure 3.10) within the polygon of interest. 2. Drive a metal pin at each auxiliary plot centre. 3. Establish variable-radius plots or fixed-area plots for live and dead standing trees greater than or equal to 4.0 cm DBH. Use the same BAF or plot radius as that used at the Integrated Plot Centre. 4. Number the live and dead standing trees and record the species, diameter, and height for the selected trees. 5. Fully measure the first occurrence of a standing live tree species not previously encountered using the random number table. (Make the same measurements as if it was on the Integrated Plot.). Similarly fully measure the first occurrence of a standing dead tree species not previously encountered using the random number table. (Make the same measurements as if it was on the Integrated Plot.). Consider live/dead status to be the equivalent of a new species, so if only a live tree of a given species was encountered in the IPC, and a dead tree of that species is encountered in an auxiliary plot, enhance the dead tree (and vice-versa). 24 March 2018
41 6. Establish 5.64 m radius plot and measure the leading species age and height information, if available. Top height and second species tree measurements are not made on the auxiliary plots. N 50 m Integrated Plot Centre W 50 m 50 m E Auxiliary Plot 50 m S Figure Auxiliary Sampling Plot Layout Replacement of Dropped Auxiliary Plots Auxiliary plots that lie outside of the polygon boundary have been previously dropped from the plot cluster, however, this policy has been modified to one of replacement of some or all of these dropped auxiliary plots. Replacement plots will be selected from an expanded grid that is placed over the plot cluster, where the grid consists of one 50 m expansion at cardinal directions for a total of 20 new locations. The empty grid intersection closest to the IPC plot that is still within the polygon will be selected as the replacement plot. Examples of the plot replacement process are provided in Figure Note that a limit has been placed on the geographic dispersion of the cluster so in the event of the sampling of narrow fingers of a polygon, not all dropped plots will be replaced, (see examples in figure 3.11). Note: Some auxiliary plots (or portions of them), may fall within unmapped areas of within-polygon variation (i.e., areas where the trees, ecology, microsite, etc. are significantly different from the average conditions of the majority of the polygon as represented by the other plots in the cluster). So long as this area is unmapped, such an auxiliary plot will not be replaced. It is desirable to capture this natural variation within the target polygon. Details: 1. Auxiliary plots that fall outside the polygon should be determined by the project manager in advance of plot establishment. Depending on the geographic location of the actual placement of the IPC, one or more of the remaining auxiliary plots may be found to be outside of the polygon and should be replaced by the ground samplers. March
42 2. Use an expanded grid consisting of one 50 metre expansion at cardinal directions beyond VRI plot cluster. 3. Replacement auxiliary plots will be the grid points closest to the IPC. Examples are noted below in Figure Use the VRI random number selection table to select the replacement from the grid points that are equidistant to the IPC. Use the sample number as the seed and select the first location from left to right of the available closest grid points. 5. Identify the replacements location number in the TIMVEG VRI Plots, Plot Location screen (--) for not replaced.. 6. Enhancement of new species trees where there has been an auxiliary plot replacement will occur in the plot that the new species first occurs in a manner clockwise from North. In the example Sample 72 below, the plot order for enhancing a new species will be N, 10, 2, E. Polygon Boundary N N W IPC E 14 6 W IPC E S S Sample 23. Replace West plot with replacement plot 2. Sample 72. Replace South plot with replacement plot 2, and West plot with replacement plot N N W IPC E 14 6 W IPC E S S Sample 14. Replace East plot with replacement plot 2, South plot with replacement plot 10, and West plot with replacement plot 13. Figure Examples of Auxiliary Plot Replacement Sample 12. Replace East plot with replacement plot 10. Do not extend grid to establish additional replacement plots March 2018
43 3.3 Taking Ground Photographs A series of digital ground photos will be taken at each Integrated Plot with flash. Individual file size should be approximately 1024 x 768 pixels. Objectives The photos will be available as digital data for: initial assessment by potential users who may want to sub-sample on these locations for other values; and capturing some information that is not directly measured. Procedure Take a minimum of three photos at each Integrated Plot location. The three required photos are as follows: the Integrated Plot Centre pin a photo along the first random-bearing transect line a representative shot of the area (in the crews opinion) Do not cut trees or vegetation to provide an unobstructed view. Take the photo before taking measurements if the site may be damaged during sampling. 1. Photograph the Integrated Plot Centre Pin at a steep angle (about 60) above the pin showing the pin and the ground for approximately one metre or more around the pin so the vegetation can be seen (Figure 3.12). Include something to record the plot number, particularly on this photo. 2. Photograph the random-bearing transect from a position behind the plot centre pin (Figure 3.13). Include the Integrated Plot Centre Pin in the foreground, if possible. Include something for relative scale determination. Try to include the various crown levels with a portrait (vertical) format, if required. 3. For a representative photo, photograph a portion of the plot which the crew considers representative of the sample vegetation and structure (Figure 3.14). Include the IPC and an item for scale in the photo. 4. Photograph any other unusual features that you think would be of interest to users of this data. You may wish to illustrate issues about the sampling process, such as when rules do not seem clear or appropriate. Make notes about these photos so the points can be addressed later. 5. Try to include people in each photo for scale. Use a scale in any close-up photos. 6. Include the plot number in the photo. 7. Record the photos taken and any comments on the (CH) Header Card. 8. When samples are submitted, each file must be in JPEG format and named in the following manner Project_ID-Sample_ID-Plot_Type-photo_subject. For example Q01-Representative.jpg March
44 3.4 Completing the Header Card (CH) A Header Card (CH) must be completed for all sample clusters. In addition, data must be recorded to identify each individual field card in case cards are separated. Some of the information is completed prior to sample establishment and some information during or as soon as possible after sample cluster completion. In all cases the Header Card must be completed even if the sample was inaccessible and not completed. Procedure 1. Record the following information on the Header (CH) card and all other field cards: DATA ID PAGE OF The Data ID (Project ID and Plot Sample #) must be recorded on all field cards (front and back), notes, sample collections, tree age cores, and so on. If the field cards provide inadequate space to record data, additional cards may be used as required. 2. The following information will be completed at another time: FIELD CHECK BY OFFICE CHECK BY The full name of the person conducting a field check of the plot, and date of check. (This is not an Audit check.) The full name of the person conducting the office check of the plot, and date of check. 3. Record the following information on the CH field card: DATA ID PROJECT ID PLOT SAMPLE # POLYGON IDENTIFIER This section provides primary identification of the sample cluster. The values are assigned prior to field sampling and provided to the field crew. Values may also be entered by the project supervisor prior to field sampling. The province has been divided into a number of inventory units. Record the code provided. Each sample cluster is assigned a number. Record the number provided. A unique value is assigned to all polygons within the province. Enter the number provided. 28 March 2018
45 PLOT TYPE The plot type coding consists of three characters as follows: Character 1 - type of sampling O = VRI sample R = Range sample Q = Timber Emphasis sample D = Timber Emphasis plus CWD Z = Timber Emphasis plus Site Series T = Timber plus Succession E = Ecological sample C = Coarse woody debris N = Net volume adjustment sample W = Within polygon variation B = Basic sample See Table 3. for field cards for each project type. Character 2 - intent of sample O = Original R = Re-measurement A = Audit M = Matching Character 3 - measurement number 1 = first measurement 2 = second measurement, and so on MEASUREMENT DATE CREW INITIALS Note: Typical examples of coding are as follows: - QO1 = initial measurement of a Timber Emphasis sample - QA1 = initial audit of a Timber Emphasis sample - OO1 = initial full VRI sample The date the sample cluster measurements were initiated. Use this format:1999-aug-12. Record crew members in order of responsibility for the work done, Person #1 is the crew leader. A record of crew initials (usually 3 initials as assigned) will be maintained by the Ministry of Forests, Lands and Natural Resource Operations, and if overlaps occur a numeric value may be added (for example, JSF1 and JSF2). March
46 FIELD RESPONSIBILITY PLOT CLUSTER RECORD INTEGRATED AUXILIARY PLOTS RANGE, ECOLOGICAL, CWD PHOTOS TYPICAL: TREES, ECOLOGY Record the full name of the person with primary responsibility for collection of each type of data (tree data and ecological data). This section provides a record of the information collected for a sample cluster. Check Yes or No for the information completed for each plot. Check No if the sample was inaccessible or unsafe. In the Notes section, provide reasons the sample was dropped or suggestions for accessing or completing the sample. Check plots completed (North, East, South, West). Check the plots completed. Record number of photos taken. Check (Yes or No) to indicate if the tree data or ecological data are typical of the polygon sampled. For example, the Integrated Plot or one or more of the Auxiliary Plots may be located in a wetland microsite within an upland forest and not typical of the polygon being sampled, in the opinion of the crew. Where either the trees or ecology are not specifically sampled (for example, tree emphasis plots do not assess the ecological attributes), record a -- in both columns. Note that in all cases the sample will not be moved. 30 March 2018
47 STAND DISTURBANCE NOTES If there is a natural or human induced event that has caused the volume to be reduced by more than 25% from that on the VRI phase I maps in any given plot, then a disturbance code must be recorded. The volume reduction is an estimate from the field crew only. The disturbance field is recorded as an attribute for the entire cluster. This should not be confused with reductions in volume due to natural stand variability. For example a sample that falls in an unmapped pocket of shrubs, or an unmapped pocket of smaller trees would not be recorded under the disturbance code (unless caused by an agent listed in the disturbance codes). Details of the disturbance should be recorded in the comments section, and should include an estimate of the volume lost, and any other details that may assist in the analysis of volume discrepancies. Crews are not expected to calculate lost volume. The information provided will be reviewed during the sample analysis to determine reasons behind large discrepancies between the phase I estimates and phase II measurements of volume. If there is more than one cause in a plot, choose the most significant cause. If there are two successive causes then record the most recent one (for example, an area burnt and then salvage logged would be recorded as logging) Stand Disturbance codes include NB - Fire NW - Windthrow DD - Heartrots DF - Foliage diseases DR - Root diseases D - Unknown disease IB - Bark Beetles ID - Insect defoliators A - Animal L - Logging, thinning, clearing, brushing and weeding (add details in comments) X - Other known (add details) U - Other unknown O - No significant damage Record the appropriate code for the disturbance in columns (S9 and S10) on the CH card with applicable comments recorded in the adjacent comments section. Enter any comments relevant to the cluster measurements (such as photo notes, procedure problems). March
48 PHOTO RECORD Record the ground photos taken. If additional photos were collected, provide a short description with roll number and photo number. If no photos were taken, mark a --- through both boxes. VRI Ground Sample Types The following table illustrates the field cards completed for various VRI ground sampling types. To provide consistent data across the province, a standard set of field data is preferred. The opportunity to collect additional data or portions of additional field cards is available and would be identified through the Project Implementation Plan (VPIP). Table 3.2 Field cards for Ground Sample Types Sample Field Cards Type Code CH 1 CP 2 CL 3 RS 4 RT 5 EW 6 EC 7 TD 8 TL 9 TS 10 TA 11 EP 12 ED 13 ET 14 EH 15 EO 16 VRI - Full O X X X X X X X X X X X X X X X X Range Only R X X X X X Timber Emphasis plots (TEP) TEP plus CWD TEP plus Site Series TEP plus Succession Q X X X X X X X D X X X X X X X X X Z X X X X X X X X X T X X X X X X X X Ecology E X X X X X X X X X X X X CWD C X X X X X NVAF N X X X X X Within- Polygon Variation W X X X X Basic B X P P P P P X = Mandatory, P = Partial (some portions of cards must be completed): Type B The following information is not collected in Basic plots: 32 March 2018
49 Tie point map, polygon and flight line number, Tie Point Tree information (Species, diameter, azimuth, distance, CMI tag number), Straight line bearing and distance to IPC, Height to Live Crown, Call Grading/Net Factoring, Wildlife codes, Damage Agents/Severity, Loss indicators, Small tree plots, Stump plots. 3.5 Completing the Compass Card (CP) The Compass Card (CP) provides an additional means of relocating samples in the short and long term (20 years or more). Procedures Complete a Compass Card(s) for each sample cluster. Record as much information as possible. In addition to the Data ID, at a minimum record the following: MAP NO. / POLYGON NO. FLIGHT LINE / PHOTO NO. TIE POINT / REFERENCE POINT DETAILS COMMENTS GPS FILE ID STRAIGHT LINE BEARING AND DISTANCE TO IPC Forest cover map and temporary polygon numbers. Airphoto numbers on which the tie point and sample are located. Record the Tie Point and Reference Point details, and offset Reference Pin where applicable. Record the Species, Diameter (DBH in cm), the azimuths and distances from the Tie Point Tree to tie point location and Reference Point Tree to Reference Point Location. In some cases a tie point or reference tree will not be available. In these cases the crew could use a rock feature as a reference [record ROC in the species record] or any other identifiable feature such as telephone pole, hydro tower [record OTH in the species record and specify the feature in the comments section]. Record any special features of the tree (e.g., major fork). Record other features of the Tie Point. If there is no Tie Point Tree, describe the Tie Point (e.g., junction of Loss Creek Main and Branch 300; northeast corner of Cutblock 11 on Branch 302; northwesterly edge of snowslide track). Record offset GPS reading, if applicable Record the horizontal distance and azimuth from the Tie Point to the Integrated Plot Centre. March
50 NAVIGATION NOTES ACCESS POINT LOCATION Map the features along the tie line. Record Vegetation or timber type changes, creek locations (names, if known), rock bluffs, etc. Record description, GPS file ID. 34 March 2018
51 3.6 Completing the Cluster Layout (CL) Card) A Cluster Layout card (CL) will be completed for all clusters. The card provides a location to record detail on the features around the Integrated Plot Centre and the features associated with the sample cluster. Procedure Record the following information on the CL field card: GPS INTEGRATED PLOT CENTRE SLOPE PROFILE INTEGRATED PLOT DETAILS SAMPLE CLUSTER DETAILS COMMENTS Record the file number in the GPS Integrated Plot Centre field. Record offset GPS reading, if applicable. If a GPS reading was not available at the site record in the comments section why no data was collected. Record offset Integrated Plot Pin details, if applicable. Recording the intended or target UTM co-ordinates: Field cards on the field card record the intended UTM coordinates in the comments section on the back of the CL card. Handheld Enter Intended as the GPS File ID and input the intended coordinates in the corrected UTM field on the CL card Sketch the cross section including Integrated Plot Centre which best describes the local topography. Map distinctive features within the plot such as water bodies, rock outcrops, site series boundaries. Show relative position of tree stems. Record the Auxiliary Plot spacing. Map distinctive features within the sample cluster area which may aid in plot relocation, such as creek locations, road locations, polygon boundaries. Map the Reference Pin location and tie point location if it is close to the Integrated Plot Centre. Record the grid locations of the replaced auxiliary plots and any comments which may aid in relocation of the plot or other items of interest. March
52
53 4. Inventory Cruising Introduction This section deals with the identification and collection of detailed tree information from which volume can be calculated, quality can be assessed, and site potential can be determined. Trees may be sampled using variable-radius plots or fixed-radius plots. Objectives To collect attributes for the calculation of tree and stand volumes. To collect site index information. To assess and collect tree attributes for: future growth and yield assessment, wildlife, decay research, and forest health information. To provide timber information which will aid future sampling processes for other disciplines. General Procedures Tree measurements are discussed in this section as they appear on the field cards, but the field crew is free to measure attributes in the most efficient sequence. Net factoring and call grading are discussed in a separate section. The steps are discussed in the following order: 1. Establish plot layout, select a suitable basal area factor, and identify trees to measure. 2. Identify and record tree attributes. 3. Assess and record wildlife use. 4. Record damage agent and severity codes. 5. Identify and record tree loss indicators. 6. Establish fixed-radius plot for small tree and stump data. 7. Classify and tally small trees by species. 8. Measure and record stump data. 9. Establish a fixed-radius plot for top height and sample tree measurements. 10. Select and record top height tree data. 11. Establish Auxiliary Plots. 12. Identify and record trees by species and DBH, and additional measurements on new species, if required. 13. Determine leading species composition (by basal area) for the sample cluster. 14. Select and record leading species height, age, and growth information for all sample points. Select and record a second species sample tree for the Integrated Plot only. 15. If a suitable leading species tree is not found within this plot, select a replacement leading species tree that is suitable. March
54 Field Cards for this Section Tree Details (TD) (Appendix A, Figures A.11 and A.12) Tree number, species, status, DBH, remaining bark, length, net factor, grades, stem map Tree Loss Indicators (TL) (Appendix A, Figure A.13) Damage agent, severity, loss indicators, location and frequency, and wildlife codes Small Tree, Stump, and Sample Tree Data (TS) (Appendix A, Figure A.14) Small tree, stump, and sample tree data, including ages. Auxiliary Plot Card (TA) (Appendix A, Figures A.15 and A.16) For recording the specific data at Auxiliary Plots Detailed Procedures 4.1 Establishing Plot Layout, BAF, and Partial Plots Selecting the Sampling Method The sampling design accommodates the use of either variable-radius plots or fixed-radius plots for the sample clusters when measuring large trees. Once selected, the sampler will maintain the plot type throughout the cluster. The VRI cruiser will select the sampling method to be employed for each polygon prior to reaching the IPC, using the guidelines below. Variable-Radius Plots would normally be used in most stands in the inventory. Fixed-Radius Plots would normally be used in the following situations: stands expected to have less than 15 m2 of basal area stands with sapling-sized regeneration non-treed polygons The design specifies a fixed plot size of 5.64 m radius. Using only one plot size eliminates a potential source of bias which could be introduced if crews change the plot sizes in the field to obtain some desired tree count. Selecting the Basal Area Factor (BAF) Objectives The primary objective is to have an accurate tally of trees at all points. (The definition of tree can be found in Section 4.2.) A secondary objective is to have an efficient number of trees for analysis. Basal Area Factor The optimum basal area factor (BAF) will result in an average of 6 to 8 live trees per plot within the polygon. A sample plot may have fewer than 6 live trees or more than 8, but over the entire cluster an average of 6 to 8 live trees per plot is desirable. 38 March 2018
55 In stands with high numbers of dead trees, it may be acceptable to include dead trees in the average tree count. For example, in Mountain Pine Beetle or fire killed stands where numerous trees are recently dead, but still mostly sound, the BAF selection would result in 8 to 10 live and dead trees. These situations should be discussed with the project manager. The sample size should ensure efficient volume and basal area measurements and minimize non-sampling error due to excessive or difficult measurements. In areas with reduced visibility or difficult ground to sample, the BAF size may be increased to reduce the potential for measurement error. The selected prism size (BAF) should be used throughout the sample cluster. The selection of this BAF must be determined prior to arrival at the Integrated Plot Centre. As a minimum, the selection will be made at or before the reference pin location en route to the Integrated Plot Centre. A number of ways to select the appropriate BAF are discussed below. Procedure 1. As you approach the sampling site within the polygon quickly do tree counts using various prism sizes. 2. In areas with restricted visibility, choose a BAF that minimizes the potential of missing trees. 3. Each polygon will have an estimated Basal Area assigned during the photo interpretation phase. The basal area divided by the desired tree count may provide guidance to the approximate prism size to select. The approved Basal Area Factors are listed in Table 4.1. The approved BAF s are limited to discourage switching prisms to obtain some desired tree count by the sampler, as this can create a potential bias. All measurements will be recorded using metric BAF. The smallest prism size is set at a metric 5 BAF to reduce the plot radius to a reasonable distance and avoid missing trees. Table Approved BAFs to be used. Prism size in m 2 /ha Diopter Relaskop value in m 2 /ha Diopter Once you have selected a BAF for the cluster, keep that size throughout the plot cluster. If more than one cluster is established in a polygon, the preference is to use the same prism size throughout the polygon. 5. If the BAF selected results in too many tree measurements, which can result in nonsampling errors, split the plots using the procedures discussed below. March
56 Measuring Borderline Trees In and Out The objective of the inventory is to correctly determine which trees are within the plot. The procedure will vary by plot type. The face of a tree at DBH will be used to check the borderline distance. Fixed-Radius Plots 1. Correct all measurements to horizontal distance. 2. Use the central point of the tree stem at Point of Germination to determine if the tree is in or out of the sample. This central point is generally equated with the tree pith. Variable-Radius Plots Use a prism or relaskop to select trees for measurement only when the tree can be clearly determined to be in or out. If the observed DBH is not obviously in or out, measure the tree for DBH and compare the horizontal distance with its plot radius. If you are not able to clearly decide if a tree is in or out, you must measure it. Using the BAF chosen for the sample, determine the Plot Radius Factor to tree face (PRF f = (0.5/sqrt BAF) ). Multiply the PRF f (which will be the same for the entire sample, since only one BAF is used) by the diameter of a tree being measured in order to obtain the critical distance for that tree (otherwise known as its tree plot radius ). Measure the horizontal distance from the plot centre to the face of the tree being measured at breast height. If the horizontal distance to the tree is less than the critical distance, the tree is in. If the horizontal distance to the tree is greater than the critical distance then the tree is out. All trees measured for borderline status must have an M painted on the trees to indicate they have been measured. The horizontal distance must also be recorded in the comments section. This is necessary to assist in the quality assurance of the field work. Split Plots and Border Plots In some instances it will not be appropriate to establish a full 360 plot. In these cases split or border plots must be established. The use of these plot types is to be strictly controlled by the processes outlined here (Figure 4.1 and 4.2). The only tree plots that can be split or border plots are: the large-tree variable-radius plot the large-tree fixed-radius plot the small tree plot (Note: The stump plot and top height plot are never split. The stump plot may be a border plot.) Split Plots The selected prism size or fixed-radius plot size may result in excessive trees to be measured at one or more plots within the cluster. It is not desirable to measure all these trees because the following may occur: Trees may be missed or added to the plot due to the number of measurements required, or to visibility constraints. 40 March 2018
57 Valuable crew time is expended at one location which may be better utilized on other measurements or at other locations. Procedure 1. Estimate the number of live trees in with the BAF or fixed area for a full sweep around the plot. Do not make careful measurements or borderline tree checks at this time. 2. If this estimate indicates that more than 10 live trees will be in, then split the plot using the following conventions: Split the plot along the north-south cardinal bearing through the plot centre (if it is already a border plot, split it into two halves using a bearing at right angles to the polygon boundary) Even numbered plot cluster = measure East half Odd numbered plot cluster = measure West half Record the plot as split on the field card. 3. Once the decision has been made to split the plot, maintain the split even if careful measurements indicate that 10 or fewer trees would have been in the original plot. 4. A cluster may contain any combination of full and/or split plots. For example, the main plot may be full, and one or more of the Auxiliary Plots may be split. 5. Variable-radius plots will be split into ½ plots only. 6. Fixed-radius plots may be split into ½ or ¼ plots. 7. Record the azimuth of the starting point of the half or quarter sweep. Border Plots The plot centre and the polygon boundary may be established close to the adjacent polygon based on the relative size of the timber. As the vegetation inventory sampling is polygonbased, the tree plot measurements (whether variable or fixed) will be taken within the polygon of interest only. Ecological plots and top height are an exception as the plots might extend into the neighboring polygon. To determine if a border plot is needed (i.e., the IPC is indeed too close to the adjacent polygon), first look for the largest diameter tree in the local area (up to ~20 m out from IPC). Note that this largest tree could be a recently logged tree (for which its DBH would be estimated from the stump). If that tree s calculated plot radius (or critical distance ) is larger than the distance between the IPC and the estimated polygon boundary, then a border plot is needed. Procedure for half border plots Estimate the location of the polygon boundary. Determine the azimuth of the polygon boundary. Establish a line parallel to this azimuth through the plot centre. Establish a half plot by using a fixed area sweep or by sweeping with the prism toward the inside of the polygon, and record all tree data for this side of the plot. Record the plot as half on the field card. Record the azimuth of the polygon boundary on the TD or TA field card (the bearing is the start point of the sweep). March
58 POLYGON OF INTEREST Type Boundary Azimuth = 165 Line A Plot Centre ADJACENT POLYGON Line A parallel to polygon boundary Bearing start point is 165 Figure Polygon Border - Half Plot Layout Procedure for quarter border plots In some instances the boundary of the polygon will not allow establishment of a half plot, in which case it will be necessary to establish a quarter plot. 1. Determine the location of the polygon boundary. 2. Determine the azimuth of the polygon boundary. 3. Establish a right angle quadrant within the area available for sampling. 4. Record the plot as quarter on the field card. 5. Record the azimuth of the polygon boundary on the TD or TA field card (the bearing is the start point of the sweep). POLYGON OF INTEREST Type Boundary Azimuth = Line A Plot Centre ADJACENT POLYGON Line A parallel to polygon boundary Bearing start point is 255 Figure 4.2- Polygon Border - Quarter Plot Layout 42 March 2018
59 4.2 Identifying and Recording Tree Attributes Record the following measurements in the appropriate fields on the Tree Details (TD) field card. The fields to be recorded are listed and described below. For purposes of this inventory, a tree is defined as: a species identified as a tree for the VRI program, regardless of the size to which it does (or might) grow. Refer to the current version of the BC Tree Code List which is available on the Ministry of Forests, Lands and Natural Resource Operations, Research Branch website. longer than 1.3 m, having roots attached to the bole or an identifiable root collar; and greater than or equal to 4.0 cm at DBH. TREE NUMBER All trees will be numbered to identify them in the field and on the field cards. The plots may be re-measured in the future and are subject to audit cruising, and numbering the trees in a consistent sequence will enhance the chances of a successful re-measurement program. Trees will be marked (usually with log marking paint) in a way similar to an operational cruise plot so that the plot will not be treated in a special manner by other visitors to the site. Alternative marking methods may be required when it is not desirable to mark trees with paint or tags. Procedure 1. Start numbering the trees including borderline trees from due north of the plot centre on all plots, and proceed in a clockwise direction. 2. Mark all standing and fallen trees with painted numbers on the side facing the plot centre, if possible. 3. On trees too small to be clearly painted, wire a numbered tag to a branch near DBH. 4. Record trees missed on the first pass (therefore numbered out of order) on the field card (for example, tree 9 is between 3 and 4 ) as a comment. 5. Paint an X on trees measured out. 6. Stem mapping will be required for all trees. 7. If no trees are present, put a line across the data area and record No trees. TREE SPECIES Assign a species code to all trees, measuring all trees regardless of commercial value at the time of the survey. The tree species recognized in the inventory is the current version of the BC Tree Code List which is available on the Ministry of Forests, Lands and Natural Resource Operations, Research Branch website. Note: It has been decided not to measure the willow tree species on the large tree or small tree plots. The ecological component will still collect data on these species. March
60 Procedure 1. Record on the field card the tree number and a species code (up to 3-characters) for the tree being measured. 2. Code all species as accurately as possible using the BC Tree Code List. If possible identify the species. If the species cannot be identified with confidence, record the genus, if known. If the genus is not known, record the appropriate code (such as Xc for an unknown conifer). TREE CLASSES Assigning tree classes allows for reporting trees in categories and reflects some potential for future growth. Procedure 1. Record for each tree whether it is live or dead, standing or fallen. 2. Use the codes described in Table 4.2. Table 4.2 Tree status codes. Code Description Live/Dead L Live trees have enough foliage to keep them alive (live cambium is present), and are rooted into the ground. Lack of foliage for some species, of course, is no indication of death during some seasons. (MPB Stands: if the tree has green needles, it will be considered alive. The cambium will be checked only if there is doubt as to whether the needles are green). D Dead trees are obviously dead, or roots are separated from the ground. Standing/ Fallen S F Standing trees are self supporting (that is, the tree would remain standing if all supporting materials were removed). Fallen trees are not self-supporting. DIAMETER BREAST HEIGHT (DBH) Measure and record the diameter of all live/dead, standing/fallen trees equal to or greater than 4.0 cm DBH. Procedure 1. Determine high side ground level at the base of the tree. 2. High side is defined as the highest point of mineral soil or a humus layer around the base of the tree, no lower than the point of germination. Breast height is 1.3 m above high side measured parallel to the tree bole. 3. Measure the DBH in cm and tenths at 1.3 metres from the ground on the high side (Figure 4.3). 44 March 2018
61 4. Use a stake marked at 1.3 m to accurately locate DBH on straight stems. On curved stems measure along the curve parallel to the centre of the tree. 5. Paint a line on the tree where DBH was measured, preferably facing the plot centre. 6. Record the DBH with a tight diameter tape, outside the bark, making no allowance for missing bark. 7. Record whether the DBH was measured (M) or estimated (E). Figures through provide illustrations of correct DBH line placement. Figures and the 1.3m dbh line occurs at a swelling, which would not provide the appropriate volume for the stem. The diameter should be measured at points A and B and then averaged to provide a diameter that would be closer to the normal taper of the stem. It is important to follow VRI principles when determining where to place DBH. The cruiser needs to determine what makes sense. March


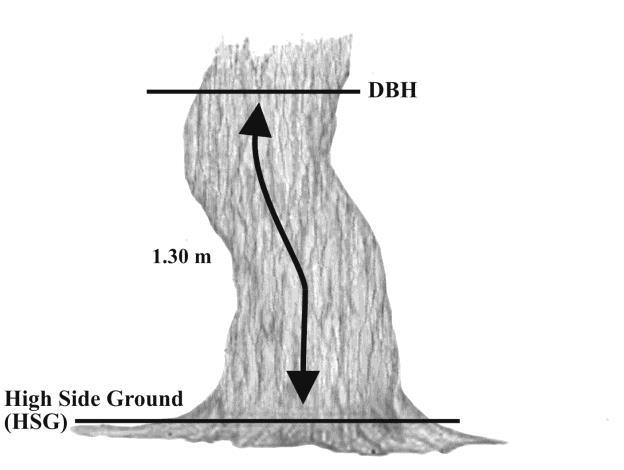
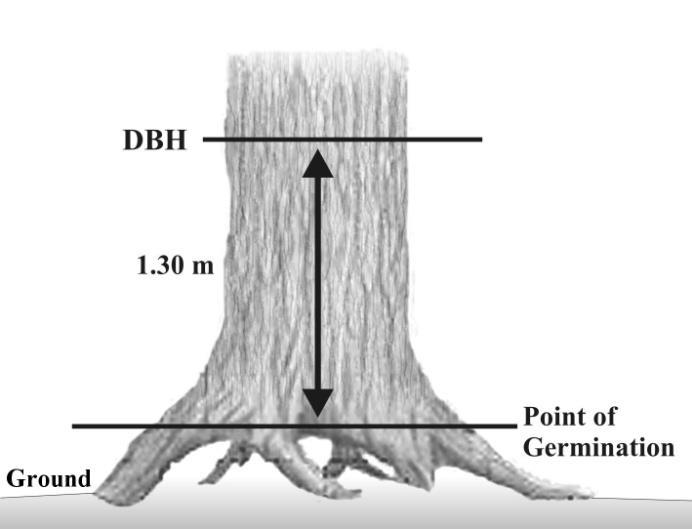
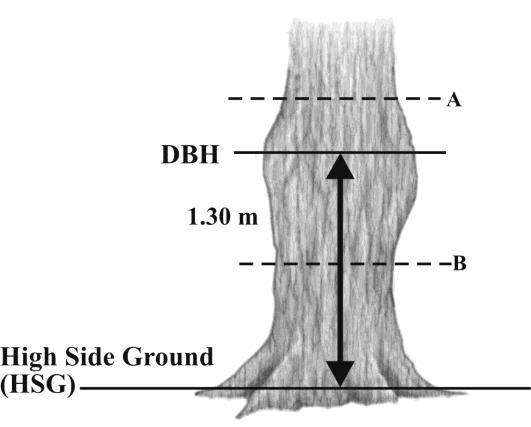
62 Figure Figure Figure Figure Figure Figure March 2018


")
63 Figure Figure Figure Figure Figure DBH in Relation to High Side Ground and Point of Germination (diagrams courtesy of Canadian Forest Service) March
64 REMAINING BARK PERCENTAGE The percentage of bark remaining is required to determine the actual wood volume of the tree. The impact on wood volume will be minor when small amounts of bark are missing, but could become significant when large areas of bark are missing, particularly on thick-barked species. Procedure 1. For each DBH measurement, record the percentage of bark remaining at DBH to the nearest percent, for example: bark: 100% record as - - bark: 90% record as 90 bark: 13% record as 13 no bark present: record as 00 Note: It does not matter if the diameter tape touches the exposed wood or not. 2. Calculate the bark remaining. A simple way to obtain the percentage of bark remaining is to observe the length along the diameter tape where the bark is missing, and subtract to find the amount remaining. Calculate the percentage of bark remaining using the following formula: Length of tape with bark Remaining Bark % = Total length of tape *100 % See Figure 4.4 for an example. Diameter Tape 16 cm missing (on tape) Diameter = 112 cm (on tape) Figure 4.4- Measurement of Remaining Bark 48 March 2018
65 EXAMPLE A On a cm tree, bark is absent from 79 cm on the tape to 95 cm, a distance of 16 cm (95 79 = 16). The percent bark remaining is then calculated using the formula. Length of tape with bark Remaining Bark % = Total length of tape *100 % = *100 % = *100 % 112 = 85.7% (Record 86%) TREE LENGTH Measure the length of each tree within the integrated plot, including broken and fallen trees. Measure all trees except where the measurement is physically obstructed, it is unsafe to make the measurement, or when an accurate measurement is impossible. In such cases estimate the tree length. For trees with broken tops, see discussion of Broken Tops below. For odd-shaped trees see Figure 4.5. Procedure 1. Estimate the tree length before measuring as a check on your calculations. 2. Measure the length of the tree from the ground level on the high side along the stem to the top of the stem. Record length to the nearest 0.1 m. For species that typically have an apical droop (e.g., cedar and hemlock), the measurement of the length should be made while standing perpendicular to the droop and measured to the apex of the droop. No additional estimated length should be added to account for the remainder of the tree length that extends beyond the apex of the droop. This should be recorded as a measured length, not an estimated one. For broken stems, measure the length that allows the most appropriate application of taper functions for calculating the volume of the tree. For fallen broken trees, record the length of the stem to the break. Measure the portion of the tree from the root collar to the top of the last connected portion (the pieces must be physically attached so that if one part is moved the next part will move). 3. Record whether the length was measured (M) or estimated (E). Estimated should be recoded in several different circumstances: March
66 o o o o The tree length (or a significant portion of it) is truly a visual estimate (e.g., the top third of an intermediate tree is fully buried in the thick crown of a dominant tree). The entire tree has a severe lean and sweep/bend such that a straight-line measurement is unlikely to be reliable. Using Pythagoras theorem on a severely leaning tree. For a non-apical drooping species, adding an estimated length to a measured portion of the overall tree length to account for a bent top Measured should be recorded in most other circumstances. Original Length Measure length to here Measure length to here Measure length to here Broken top tree Spike top tree Candelabra Figure 4.5- Measurement of Odd-Shaped Trees CROWN CLASS Crown class is a ranking by crown position of a tree in relation to other trees in the immediate area surrounding the tree being measured. The crown class will be useful in future growth models. Procedure 1. Assign a crown class code to all standing live trees using the descriptions in Table Dead trees and fallen live trees will not have a crown class assigned, mark a dash through the field card boxes. 3. On trees with a broken or dead top assess the remaining live portion of the crown as to its present interception of light in the immediate area around the measured tree. For example, a tree was formerly in a dominant crown position but the top of the crown has died back and only the lower limbs are alive. This crown would most likely be ranked in the intermediate or suppressed position based on the current light interception of the remaining crown. 50 March 2018
67 Table 4.3 Crown class codes. Code D C I S Description Dominant Trees with crowns that extend above the general level of the crown canopy (may include trees, shrubs or other obstructions) immediately around the measured trees. They are somewhat taller than the codominant trees, and have well-developed crowns, which may be somewhat crowded on the sides, receiving full light from above and partly from the side. Codominant Trees with crowns forming the general level of the crown canopy (may include trees, shrubs or other obstructions) immediately around the measured trees. The crown is generally smaller than those of the dominant trees and is usually more crowded on the sides, receiving full light from above and little from the sides. Intermediate Trees with crowns below, but extending into, the general level of the crown canopy (may include trees, shrubs or other obstructions) immediately around the measured trees. The crowns are usually small and quite crowded on the sides, receiving little direct light from above but none from the sides. Suppressed Trees with crowns entirely below the general level of the crown canopy (may include trees, shrubs or other obstructions) around the measured trees, receiving no direct light either from above or from the sides. Note: The IPC or some auxiliary plots (or portions of them), may fall within unmapped areas of within-polygon variation (i.e., areas where the trees, ecology, microsite, etc. are significantly different from the average conditions of the majority of the plots or polygon). Although crown class in these situations can be highly subjective, with enough physical separation, trees that are significantly shorter than the polygon/plot average can still be deemed to be codominant. This issue has implications for which trees are available for sample tree selection (refer to section 4.8). Ideally, various plot conditions regarding crown class should be reviewed in the field with a Ministry representative to help reduce the subjectivity of this attribute in complex stand conditions. HEIGHT TO LIVE CROWN Measure the height to the live crown for future research on all live standing trees (live fallen trees do not require a height to live crown). Height to live crown is the distance along the bole from the high side ground level to the crown base. The crown base is normally the location on the stem where live branches occupy about three-quarters of the stem circumference. The primary objective is to estimate the effective extent of live crown for growth projections. Procedure 1. Determine the crown base. The crown base is normally the location on the stem where live branches occupy about three-quarters of the stem circumference. If this is obviously not an effective definition, then use your judgment as to the effective crown length. March
68 2. Record the height to live crown for all live trees to the nearest metre. 3. Record trees that are dead or have no effective crown (those having only a few green branches) as dashes ( ). BROKEN TOPS Measure all broken trees to the location of the broken top. For the compilation program to apply appropriate form factors to the tree stem, the diameter at the breakage point OR the original (projected) length of the potential tree must be recorded. If the broken top is available on the ground then a direct measure of diameter or actual projected height may be possible to measure. Procedure 1. Measure the length of the tree stem to the break. For shattered stems, estimate the length after folding in shattered wood to make a whole diameter. 2. Choose one of the following options, depending on which can be most reliably estimated: estimate the diameter of the stem at the break estimate the original unbroken height of the tree 3. Record the broken top diameter (in cm) or the projected height (in m) on the field card. All trees with broken tops must have only one of these fields completed. 4.3 Assessing Tree Attributes for Wildlife Trees provide present or future habitat for the maintenance or enhancement of wildlife. All trees in the integrated plot will be assessed for a number of visual attributes such as appearance, crown condition, bark retention, and wood condition. These and other tree attributes, such as DBH, length, and percent sound, can be correlated to estimate wildlife habitat potential. Live trees and standing dead trees are assessed. They provide nest cavities and platforms, nurseries, dens, roosts, hunting perches, foraging sites, and display stations. Birds, mammals, amphibians, and various invertebrates use trees, and some species are highly dependent upon the specialized habitat provided by certain types of trees. While knowledge of the size and abundance of live and dead trees permits an interpretation of the habitat suitability of a particular stand, specific wildlife-related data for each tree sampled is much more useful. A record of actual wildlife use of individual trees provides information on the preference of wildlife species for trees with certain characteristics. Procedure 1. Assess each standing or fallen live tree and standing dead tree selected and numbered for measurement in the variable- or fixed-radius plot for wildlife attributes, using the categories and codes listed below. 2. Record the appropriate codes on the Tree Details (TD) Card in the Wildlife Codes section. 3. Fallen dead trees are not assessed for wildlife tree attributes. 52 March 2018
69 VISUAL APPEARANCE Classify the visual appearance and record the appropriate code (1 to 9) using the shape of the tree stem as the dominant characteristic (Figure 4.6). Classes 1 and 2 can include dead trees, for example MPB red attack. CROWN CONDITION Figure 4.6- Visual Appearance Codes Examine the crown in relation to a normal live crown (lower crown loss due to self pruning is not included), this applies to both live trees and recently dead trees. Record code (1 to 7) from Table 4.4. Table 4.4 Crown condition codes. Code Description 1 All foliage, twigs, and branches present. 2 Some or all foliage lost, possibly some twigs lost, all branches usually present, possible broken top. 3 No foliage, up to 50% of twigs lost, most branches present, possible broken top. 4 No foliage or twigs, up to 50% of branches lost, top usually broken. 5 Most branches gone, some sound branch stubs remain, top broken. 6 No branches, some sound and rotting branch stubs, top broken. 7 No branches, minimum of rotting branch stubs, top broken. March
70 BARK RETENTION Classify the proportion of bark remaining, and code (1 to 7) from Table 4.5. Table Bark retention codes. Code Description 1 All bark present. 2 Bark lost on damaged areas only (<5% lost). 3 Most bark present, bare patches, some bark may be loose (5% 25% lost). 4 Bare sections, firm and loose bark remains (26% 50% lost). 5 Most bark gone, firm and loose bark remains (51% 75% lost). 6 Trace of bark remains (76% 99% lost). 7 No bark (100% lost). WOOD CONDITION Classify the wood texture (soundness) of the tree, and code (1 to 8) from Table 4.6. Table 4.6- Wood condition codes. Code Description 1 No decay. 2 Probable limited internal decay and/or deformities. 3 Limited decay, wood essentially hard. 4 Wood mostly hard but decay spreading, soft wood present. 5 Balance of hard and soft wood, spongy sections. 6 More soft and spongy wood than hard wood. 7 No more hard wood, all soft or spongy, powdery sections. 8 Hollow shell, outer wood mostly hard or firm. LICHEN LOADING Assess all live or dead, standing trees for lichen loading on the branches within 4.5 m of the ground or root collar. Assign a rating from 0 to 5 based on comparison with the appropriate set of photos contained in Estimating the Abundance of Arboreal Forage Lichens (Armleder et al. 1992). A value of 0 indicates no lichens, whether it is a live tree with branches and foliage or a dead tree. If a tree has lichens but none are below the 4.5 m mark, a rating of zero will be given. 54 March 2018
71 WILDLIFE USE Activity Record wildlife use as a two-part alpha code. When indicators or wildlife use of sampled trees is observed, record the following codes in the first field: Feeding (F_); Open nesting (O_); Cavity nesting (C_); Marking (M_); Denning (D_); Perching (P_). User If you can determine whether usage is by a mammal (_M), bird (_B), reptile (_R), or amphibian (_A), record it as a second code letter. For example, a feeding bird (FB), nesting amphibian (OA or CA), denning mammal (DM). If only the activity can be determined but not the responsible group, record only the first alpha code. FEEDING (F ) Feeding trees are very important to many wildlife tree users. Many woodpeckers feed on bark beetles; other birds glean insects from tree trunks, branches, and foliage; and hawks and eagles use trees as hunting and feeding perches. Record if feeding behaviour or indicators are observed. Indicators might include the following: 1. Pileated Woodpeckers excavate large rectangular feeding holes 2. Red-breasted and Yellow-bellied Sapsuckers drill horizontal patterns of sapwells 3. Three-toed and Black-backed Woodpeckers scale off bark to feed on insects 4. Porcupines gnaw on large sections of bark (diagonal tooth marks are often apparent) 5. Rabbits, hares, and squirrels feed on the base of young trees (squarish windows or girdling at the base) 6. Squirrel cone caches or basal accumulations of cone bracts from squirrel feeding NESTING (CAVITY NESTING C OR OPEN NESTING O ) 1. Record if evidence of cavity nesting (C ). Cavity nests might be difficult to detect, but their locations are predictable to some extent. Many woodpeckers (including Three-toed, Black-backed, Hairy and Pileated Woodpeckers, and flickers) prefer live hardwoods as nesting trees and often excavate their cavity underneath branches. Nuthatches and chickadees build their nests in brokenoff standing dead trees, or in broken branch holes, often directly below the breakage point where stem rots have entered the tree and softened the heartwood. Trees with cavity nests are important to retain because they may be used over many years by a variety of species. During the breeding season, the begging calls of nestlings are easy to detect. Test a tree with a cavity nest by carefully and safely striking it to determine if the nest is occupied. Cavity nesters have perfectly round or oval nest holes Pileated Woodpecker and the Common Flicker have oval holes due to their large size Downy Woodpeckers, Chickadees and Nuthatches have small round holes Brown Creepers have hammock nests under the loose bark Some ducks, owls, and squirrels nest in abandoned woodpecker holes March
72 2. Record if evidence of open nesting (O ). Raptors and herons build large platform-style stick nests. Open nests of eagles, hawks, owls, and herons are usually situated in the upper part or crown of live and dead trees. Many of these nests are used by the same or different pairs over many years; therefore, nest trees for open nesters have a very high habitat value. MARKING (M ) Record evidence of marking, such as claw marks by grizzly or black bears, and antler rubbing by deer or elk. These trees are used mostly for communication of territorial boundaries and during courtship. DENNING (D ) Record evidence of denning by bears, squirrels, bats, or other mammals. Other mammals that use wildlife trees for denning include marten, fisher, weasels, skunks, and racoons. Bears often hibernate in the hollow trunks of large standing trees, especially western redcedars. Entrances to tree dens can be basal or arboreal. Sometimes loggers discover dens while working; care should be taken not to destroy or injure the bears. PERCHING (P ) Perching and roosting trees are also essential habitat elements for wildlife tree users. Characteristic perch trees of aerial foraging and hawking birds have prominent dead branches that provide a good view of the surrounding area. Perching use may be observed, particularly on tall trees with good vantage, especially near riparian edges. Plucking spots where raptors feed are especially important. They can be identified by whitewash and the remains of prey in the vicinity. Roost trees are often in sheltered locations and have natural or excavated cavities. Roosts provide shelter from predators and inclement weather, some provide the environmental conditions appropriate for raising young. Roosting sites in trees include cavities, hollows, beneath bark, and in foliage. NOTHING OBSERVED ( ) Record if no wildlife use is evident or observed. 4.4 Assessing Damage Agents and Severity Note: The assessment of damage agents and loss indicators share some common elements but they are separate and distinct processes (perhaps recorded by separate people). Tree loss indicators are discussed in Section 4.5. The Vegetation Resources Inventory will sample for damage agents and severity on individual trees to provide an assessment of forest health. The sample will identify the agent or agents that cause the damage and quantify severity of the damage. The data is recorded on the Tree Loss Indicator (TL) field card. Damage agent types include abiotic, disease, insects, treatments, vegetation, and wildlife. The damage agent and severity information will be used to determine: causes of tree mortality related to damage agents; stand growth reductions related to damage agents; 56 March 2018
73 species succession as related to damage agents; incidence and extent of the damage agent conditions; relationships between vegetation (forest) cover and damage agent conditions, used to derive a BEC forest cover hazard and risk rating; forest level yield projection and planning procedures (such as stratification of data by damage type, damage intensity, or damage risk class); and the relationship between damage agent and estimation of sound (undecayed) wood volume as determined through the net factoring and hidden defect processes. Procedure 1. Assess damage agent(s) or conditions, and damage severity (ies) on all numbered trees, dead or alive, within the integrated plot. You will also assess new species occurring on the Auxiliary Plots. For stumps in the 2.50 metre fixed radius plot, assign a damage code for root diseases. Use the Field Guide To Pests of Managed Forests in British Columbia (Fink et al. 1989) to help identify damage agents and conditions. See Appendix C for damage agent codes, and Appendix D for damage severity and mortality condition codes and standards. 2. Record the damage agents for each tree on the Tree Loss Indicators (TL) Field Card. Use a 1-, 2-, or 3-letter code, depending on your confidence in the identification. The damage agent codes are hierarchical and enable coding from very general (type or category) to specific (species). The first letter indicates the type of damage agent: abiotic (A), disease (D), insect (I), mites (M), treatment (T), vegetation (V), and wildlife (W). The second and third letters indicate the specific agent, if it can be determined. For example, Armillaria root disease is coded DRA (D = disease, R = root rot, A = Armillaria). If unable to identify the specific disease, only that it is a root disease, record DR. If you cannot determine that it is a root disease, but you are certain it is a disease (not an insect or other damage agent), record D for disease. 3. When the tree has more than two damage agents, list at least the most important two damage agents on the TL card. If you wish to list more than two damage agents repeat the tree number on successive rows. 4. Record the damage severity using the codes listed in Appendix D: Damage Severity and Mortality Condition Codes and Standards. 5. Record the letter O if no damage agent is observed. 6. In many instances damage may be evident, such as forks and scars and the damage agent is not known. In these instances record a (U) in the damage agent fields. 4.5 Assessing Tree Loss Indicators Specific loss indicators signify the potential presence of decayed wood. The loss indicators (previously known as pathological indicators) to be measured are: conks, blind conks, frost cracks, scars, forks, crooks, large rotten branches, dead tops, root rot, soundings, direct observation, and broken tops. The specific indicator, its extent, and frequency are recorded on the TL field card. Rules and measurements are used to calculate the net factor (sound wood volume) of variable length logs. The inventory design for measurement and description of loss indicators attempts to adopt the traditional definitions and procedures of British Columbia and the Pacific Northwest March
74 wherever possible. The objective is to maintain a system that is compatible with current and past inventories, but will also meet future needs. The estimation of sound wood for each variable length log will be determined through the net factoring and hidden defect processes discussed in a separate section. Procedure 1. Record loss indicators for all live trees within the Integrated Plot and for new species occurring on the Auxiliary Plots. The collection of primary loss indicators, such as; stem decay, root decay, blind conk, frost cracks, soundings and direct observations for dead trees on the IPC plot is optional. Crews are to collect the significant indicators, especially those indicators that affect net factoring or call grading decisions. 2. Enter the appropriate code for the loss indicator (see Table 4.7 for codes and description). 3. Enter a + if the location of the loss indicator is above high side ground level or if below high side ground level. 4. Measure the position of each loss indicator on the stem of each numbered tree from ground level on the high side of the tree, to the nearest 0.1 m. Record the lower and upper extents as From To. 5. If an indicator is a point feature, such as a singular conk, record the location once under the From column with a frequency of If the indicator occurs more than once and is best described as a series, record the frequency as the number of times the loss indicator occurred in a particular interval. The maximum number of occurrences to record is 9. If there are more than 9 occurrences, still enter If it is necessary to record more than three loss indicator occurrences, list the tree number as often as required on the TL card. 8. Record multiple occurrences of loss indicators which do not have common causes as separate occurrences. The intent is to localize the loss indicator (for example a tree with basal scars from logging and a scar in the upper crown from a rubbing tree stem would be entered as separate occurrences). Note: Loss indicators are only recorded for the main stem on trees forked above DBH. 58 March 2018
75 Table 4.7 Loss indicator codes. Code DD DR BNK NGC SCA FRK CRO LRB DTP BTP SNG OTH DIR Description Unknown stem decay (conk) DDE is a known stem decay (Echinodontium tinctorium ) Unknown root decay DRA is a known root decay (Armillaria ostoyae) Blind Conk Frost Crack Scar Fork Crook Large Rotten Branch Dead Top Broken Top Sounding Other (cause is known, but no appropriate code) Direct observation (decay or missing wood seen without cause observed) LOSS INDICATOR STEM DECAY (DD _ ) AND ROOT DISEASE (DR _ ) Only specific root, butt, and heart-rot conks are considered to be loss indicators. Slash conks that occur on dead branches and wounds of living or dead trees are not considered as loss indicators. (Refer to Appendix C: Damage Agent Codes for stem decay and root disease conk codes.) Stem Decays (Conks) Observed on Bole (DD _ ) Conks refer to the fruiting bodies (sporophores) of stem decay fungi and are definite and reliable indicators of decay. Typically conks are thick, hard, woody-like perennial structures. Fruiting bodies can occur anywhere on the main stem and/or branches, but they appear most frequently around knots and on the underside of dead branch stubs and live branches. Record the following: 1. The code for the species of conk The loss indicator codes for conks are hierarchical. They are taken from the Forest Damage Agent and Condition Codes. The code identifies stem decay damage agents as DD_. The species of conk is then identified by the third letter. The codes for specific stem decays are shown in Appendix C. 2. Length to any single or isolated conk. The frequency is If multiple conks in one section of the stem, record: species of conk (should only be one species in each multiple occurrence) length to the lowest in the series; length to the highest March
76 frequency as to the number of conks in the series if conk series are widely separated record as two series Stem Decays (Root Rot) Observed on Roots or Ground (DR _ ) Root Rot refers to fruiting bodies which are located on the roots and are associated with stem decay. Typically fruiting bodies are short-lived, soft, and fragile. Often you may be able to see an indication of root rot decay directly on the roots. Schweinitzii butt rot (Phaeolus schweinitzii, DRS) is considered a root rot species, but the fruiting body may occasionally be observed on the main stem some distance above the ground (see Section 5.3 #2 for how to address this specific occurrence). Record the following: 1. The code for the species of root rot The loss indicator codes for root rots are hierarchical. They are taken from the Forest Damage Agent and Condition Codes. The code identifies stem decay damage agents as DR_. The species of conk is then identified by the third letter. The codes for specific root rots are shown in Appendix C. 2. Length for any single or isolated root rot indicator is recorded as 0 (ground level). The frequency is If multiple root rot indicators are observed, record: species of root rot (should only be one species in each multiple occurrence) length from 0 to 0 frequency of indicators in the series LOSS INDICATOR BLIND CONK (BNK) Blind conks are pronounced swellings or depressions around knots, usually caused by P. pini (DDP) on conifers, and P. tremulae (DDT) on aspen. Blind conks are definite indicators that decay is extensive in the tree stem. Evidence of conks should be found in the surrounding stand before recording blind conk as an indicator. Blind conks are identified as follows: stem swellings and stem depressions thought to be where the tree attempts to heal over decay emerging through a knot or branch stub. bright yellow to buff-coloured material found by chopping into basal branch stubs. This form is most often found in the interior of the province and crews will be directed by the project supervisor regarding procedures for chopping into trees. Note: Verifying the existence of blind conk is the only situation where we allow crews to chop into live trees on the plot. Record the following: 1. The loss indicator code BNK 2. For a single occurrence record: the length to blind conk the frequency as 1 60 March 2018
77 3. For multiple blind conks in one area of the stem, record: length to the lowest; length to the highest the frequency as the number in the series, including the lowest and highest LOSS INDICATOR FROST CRACK (NGC) Frost cracks result from deep radial splitting of the trunk, caused by uneven expansion of moisture in the tree after a sudden and pronounced drop in temperature. The cracks usually originate at the base of the trunk and may extend many metres up the tree, following the longitudinal grain of the tree. The wound will often spiral up the tree following the movement of moisture. Frost cracks are often reopened and extended by wind stresses or refreezing. Repeated healing of the cambium produces pronounced callous tissue, giving a ribbed appearance to the wound. Record the following: 1. The loss indicator code NGC 2. For a single frost crack, record: lowest extent (may be a negative value if it extends below ground on high-side) the highest extent. the frequency as 1 3. For multiple frost cracks on one section of the stem, record: lowest extent and highest extent of the series frequency as the number of frost cracks in the series LOSS INDICATOR SCAR (SCA) A scar is an injury caused by external forces that damage the cambium or heartwood of the tree exposing the tree to wood decay fungi. A scar can occur anywhere on the main stem or root collar of the tree. Scars on branches or candelabras are not recorded. A scar may be open meaning the wood is exposed, or closed meaning that the bark has grown over the injury. Record the following: 1. The loss indicator code SCA 2. For an individual scar record: lower extent of the scar (may be a negative number if it extends below ground on high side) upper extent of the scar the frequency as 1 3. For multiple scars along one section of the stem, record: lowest extent of the lowest scar in the series; highest extent of the highest scar frequency as to the number in the series March
78 LOSS INDICATOR FORK (FRK) A fork is caused by damage to the leader of a tree that results in more than one branch (leaders) competing for apical dominance. The damage to the leader from external forces, physiological factors, animals or insects (weevil) exposes the stem to potential wood or decay fungi. The following conditions are not considered forks: natural branching in deciduous trees small sharply angled branches or spikes, unless associated with a noticeable offset or diameter change at the location flattening of the tree tops caused by wind or physiological conditions where no terminal leaders are evident candelabra branches If the secondary leader is visible, record the following: 1. Loss indicator code FRK (no minimum size limit) 2. Location of fork (the divergence of the stems); frequency as 1 3. Distinct forks (record as separate occurrences) 4. Multiple forks within a reasonable range and a probable common cause (record upper and lower occurrence and number observed) LOSS INDICATOR CROOK (CRO) A crook is caused by damage (mechanical, physiological, animal or insect attack) to the leader of a tree. Crooks potentially expose the wood to decay fungi. To be recorded as a crook, it must meet the following conditions: The diameter of the main stem changes noticeably from the normal taper, and indicates that an injury has occurred. The stem must be offset severely enough to indicate that damage has occurred to the main stem. Record the following: 1. Loss indicator code CRO 2. For a single occurrence, record height of each individual crook frequency as 1 3. For multiple crooks in a section of the stem, record: length to the lowest crook; length to the highest frequency as the number of crooks LOSS INDICATOR LARGE ROTTEN BRANCH (LRB) Large rotten branches are defined as those with a diameter inside the bark greater than 10 cm at the base. They have obvious signs of heart rot, and typically appear as short, rotten branches on overmature trees. They should not be confused with branches that have died through normal causes. Record the following: 1. The loss indicator code LRB 62 March 2018
79 2. For a singular occurrence, record: the height to the central point of the branch frequency as 1 3. For multiple occurrences record: the length to the central point of the lowest branch in the series the length to the central point of the highest branch the frequency as the number in the series (including the highest and lowest) LOSS INDICATOR DEAD TOP (DTP) A dead top can be caused by any number of external injuries, physiological stresses, insects, or diseases. The top should be obviously dead with no green needles or leaves present. Record the following: 1. The loss indicator code DTP 2. Length to the base of the dead top (top of live crown), length to the top of the tree; frequency as 1 LOSS INDICATOR- BROKEN TOP (BTP) A broken top is the product of an external force or condition resulting in the top of the tree breaking away from the main bole. Broken tops can be caused by a variety of causes: wind breakage, snow damage, mechanical damage from other falling trees, and so on. Record the following: 1. The loss indicator code BTP 2. The length to the break (estimate by folding back any jagged parts of the stem to form a complete stem); frequency as 1 LOSS INDICATOR SOUNDING (SNG) Every tree on every plot is sounded. Sounding the tree involves striking the bole near the base of the tree with a blunt instrument. A hollow sound indicates a large amount of potential rot. Bore the tree to confirm the presence of rot. Record the following: 1. The loss indicator code SNG whenever the tree sounds hollow. If subsequent boring indicates no decay or decay is present, the SNG loss indicator code is left on the field card. Record in the comments section that no decay was found. 2. Frequency and length are not recorded LOSS INDICATOR OTHER (OTH) Sometimes rot or missing wood can be observed directly, and the cause is known. However, there is no appropriate loss indicator code. Examples of Other may be hollow trees, butt rot, or sap rot on a live tree. In all these examples the cause is known. Record the following: 1. Loss indicator code OTH In the Comments, state the reason for the loss March
80 2. Location and frequency, if appropriate Note: If this type of loss occurs frequently an appropriate code will be assigned in the future. LOSS INDICATOR DIRECT OBSERVATION (DIR) Sometimes rot or missing wood can be observed directly, but the cause is not known. An example of Direct Observation may be hollow trees where the cause is unknown. Record the following: 1. Loss indicator code DIR Make a comment in the Comments section if you think it is appropriate to do so. 2. Location and frequency, if appropriate Note: If this type of loss occurs frequently an appropriate code will be assigned in the future. 4.6 Stem Mapping All tree stems in the Integrated Tree Plot (variable radius) will be stem mapped to aid remeasurement and for research in stand structure stem distribution. Stem mapping of the trees on all fixed radius plots is optional on a project basis (and is measured and recorded at the point of germination). The stem mapping data is recorded on the TL field card. Procedure 1. Measure and record the azimuth from the Plot Centre Pin to the centerline of the tree at breast height (to the nearest degree). 2. Measure and record the horizontal distance from the Plot Centre Pin to the face of the tree at breast height (to 0.01 m). 4.7 Measuring Small Trees and Stumps Small Trees The fixed-radius plot size for measuring small trees will be one of 2.50m, 3.99m, or 5.64m. The plot size will be determined on a project specific basis and will remain the same for all samples in the project. The flexibility in plot size is to allow the project proponent the opportunity to collect additional small tree data in projects where that is deemed to be a high priority. A fixed-radius small-tree plot will be established at all Integrated Plot locations. The purpose of this plot is to establish relative numbers of small diameter live trees that are not otherwise sampled by the variable radius plot (or the 5.64 m fixed-radius large tree plot). The plot size is kept small to reduce measurement error. Measurements are recorded on the TS field card. Procedure 1. At the Integrated Plot Centre establish a fixed-radius plot that is either 2.50m, 3.99m or 5.64m in radius, as determined in the project plan. The edge of this plot may be marked temporarily to ensure accurate measurements. 64 March 2018
81 2. Count the live trees, less than 4.0 cm DBH and taller than 10 cm. Record the total number by species and by length class. Small trees must have their point of germination within the fixed plot radii to be measured as "in" trees. Note: The dot tally columns on the field card are provided for your convenience in recording. Sum the data by classes and record the totals on the field card. Species Example of small tree tally Length 10 to 29 cm 30 cm to 1.3 m > 1.3 m but < 4.0 DBH Cw Hw 9 6 Fdc 1 3 Dr Plots with Clumps of Trees or Sucker Growth from Stumps In some instances, particularly with deciduous species, clumps of stems originating from a common root system or stump that is vegetatively alive are encountered. Some or all of these stems could potentially grow into trees at some time in the future. The sampling intent is to identify the stems which express apical dominance to the best judgment of the field crew. Procedure 1. Count the number of stems that appear to express apical dominance. The intent is not to examine each stem in detail but to arrive at a reasonable assessment of numbers within each class. 2. If excessive numbers are encountered, procedures are available to split the plot. Plots with Excessive Trees If a plot contains numerous small live tree stems, the plot may be split in a half plot (or if necessary into a quarter plot) to maintain the necessary accuracy and decrease the effort. Procedure 1. Roughly estimate the number of stems to be tallied. If the preliminary estimate indicates more than 50 trees, then split the plot by the following method: Even plot number measure East half odd plot number measure west half record the plot as split by marking an X in the split box record the plot as half by marking an X in the half box 2. If the half plot still contains more than 50 trees, split the plot again into a quarter plot by the following method: EveN plot number NorthEast quadrant odd plot number southwest quadrant March
82 record the plot as split by marking an X in the split box record the plot as quarter by marking an X in the quarter box 3. In other situations where too large a plot would result in measurement error, the plot may be split. Stumps The Vegetation Resources Inventory is attempting to sample the biomass of above-ground vegetation both living and dead. This includes measuring the biomass in self-supporting stumps (defined as less than or equal to 1.3 m in length and 4.0 cm top diameter or greater) in the 2.50 m fixed-radius plot on the integrated plot. The centre of the stump must lie within the plot (Figure 4.7). Only stumps which are vegetatively dead are recorded. Stems greater than 1.3 m in length are measured as trees in the variable or fixed plot. Treat stumps with roots detached from the ground as coarse woody debris. Note: Do not split the stump plot for excessive numbers of stumps. Procedure 1. Select stumps to tally in the 2.50 m plot. Stump must be 4.0 cm top diameter inside bark with the germination point of the stump inside the plot boundary. 2. In a clockwise direction from the north, record the following information for all stumps 4.0 cm or greater: Species to the level that can be determined by the field crew. Frequency of stumps usually 1, but if numerous stumps are in the plot (such as after spacing) record them by groups with the same characteristics. Average diameter inside the bark. Length to nearest 0.1 m (must be less than 1.3 m). Estimate the percent sound wood for the stump. Wildlife codes bark retention code wood texture Wildlife use enter appropriate code(s) if wildlife use observed Root rot species if root rot is present, record the damage agent code (if no root rot is found, then record a dash). 66 March 2018
83 TALLY OUT Centre of stump outside plot A TALLY IN Plot Centre 2.5 m B Centre of stump in plot Figure 4.7- Measurement of "In" and "Out" Stumps 3. To measure the length of broken stumps, visually fold down the broken sections to compensate for the missing parts. Level out the wood on the cross section as you view it from the side to determine stem length (Figure 4.8). A similar process is used for broken tree length measurements. 1.4 m 0.9 m B A 1.3 m Estimated Length (1.1 m) Fold down shape A to fill missing shape B Figure 4.8- Measuring Height of Broken Stumps March
84 4.8 Recording Sample Tree Data Sample tree data is recorded on the Small Tree, Stump, and Sample Tree Data (TS) card and the Auxiliary Plot Tree Data (TA) card. Objective Sample trees are measured to determine age and height for the leading and second species in the cluster and can also be used as an estimate of site index. The main goal is for the sample trees to represent the main canopy of the stand. General Procedures The following types of trees are measured for age and height (length): Standard selection types: Top height (Type = T) in the 0.01 ha plot; of the trees that are live and dom/codom (regardless of species or residual status); the largest DBH tree Leading species (Type = L) in the 0.01 ha plot; of the trees that are of the leading species, live, and dom/codom; the largest DBH tree Second species (Type = S) in the 0.01 ha plot; of the trees that are of the second species, live, and dom/codom; the largest DBH tree Table 4.8 Guide for selection of sample trees Population Selection Criteria Tree Selection Criterion Type Plot Species L/D C.C. Age Suit. Ht Suit. Only 1 Consideration: T 5.64 m Plot Live D/C Largest DBH L 5.64 m Plot Leading Live D/C Largest DBH S 5.64 m Plot Second Live D/C Largest DBH O 5.64 m Plot Typically Live Typically D/C Typically Y Typically Y Subjective X Outside 5.64 m Plot Typically Live Typically D/C Typically Y Typically Y Subjective The T, and S, trees are selected and measured at the IPC only. The L trees are selected at the IPC and all auxiliary plots. The leading species and second species are determined from the basal area of the live trees equal to or greater than 4.0 cm DBH tallied within the plot cluster. The tree species with the greatest basal area is the leading species; similarly the species with the second largest basal area is the second leading species. On variable radius plots the stem count of the live trees tallied at the IPC large tree plot and auxiliary plots combined, times the BAF equals the basal area. If partial plots are used, then the count must be adjusted accordingly [for example a 1/2 plot with 3 cedar trees would be multiplied by 2 to have a value of 6 cedar trees when calculating the overall basal area distribution]. When fixed radius plots are used in conjunction with field cards an excel spreadsheet and a paper worksheet have been produced to calculate the basal area of all species in the field (see 68 March 2018

85 Appendix G - Calculating Basal areas in the Field). On fixed radius plots collected on electronic field data recorders the basal area calculations are performed within the program. It will be necessary to visit all auxiliary plots before the L and S trees can be properly selected. The leading species calculation box on the back of the TD card can be used to determine the species order (see Figure 4.9). In the case of a tie between two species, the species with the largest average diameter will be chosen. Figure Calculation Area for Leading Species Determination on Back of TD Field Card Note: Selected trees may be trees that are not tallied in the variable or fixed radius plot. Selected trees may be less than 4.0 cm. Selected trees may be on a portion of the plot not included in the large tree measurements (for example; the selected tree(s) may be on the 1/2 of a split plot not sampled by the large tree plot OR in the portion of a border plot outside of the polygon of interest). The sample tree plot is never split. All trees within the 5.64 metre radius have a chance of being selected. The following figure shows how the information is recorded (Fig. 4.10). Figure Recording of Height and Age Information on the TS and TA Field Card Non-standard selection types: Other (Type = O) an alternate tree in 0.01 ha plot X extra (Type = X) an alternate tree outside 0.01 ha plot March
86 These additional trees may be selected in a non-standard manner at the discretion of the field crew. This flexibility is provided for special cases where the field crew feels that adequate information cannot be provided following the standard procedure alone. For example, the cluster is located in a stand of recently killed trees or a tree is unsafe to measure. For this to be of any practical use, comments must be supplied to explain why the tree was selected. Suitability of Height and Age All sample trees must be assessed for suitability in two ways: 1) Height and age suitability (comparing the sample tree to other similar trees in the plot in terms of height and age) (note that residuals are always not suitable for age). 2) Site index suitability (determining if the sample tree will provide a reliable site index based on the SIBEC standard) First assessment: height and age suitability The intent of this assessment is to provide an indication of whether the sample tree generally reflects the height and age of the average plot tree in its cohort (i.e., other trees in the plot of the same species, crown class, diameter class, and age cohort). Examples of reasons for a tree not being suitable for height: significant broken top significant dead top fork or crook that significantly affects height growth abnormally high amount of scarring or other damage that may have affected height growth [for example - significant mistletoe infection] Note: Significant refers to a reduction in the length of the tree compared to what it would be if undamaged. This is a subjective assessment without any defined percent height loss requirement. If the sample tree appears shorter than the majority of the other plot trees from the same cohort (species, crown class, diameter class, general age), then it should be called not height suitable. The only reason for a tree not being suitable for age: residual (see the following definition) A residual tree is defined as a living remnant of a former stand; in even-aged stands, the occasional (< 25 per ha) large stem of an older age class than the stand as a whole. Typically these trees may have larger diameters, a higher incidence or indications of decay, thicker bark, larger branching and "ragged" or flat tops. These trees must be clearly residual. Uneven-aged stands do not generally have residual trees. Note: Advance regen can be a grey area between residual and non-residual status. Some guiding principles regarding advance regen are as follows. If advanced regen are 1) relatively abundant in the stand and distributed throughout, and/or 2) of a similar diameter and height to the rest of the trees in the stand, then they should not be considered to be residuals. They are simply a component of a mixed-age stand and will likely be managed as part of the same cohort as the younger trees. If one of these trees is selected as a sample tree, it will not be suitable for site index due to suppression in the core. 70 March 2018
87 A tree may meet the above selection criteria and still not provide a suitable age and/or height. The age and height are still recorded for T, L and S trees in these instances with an "N" placed in the appropriate column. L trees are never replaced even if they are not suitable for height and/or age. An explanation must be given in the comments section as to why the age and/or height are not suitable. The S/H (suitable for height) and S/A (suitable for age) columns are to be filled out for all T, L, and S trees selected. These columns indicate whether the age or height is suitable to be used in compiling age and height for the sample. In these columns, a "Y" means the item is suitable and an "N" means it is not suitable. Second assessment: site index suitability The intent of this assessment is to indicate if the sample tree will provide a reliable site index, using the SIBEC standard as the assessment tool. The requirements for the SIBEC tree selection standard must be met for the sample tree to be called suitable for site index (the SIBEC plot selection standard is not considered). To meet the SIBEC tree selection standard (in addition to the requirements meet to be the sample tree [live, dom/codom, largest DBH, etc.]), the sample tree must be: free of suppression; not wolf, open-grown, or residual; straight-stemmed, free of disease, rot, insect damage, and other significant damage including forks, scars, and breakage (minor damage is allowed but should not occur over more than 5% of total tree height); o temporary exemption: Lodgepole pine and ponderosa pine trees that are in the green- or red-phase of Mountain Pine Beetle (MPB) attack are suitable site trees. However, these trees must be in recently attacked stands (green- or red-phase) and still meet all the other requirements of a site tree; and vigourous with a full crown. Suppression will be exhibited in the increment core as a number of tight growth rings (at least 2-3) immediately around pith followed by better diameter growth release rings. Variation in ring widths and apparent release further out in the core (i.e, not immediately adjacent to pith) has no bearing on site index suitability. Assessing for a maximum total height loss of 5% can be subjective, but can be somewhat objectively assessed by comparing the sample tree to other trees in its cohort, and by looking for shorter than expected internodes above visible damage (when compared to undamaged internodal distances further above and below the damage). This becomes harder to accurately assess in older sample trees, as past damage and/or visible height loss can become overgrown and hidden. Note: The subset of sample trees that are assessed as suitable for site index can accurately be referred to as site trees (in addition to being a sample tree ). The age and height data may also be used for special purposes, such as ecological correlation studies. These studies may require additional screening for tree suitability. The screening will rely on the physiological age values, age prorate information, this site index suitability assessment, and additional crew comments to screen trees with rot, suppression, etc. March
88 Procedure for Selecting Top Height, Leading Species, and Second Species Trees The procedure outlined in this section describes the methods used to select and measure sample trees. 1. Complete the sample cluster using standard procedures. 2. Determine the leading and second species by basal area for the cluster using the tree count information 3. Establish a 0.01 hectare plot (5.64 m radius) at IPC and Auxiliary Plot centre(s). 4. Select sample trees in the 0.01 ha plot as follows: (a) at the IPC: T Tree: the largest DBH tree of the trees that are live and dom/codom (regardless of species or residual status) L Tree: the largest DBH tree of the trees that are of the leading species, live, and dom/codom S Tree: the largest DBH tree of the trees that are of the second species, live, and dom/codom (b) at each Auxiliary plot: L Tree: the largest DBH tree of the trees that are of the leading species, live, and dom/codom 5. Select additional dominant and co-dominant trees (if applicable) other tree in 0.01 plot (O tree) extra tree outside 0.01 plot (X tree) 6. Measure and record tree height for each selected tree. measure and record the length of the tree along the stem from high side ground. If the tree is broken off, measure and record the length to the break. determine suitability for height and enter code in S/H column. If the height is not suitable record in the comments the factor(s) which makes the height not suitable and if possible estimate a projected height. 7. Measure age and radial increment for each selected tree. determine suitability for age and enter code in S/A column Note: T, L and S tree data will always be collected regardless of suitability. Measuring Height, Age, and Growth Information Age is an important measurement in cruising because it helps in determining the age of the stand, site index and projected rate of growth. In each Integrated Plot a top height tree, a leading species tree, and a second species tree will be bored to determine age. Leading species trees are measured in Auxiliary Plots. 72 March 2018
89 Procedure for Direct Measurement of DBH Age 1. Count the whorls above DBH and add one to calculate the age of the tree. Enter the code WHO Record the age 2. Rather than damaging a small tree on the plot, select a tree of similar apparent age from outside the plot. This would frequently happen with trees of less than 2 m in length. The replacement tree should be outside the 10 m fixed-radius plot, if possible. Determine the DBH age by cutting or boring. Enter the code OUT Record the length and diameter for the originally selected top height tree, but record the age from the tree selected from outside the plot. 3. In instances where trees do not reach DBH, use either of the above procedures, as appropriate. Enter the code as appropriate (WHO or OUT) Record the total age for the tree Record bored height as 0.0 Procedure for Measuring Age on Bored Trees 1. Bore the tree at DBH facing plot centre, if possible. If DBH cannot be bored conveniently, record the height of boring; corrections will be made later. 2. Determine the age by a ring count from an increment borer core, if possible, and enter the data in the field count section on the tally card. The count will be the number of full rings. It is up to the field crew to determine when diameter growth has essentially stopped for the season. 3. The pith should be included in sample tree cores as often as possible to ensure accuracy, particularly in stands less than 80 years old. If you can get within a few years of the pith (relative to the tree age) and can confidently estimate the remainder, there is no need to re-bore the tree or use a physiological age calculation. Record the actual age counted on the increment borer core at the level where the tree was bored. Adjustments for years to reach that point will be done in the office compilation. 4. On large trees, or trees that have rotten centres, record the code for rot, age of the sound portion, and the length of sound core. The computer will calculate an approximate age using these measurements. Be careful to measure only inside bark length along the core. Note: Age relationships can also be derived from actual stump counts if working near felled road rights-of-way or logged areas. 5. Collect all tree cores in labeled straws and return to the field office. It is the crew s responsibility to accurately record field age data. The initial determination will be made in the field and confirmed in the field office based on the straw samples. The project manager will have the microscope age counts entered in the office count sections on the field cards. The office count will add any estimate of additional years from the end of the increment borer core to the pith of the tree. Record at least the following on the straw in waterproof felt marker or on attached labels: Sample Number, Plot (for example, IPC, N.AUX.), tree type (T, S, R) and tree number (for example, Sample 27, IPC, TH, Tree #3). March
90 Procedure for Measuring Bark Thickness The measurement of bark thickness is a combination of the actual bark on the tree plus the distance to the diameter tape. The intent is to determine the actual firmwood volume over a sample of trees. Bark thickness measurement is only required on sample trees where the measure code is PHY, ROT or CRC. 1. Make bark thickness measurements on all trees counted for age at the same level on the stem. 2. Take the measurement on the side facing the plot centre, at DBH if possible. 3. When it is not practical to take the measurement in this direction, take it at two points on opposite sides of the tree (at the same height as the age boring) and average them. 4. Measure the bark thickness at the ridges of bark as touched by the diameter tape. Do not chop bark windows to take the measurements. The use of increment borer cores for measuring bark thickness is discouraged as they tend to compress the bark resulting in inaccurate measurements. A small bark window such as cut with a knife is preferred; paint the hole when measurements are completed. Procedure for Measuring Radial Increments The collection of physiological age information is optional for VRI projects. The information is currently not used in the ground sampling inventory analysis process. Individual projects may collect the information if a need is determined. 1. Make radial increment measurements on all trees counted for age at the same level on the stem. 2. Bore on the side facing the plot centre, at DBH if possible. 3. When it is not practical to take the increment in this direction, take it at two points at right angles on the bole of the tree (at the same height as the age boring) and average them. 4. Record the radial increment (in mm) for 5, 10, and 20 years using full rings. Procedure for Measuring Physiological Age The collection of physiological age information is optional for VRI projects. The information is currently not used in the ground sampling inventory analysis process. Individual projects may collect the information if a need is determined. 1. If a sample tree for age measurement was suppressed in its early years, record the unsuppressed (physiological) age as calculated for that tree. The intent is to give an age that would be typical for the tree size if the tree had not undergone unusual suppression (or, more rarely, unusual growth). 2. Determine the physiological age as follows: Enter the PHY code to indicate that a physiological age is used. The computer will calculate the age for you if you have not entered the age yourself. For small trees, where you can interpolate accurately across the suppressed section, simply count equivalent rings. For larger trees, particularly where centre sections are missing, leave the boring height age blank, and: 74 March 2018
91 Count the number of years along the section closest to the bark. As with small trees, account for any clearly atypical growth sections by interpolation. Enter the length of the core over which you have counted the partial age. The computer will use this data to calculate the missing rings. If you have a good estimate of the tree age it would also be useful to have that in the notes section. Recording Height, Age, and Growth Information See Section 4.2, Identifying and Recording Tree Attributes, for a complete description of codes. The following details are recorded on the TS field card: TREE NO. Tree number as recorded in tree measurement plot. If not present in the tree measurement plot, assign a number (99, 98...) to indicate that it is not in the large tree plot. TYPE T = top height tree, L = Leading species, S = second species, O = alternate tree in 0.01 ha plot; X = alternate tree outside 0.01 ha plot. SPECIES Tree species code. CROWN CLASS (C. CL.) Record crown class code (D, C, I, S). BORING (OB) DIAMETER (cm) Diameter outside bark at location of increment boring. TREE LENGTH (m) Measured length of the tree to 0.1 m. SUITABLE HEIGHT Record a Y for yes if the tree height has not been significantly affected and is suitable for calculating a reliable site index estimate. Record a N for no of the tree height has been significantly affected. BARK THICKNESS (mm) Single Bark thickness at location of boring(s). Required only on trees where the Measure Code is ROT, CRC or PHY. BORED HEIGHT (m) Height (above high side ground level) where boring was made. MEASURE CODE If the crew did not physically measure to the pith, this code indicates the reason. Acceptable codes are: ROT = Core of tree rotten or missing. WHO = Total age determined from whorl count rather than boring. CRC = Increment borer cannot reach centre (tree too large). OUT = Age and radial increments determined from similar tree outside of plot, all other measurements for the tree within the plot. PHY = Physiological age is recorded or calculated on that tree. Usually due to atypical growth ring patterns. FIELD AGE COUNT Repeat the Tree No. For each type, and record the actual age (number of rings) at boring height in the lower-left corner of the card. OFFICE BORED HEIGHT AGE Increment cores are recounted in the office under magnification. Enter the recounted age in this data field. GROWTH (mm) Growth for last 5, 10, and 20 years. PRORATE DATA When a full boring is not possible record the actual measurements. LENGTH (CM) Length of increment core, from outer edge inward, upon which the ring count was made. RING COUNT Actual or representative count of tree rings along that core length. DIRECT AGE CORRECTION Number of full years of tree growth below the boring height, if it can be determined directly on that tree. March

92 PHYSIOLOGICAL AGE SUITABLE AGE Physiological age at the bored height determined by the crew. Record PHY in Measure Code field. It is not always necessary to enter this information. Optional for VRI projects. If the tree is a Residual then the tree is recorded as N for not suitable. All other trees are recorded as Y for yes as suitable for age. Examples of Recording Age Information 1. Normal tree where the increment borer can reach the tree pith (enter - in the Measure Code field) Bark Pith Counted Age = 96 Years. Count to last complete growth ring under bark 2. Tree with rotten or missing core (ROT) Figure Recording Age for Full Boring Bark Rotten or Missing Ring Count = 81 Years. Length = 17.2cm Figure Recording Age for Tree with Missing Core (Rot) 76 March 2018

93 3. Trees where increment borer cannot reach centre of the tree (CRC) Bark Ring count = 213 years. Length = 32.0cm Figure Recording of Age for Partial Boring (CRC) March

 can be cut down and counted, or bored.")

94 4. Out-of-plot tree taken for sample age (OUT) If the selected sample trees are too small to be bored without damaging the tree, or the length of the plot trees is less than 2 m, a representative tree of the same species from outside the plot (outside the 10.0 m plot at the Integrated Plot Centre) can be cut down and counted, or bored. The preference in young stands (less than 2 m in height) would be to count the age as close as practical to the ground. Figure Recording Age for Out-of-Plot Tree 5. Tree age determined directly from count of branch whorls (WHO) Figure Recording Age Using Whorl Count 78 March 2018
 Bark Non-suppressed growth Suppressed growth Pith Ring count = 47 years. Length = 20.3cm Ring count = 76 years. Figure 4.16- Recording Physiological Age 4.")
95 6. Physiological Age Measurement (code as PHY) Calculation of physiological age: 1. non-suppressed growth rate (47 years 20.0 cm = 2.35 years/cm) 2. physiological age (2.35 years/cm X 25.0 cm = 59 years) Bark Non-suppressed growth Suppressed growth Pith Ring count = 47 years. Length = 20.3cm Ring count = 76 years. Figure Recording Physiological Age 4.9 Recording Auxiliary Plot Measurements The Auxiliary Plots will be used to supplement the information collected on the Integrated Plot. Record the data on the Auxiliary Plot Card (TA). Record the following data (and nothing more) on a variable-radius plot (or 5.64 m fixedradius plot) for live and dead trees 4.0 cm DBH and larger: tree number tree species tree status code (Record L or D) standing trees only (Record S) tree diameter (DBH) measured or estimated DBH tree length measured or estimated tree length crown class broken top (BTP) loss indicator (if present) broken top diameter or projected height (if BTP present) New Species and Additional Data (if needed) 1. Randomly select the new species tree from the sample trees on that plot when a new species (not measured on the Integrated Plot TD card) is encountered on the Auxiliary Plots in the following order, North, East, South, and West. Note that when an Auxiliary March
96 plot has been replaced according to section 3.2.1, the order that should be considered for new species is clockwise from North, according to the plots as they are actually installed in the field. See Section for examples. 2. For live standing trees that are a new species (not measured on the Integrated Plot or any previous Auxiliary Plots), take the same measurements as on the Integrated Plot in trees. Enhancement is the common term used to describe the process where detailed measurements are taken on the selected tree. 3. For dead standing (or dead fallen trees if they are being collected on the project) trees that are a new species (not measured on the Integrated Plot or any previous Auxiliary Plots), take the same measurements as on the Integrated Plot in trees. A dead tree of a given species is considered a new species if only a live tree of that species has been encountered previously. Note: The intent is to have live and dead measured sample trees for all species in order to calculate volume to basal area ratio (V-BAR) values. Therefore if a tree of a particular species has not been previously encountered, it will be measured in detail on the Auxiliary Plots. The tree sampled will be randomly selected from the trees of that species on the Auxiliary Plot. Leading Species Tree 1. On the standard fixed-radius (5.64 m) plot, select a leading species tree. 2. Record the same information (with the same techniques and format) as was gathered for the Integrated Plot leading species tree. At present, no top height or second species tree is chosen on the Auxiliary Plots. 3. There is no replacement of the leading species tree even if it is deemed to be unsuitable. Record suitability for height and age as per the IPC plot. Sampling and Enhancement of VRI Ground Samples for NVAF The purpose of sampling and enhancement of the VRI ground samples is to tally a large set of trees for Net Volume Adjustment Factor (NVAF) sample tree selection purposes and to collect (enhancement) a set of tree attributes to allow for the estimation of net tree volume. Sampling and enhancement for NVAF involves: 1. Enhancement of tallied trees in the auxiliary plots of VRI phase 2 sample clusters, or 2. Establishment of auxiliary plots from CMI samples and the enhancement of their tallied trees. NVAF and the VRI Phase 2 Sample Cluster For the subset of regular Phase 2 cluster that have been selected for NVAF sampling, there are two departures from the regular VRI sampling procedures: 1. The tallying and enhancement of all standing trees with a DBH >= 12.5 cm. The standard suite of VRI tree attributes will be recorded for all tallied trees. 2. The collection of extra attributes describing tree conditions and general sample conditions to aid the stem analysis phase. These extra attributes are described below. 80 March 2018
97 List of Extra Tree and Sample Attributes to Record The non standard VRI attribute to collect is comments about individual trees on their extreme unsuitability as NVAF sample trees which would include the following: Major wildlife use, which includes eagle nests, bear dens and the like. Unsafe tree conditions that would imperil the faller. Site conditions that would prevent the tree once felled from being sampled, which include trees above bluffs and waterways. Additional site and stand conditions, collected by the sampler, will facilitate the work of the destructive sampling crew. Useful information, in the form of comments, include descriptions of the general site conditions for the walk in and in and around the sample plots: Falling difficulty Sample access Terrain Brush Windfall and slash Literature Cited Armleder, Harold M., Susan K. Stevenson, and Stephen D. Walker Estimating the Abundance of Arboreal Forage Lichens. Land Management Handbook Field Guide Insert 7. B.C. Ministry of Forests. Fink, K. E., P. Humphreys, and G. Hawkins Field Guide To Pests of Managed Forests in British Columbia. B.C. Ministry of Forests, Victoria, B.C. FRDA Publication 16, ISSN Ministry of Forests, B.C. Environment Field Manual for Describing Terrestrial Ecosystems. Draft for 1996 field season. March
98
99 5. Net Factoring Introduction This section outlines the steps needed to assess the net volume of trees on the Integrated Sample Plot. Call grading and net factoring are processes used to assess timber quality and net tree volume. They are applied to the tree as the cruiser sees it. No attempt is made to predict grade based on falling breakage or any manufacturing process, or to predict volume loss without direct evidence. The two processes are related but will be presented separately for presentation ease. Objectives To provide a rule-based estimate of net tree volume. Definitions Net Factoring involves estimating the net volume of sound wood (gross volume less decay) of variable log lengths. These net volumes are based on: (1) direct measurements (includes visual estimates and physical measurements); or (2) standard, rule-based deductions associated with loss indicators. The net factoring process is based on only making allowances for decay on consistently measurable or detectable features. Some trees will contain decay but will not have any visible symptoms. These hidden decay losses will be determined through a separate sampling process. Pencil bucking is the imaginary sectioning of trees into potential logs. General Procedures Standard rule-based deductions will be used to determine the extent of the defect and the calculation of the net factor (% sound wood). Pencil bucking is used to identify grade changes in a tree and to localize where the net factor (% sound wood) is applied. Pencil bucking is the imaginary sectioning of trees into potential logs. Net factoring is for sound wood loss only (decay or missing wood). No additional deductions are made for anticipated breakage, manufacturing loss, or splits and fractures. When calculating log volumes the diameter of the log will be the DBH when dealing with the bottom log, or will be estimated at the midpoint of the log when dealing with upper sections of the tree. This may be slightly different than with some of the scaling conventions. March
100 Field Cards for this Section Tree Details (TD) (Appendix A, Figures A.11 and A.12) log grades, lengths, % sound Tree Loss Indicators (TL) (Appendix A, Figure A.13) damage agent, severity, loss indicator, location, frequency Auxiliary Plot Card (TA) (Appendix A, Figures A.15 and A.16) trees on Auxiliary Plots Detailed Procedures 5.1 Net Factoring Procedures All trees in the Integrated Plot and new species found in the Auxiliary Plots will have net factors calculated for each log. 1. Complete the tree loss indicators information prior to the net factor process. 2. In conjunction with the grading rules, determine the applicable log lengths for each tree. 3. Using measurements and rule-based deductions, calculate the net volume (net factor) for each log section. 4. Where loss indicators are located on the tree below high side ground or extend below high side ground, consider the application as if the indicator was in the first log length. For example, a frost crack that extends from minus 0.5 m to plus 1.5 m is calculated as a 2 m frost crack with losses applied to the first log. Similarly a root rot conk present on the ground is applied to the first log length. 5. Measure all volume calculations from high side ground. 6. Since net factoring is a priority when major defects exist it is desirable that the defect be isolated as a log. If this process creates a unrealistic description of the tree, incorporate the defect into a longer log. 7. Unobserved decay will be deducted as a hidden factor, derived through a separate sampling process. 8. Assign a net factor to each log graded. If the log has no major defects, and you detect no measurable sound wood loss, the net factor is 100%, recorded as two dashes (- -). Note that volume deductions (net factoring), by log, will only be made where: a loss indicator is present, such as conk, frost crack, or blind conk decayed or missing wood is visible such as open scars, sap rot sounding of the stem indicates decay, and subsequent boring provides a relative decay ratio root rot is observed 84 March 2018
101 5.2 Calculating Volume In assessing the percent deduction of a log, you will need to calculate volumes. Logs are considered cylindrical, and depending on the type of defect, the decayed portion is considered to be rectangular (such as scars), cylindrical (such as conks), or conical (such as butt rot). The following conventions and formulas shown in Table 5.1 will be used in the calculations. Diameter: length of a straight line passing through the centre of a circle. Radius: line extending from the centre of a circle to the circumference (½ diameter). L = length; W = width; D = depth; R = radius; = 3.14 (to 2 decimal places). Table 5.1 Formula for calculating volume. Shape Formula Rectangular solid Volume = L * W * D Cylinder Volume = R 2 * L Cone Volume = (1/3) R 2 * L Units must be consistent (all cm or all m). 5.3 Applying Deduction Rules Table 5.2 Summary of procedures for determining net factor for loss indicators. Defect Form Method Deduction area % Sound of Deduction Area Grade 1. Heart Rot Conk (DD_) Cylindrical Rule 4 m above conk 6 m below conk 50% Y 2. Root rot (DR_) Conical Rule 3 m 81% assigned* 3. Blind Conk (BNK) Cylindrical Rule 4 m above conk 6 m below conk 50% Y 4. Frost crack (NGC) Other Rule extent of frost crack calculated assigned* 5. Scar (SCA) Rectangular Calculate extent of scar calculated assigned* 6. Cat face (SCA) Conical Calculate extent of scar calculated assigned* 7. Fork (FRK) Other Rule if decay present: 1 m below 8. Crook (CRO) Other Rule if decay present: 1 m below 50% Y 50% Y 9. Rotten branch (LRB) Cylindrical Rule 1 m above 1 m below 50% Y 10. Dead top (DTP) Other Calculate live crown to top of tree 11. Broken top (BTP) Other Rule broken off portion remaining stem 1.0 m of decay below break, only if rot is visible at the break calculated assigned* N assigned* March
102 Defect Form Method Deduction area % Sound of Deduction Area Grade 12. Sounding (SNG) Other Calculate various calculated assigned* 13. Direct Observation (DIR) Other Rules various calculated assigned* 14. Other (OTH) Other Rules various calculated assigned* * Assigned by cruiser in the field 1. HEART ROT CONK (DD _) Inventory conventions assume that conk rot extends 4 m above the conk and 6 m below it. This is normally a 10 m Y grade log with a net factor of 50%. For example, an H grade tree with a conk at 12 m could be graded H grade for 6 m, Y for 10 m (net factor 50%), then H grade again starting 4 m above the conk. The rule for heart rot conk is as follows: Table 5.3 Deduction rule for Heart Rot Conk. Form Method Deduction area Cylindrical Rule % Sound of deduction area (net factor) 50% Grade 4 m above conk; 6 m below Y For multiple conks, where the lengths between conks are less than the 10 m minimum, decay is assumed to extend 4 m above the top conk and 6 m below the lowest conk. The length is given a net factor of 50% and a grade of Y. If you can measure more severe decay, pencil buck the affected portion and grade it a Y with a greater net factor. This is done in at least 1 m increments. Note: Other major defects, such as frost cracks associated with conk, can be assumed to be cylindrical in nature as well, with the same net factor and grade. 2. ROOT ROT (DR_ ) All root rots are assumed to be conical in nature. Unless otherwise observed, the inventory convention is that the cone of rot extends 3 m from the ground and that the ratio of the diameter of the rot to the diameter of the butt is 75% (¾). The deduction (for the 3 m section) is a constant, with the net factor always equal to 81% for that section. 86 March 2018
103 The rule for root rot is as follows: Table 5.4 Deduction rule for Root Rot. Form Method Deduction area Conical Rule 0 3 m % Sound of deduction area (net factor) 81% Grade Assigned Note that if a Schweinitzii butt rot (Phaeolus schweinitzii, DRS) fruiting body is observed above the ground on the main stem, then the rule is modified slightly: the first log should extend from the ground to 3 m above the highest DRS fruiting body, the standard net factor of 81% still applies, but additionally, the grade is an automatic X, due to a grade consideration of 2 m loss for every 3 m of log (33%). Formula volume of log volume of decay Net Factor % = * 100 % volume of log Shortcut Formula Since the relative size of the defect is constant, the decayed percentage for the first 3 m is a constant of 19%. The simple form of the equation is: Net Factor % = 100% - 19% * length of decay log length Table Example of Net Factor Calculation for Root Rot EXAMPLE Log length: 8 m; Rot extends: 3 m Since the relative size of the defect is constant, the decayed percentage for the first 3 m is always 19%. Net Factor = 100% - 19% * 3 8 = 100%-(19% * 0.35) = 100% - 7% = 93% Note: An alternate net factor calculation to the one describe above is to apply a standard 0.6 m length deduction [based on: (3.0 m rot section 0.6 m length deduction) / 3.0 m log = 80%]. March
104 3. BLIND CONK (BNK) Interior and transition zones: typically bright orange rot is visible when knots are cut open. Coastal zone: typically excessive swelling of the bole or a collapsed bole. The rule for blind conk is as follows: Table 5.6 Deduction rule for Blind Conk Form Method Deduction area % Sound of deduction area (net factor) 50% Grade 4. FROST CRACK (NGC) The rule for frost crack is as follows: Cylindrical Rule same as conk 4 m above conk; 6 m below Y Table 5.7 Deduction rule for Frost Crack. Form Method Deduction area % Sound of deduction area (net factor) Grade Other Rule Pencil buck at top and bottom of the series of frost cracks. Sum of frost crack length(s)/log length * 10%. Maximum deduction 40% (Net factor would be 60% sound). Assigned Note: Frost crack(s) that run across the grain of the log, may result in a lower grade. This would be due to the percent of merchantable lumber volume loss, rather than the percent of sound wood loss. EXAMPLE log length: 12 m; Two frost cracks are located as follows: 6 m long (from 0 m to 6 m) 8 m long (from 4 m to 12 m) Deduction = Σ crack lengths log length * 10% 88 March 2018
105 12 m log Frost Crack #1 (4 m to 12 m) length = 8 m Frost Crack #2 (0 m to 6 m) length = 6 m Calculation of Net Loss Factor Net Loss = Σ crack lengths log length * 10% 8+6 * 10% 12 = = 12% volume loss Figure 5.1- Example of net factor calculation for Frost Cracks. 5. SCAR (SCA) The rule for scar is as follows: Table Deduction rule for Scar. Form Rectangular Method Calculate Deduction area Extent of scar % Sound of deduction area (net factor) Calculated Grade Assigned Indicator is present and rot or missing wood is evident. Calculate the net factor using one of the following two methods, depending on whether or not the depth of rot can be measured. Method 1: When depth of rot can be measured (for example, butt scars) Assume the scar is rectangular: Decay volume = length * width * depth Assume the log is cylindrical (diameter DBH for butt logs, midpoint for other logs): Log volume = * radius 2 * length March
106 Formula volume of log volume of decay Net Factor % = * 100 % volume of log Note: To have a net factor less than 90% is rare for a scar. EXAMPLE log length: 10 m; diameter: 100 cm scar: length 10 m, width 20 cm, depth 10 cm 1. Volume of Decay = L * W * D (volume of rectangle) = 10 m * 0.2 m * 0.1 m = 0.2 m 3 2. Volume of Log = R 2 L (volume of cylinder) = * (0.5 m) 2 * 10 m = 3.14 * 0.25 m 2 * 10 m = 7.8 m 3 3. Net Factor = = = 97% * 100% * 100% Figure Example of Net Factor Calculation for Scar with known Depth METHOD 2: WHEN DEPTH OF ROT CANNOT BE MEASURED 1. Estimate width and measure length of scar on log 2. Calculate circumference of log at the scar ( * D) 3. Calculate decay length deduction = ½ width of scar circumference of log * scar length 90 March 2018
107 4. Net Factor = volume of log volume of decay Net Factor % = * 100 % volume of log EXAMPLE log length: 10 m; diameter: 60 cm; scar 6 m in length, 20 cm wide Decay Length = ½ width of scar circumference of log * scar length = ½ 20cm 3.14 * 60cm * 6m = 0.32 m Net Factor = length of log decay length length of log * 100% = 10m 0.32m 10m * 100% = 97% 60 cm Half of wedge is assumed to be decayed 10 m Length 6 m Scar 20 cm Figure Example of Net Factor Calculation for Scar with Unknown Depth March
108 6. CAT FACE (SCA) The rule for cat face is as follows: Table 5.9 Deduction rule for Cat Face. Form Cylindrical/Conical Method Calculate Deduction area Extent of Scar % Sound of deduction area (net factor) Calculated Grade Assigned Cat face is a scar (SCA) or missing section of wood that allows measurement of decayed or missing wood. There are two methods of dealing with this form of internal decay, depending on whether the associated heart rot is cylindrical or conical in nature, and that decision must be made by the cruiser on-site. 92 March 2018
109 Method 1: Formula for Cylindrical Defect volume of log volume of decay Net Factor % = volume of log *100 % Shortcut Cylindrical Formula length of decay (radius of decay) 2 * log length Net Factor % = 1 - *100% (radius of log) 2 EXAMPLE Cylindrical Defect Log length: 10 m; Cylindrical cat face for 6.0 m Sound wood = 20 cm (solid outer ring of wood) Diameter = 200 cm (radius = 100 cm [1.0 m]) Net Factor = 6m (0.80m) 2 * 10m 1 - * 100% (1.0m) 2 = [1 (0.384)] * 100% = 62% 10 m log length 6 m decay length 20 cm solid shell 160 cm decay 200 cm total diameter Figure Example of Net Factor Calculation for Cat Face (Cylindrical Defect) March
110 Method 2: Formula for Conical Defect volume of log volume of decay Net Factor % = volume of log *100 % Shortcut Conical Formula 1 length of decay Net Factor % = 1-3 * (radius of decay) 2 * log length *100% (radius of log) 2 Conical cat face for 5.0 m of 8.0 m log EXAMPLE (Conical) defect length not equal to log length Sound wood 20 cm (solid outside radius, therefore 80 cm defective core) Diameter = 200 cm (radius = 1.0 m) Net Factor = = 1 5m 1-3 * (0.8m) 2 * 8m *100% (1m) * 0.64 * *100% 1 = [1 (0.13)] * 100% = 87% 8 m log length 5 m decaylength 80% of diameter Figure Example of Net Factor Calculation for Cat Face (Conical Depth) 94 March 2018
111 Method 3: Uses table 5.9, butt rot guide for length deductions 1. Find the ratio 2. Use Butt Rot table for ratio of butt rot. Note: diameter of decay DBH to develop consistency in the net factoring process individuals should not interpret between the butt rot ratios. Determine the nearest ratio and apply the selected value. 3. Express length deduction as percentage of log length. Another option of conical defect associated with butt rot is to use the butt rot guide for length deductions. Butt rot is generally included with the log for its maximum grade length. However, if the rot lowers the grade of the butt log, take a short log (minimum 3 m) and assign a grade and net factor to that short log. The Butt Rot Guide (Table 5.9) gives the conical butt rot ratios by log length. Note that the net factor may determine the grade, based on the percent lumber recovery or other grade requirements. Deductions and grade considerations are based on rot/dbh ratio. Calculate the ratio to the nearest ¼ diameter, determine the deduction from the table below, and reduce the log volume by the deduction. Table 5.10 Butt Rot guide for length deductions. Ratio Length Deduction Grade Consideration* ¼ diameter m 0.2 m 0.6 m ½ diameter m 0.4 m 1.8 m ¾ diameter m 1.2 m 3.6 m 4/4 diameter 7.2 m 2.4 m 4.2 m *Grade consideration describes how much of a piece will not produce lumber. EXAMPLE The butt rot length is not visible, therefore we need a process to determine deduction length. Rot diameter = 55 cm; DBH = 102 cm; log length = 10 m Ratio = diameter of decay DBH Using the table, butt rot extends from 3.6 m to 4.2 m, and the deduction is 0.4 m length. Net Factor = = 96% = = 1 approximately 2 * 100 % Figure Example of Net Factor Calculation for Cat Face (Using Butt Rot Table) March
112 7. FORK (FRK) In most cases, the position of the fork will signify a change of grade. If the fork is major, both in size and impact on grade, it may be pencil bucked out in 1 m lengths with a grade of Y assigned to that section and a net factor of 100%. If decay is visible the rules for fork are as follows: Table 5.11 Deduction rule for Fork. Form Method Deduction area Other Rule % Sound of deduction area (net factor) 50% Grade 8. CROOK (CRO) 1 m below In most cases, the position of the crook will signify a change of grade. If the position of the crook will result in a change of grade, both in size and impact on grade, it may be pencil bucked out in 1 m lengths with a grade of Y assigned to that section and a net factor of 100%. If decay is visible the rules for crook are as follows: Table 5.12 Deduction rule for Crook. Form Method Deduction area Y Other Rule % Sound of deduction area (net factor) 50% Grade 9. ROTTEN BRANCH (LRB) 1 m below Larger rotten branches/knots ( 10 cm inside bark) are a significant indicator of cylindrical rot. The rule for rotten branches is as follows: Table 5.13 Deduction rule for Rotten Branch. Form Method Deduction area Y Cylindrical Rule % Sound of deduction area (net factor) 50% Grade 1 m above the rotten branch; 1 m below Y Note: For multiple, overlapping rotten branches/knots (less than 2 m apart), deduction extends 1 m above and below the series. 96 March 2018
113 10. DEAD TOPS (DTP) (Broken tops are handled separately.) Dead tops are usually associated with sap rot, but rot must be visible before a net factor can be applied. The rule for dead tops is as follows: Table 5.14 Deduction rule for Dead Tops. Form Method Deduction area Other Calculate % Sound of deduction area (net factor) Calculated Grade From top of live crown to tree length Assigned Note: Dry checked wood may affect grade, but will not affect the sound wood content (net factor). Sap rot depth is to be estimated at the midpoint of the dead top. Formula volume of sound cone Net Factor % = volume of cone * 100 % Shortcut Formula 2 radius of sound wood Net Factor % = radius of log * 100 % Midpoint diameter 20 cm (10 cm radius) EXAMPLE 2 cm depth of sap rot (giving 8 cm radius of sound wood) 2 8cm Net Factor % = 10cm * 100 % = 64% Figure 5.7 Example of Net Factor Calculation for Dead Tops March
114 11. BROKEN (MISSING) TOPS (BTP) The tree is graded and net factored normally to the broken top (pencil buck at the break). The missing portion is graded as N and net factored as 00 (no sound wood). Table 5.15 Deduction rule for Broken Tops. Form Method Deduction area Other Rule from break to original top % Sound of deduction area (net factor) 00 = no sound wood Grade N (nothing) Broken tops, particularly on hemlock and balsam, are usually associated with rot, but rot must be observed on the stem (or broken top if it is on the ground nearby) before a net factor can be applied. Rot associated with logs below the broken top is assumed to run 1 m below the break. Table 5.16 Deduction rule for Rot Associated with Broken Tops. Form Method Deduction area Other Rule % Sound of deduction area (net factor) 00 Grade 1 m below the break Y Formula last log length 1.0m Net Factor % = last log length * 100 % EXAMPLE Last log length is 10 m up to a broken top 10m 1.0m Net Factor % = 10m * 100 % = 90% Figure Example of Net Factor Calculation for Broken Tops 98 March 2018
115 12. SOUNDING FOR DECAYED OR MISSING WOOD (SNG) Sound all measured trees in the Integrated Plot and new species on the Auxiliary Plots. Only if the tree gives a hollow sound, bore the tree with an increment borer on the side facing the plot centre and record the loss indicator SNG. Even if the boring does not reveal any decay, the SNG code is still left as recorded. Decay discovered by boring will not be used for net factoring except in the case of sounded trees. For instance, discovering decay by boring a top height tree, which did not sound hollow, would not result in a deduction. Measure the sound wood. Determine the ratio of decay to tree DBH. If there are no other indicators, assume that the rot is conical in nature and apply the deduction in Table 5.9 Butt Rot Guide for Length Deductions. 13. DIRECT OBSERVATION (DIR) Sometimes rot or missing wood can be observed directly without, but the cause is not known. The rule for direct observation is as follows: Table 5.17 Deduction rule for Direct Observation. Form Method Deduction area Other Rules Various % Sound of deduction area (net factor) Calculated Grade 14. OTHER (OTH) Assigned Sometimes rot or missing wood can be observed directly, and the cause is known. However, there is no appropriate loss indicator code. The rule for Other is as follows: Table 5.18 Deduction rule for Other. Form Method Deduction area Other Rules Various % Sound of deduction area (net factor) Calculated Grade Assigned March
116 15. MULTIPLE DEFECTS In general, the assignment of net factors to trees with multiple defects is left to the professional judgment of the cruiser, based on the net factoring procedures discussed here. However, several concepts should be noted: Net factors less than 50% will only occur with severe: cylindrical butt rot sap rot missing wood Severe frost cracks/scars associated with conk on the lower bole can be assumed to be connected and treated as cylindrical rot, with a net factor of 50%. Sound sections 3 m or longer between defects can be treated as separate logs. Sound sections less than 3 m are incorporated with the log section above or below. 100 March 2018
 = 20 m Log Length ( from 6 m 28 m) = 22 m Conk Deduction 50% ( of 20 m ) = 10 m Grade (all 3 sections) = Y Net Factor = Net Factor = length of log length of deduction 22m")
117 EXAMPLE of isolated section between defects Conk at 12 m and 24 m. This creates a 2 m section between the defect areas, so we can combine all three sections into one log. Deduction length = 2 (6 + 4) = 20 m Log Length ( from 6 m 28 m) = 22 m Conk Deduction 50% ( of 20 m ) = 10 m Grade (all 3 sections) = Y Net Factor = Net Factor = length of log length of deduction 22m 10m 22m length of log * 100 % * 100 % = 54.5% Record as 55% Note: The same procedure should be used whenever grade is assigned, particularly for butt rot and/or cat face. Conk Rule Decay Length Log Length 28m Conk at 24m +4m 10m 18m -6m 2m sound 22m Conk at 12m 16m 6m +4m -6m 10m Note: If the upper conk were at 25 m, it would create a 3 m log between the two defects. This log would be treated as a separate sound log with its own grade. This would create three separate logs, each with its own grade and net factor (a more detailed description of the tree). Figure Example of isolated sections between defects. March
118
119 6. Call Grading Introduction This section outlines the steps needed to assess the quality of measured trees. Objectives To provide a rule-based estimate of tree quality. Definitions Call grading is the procedure used to assign one of the Vegetation Resources Inventory (VRI) grades (modified coastal log grades) to standing and fallen timber. Grading is a hierarchical process. The grade extends up the tree as long as the grade rules allow. When a knot or other defect is encountered or the diameter can no longer support that grade, the grade changes for the next portion of the tree. Some trees are too small to meet the minimum log sizes for VRI grades. These small trees are assigned a small-tree grade developed for use in the Vegetation Resources Inventory. Variable length call grading recognizes only a minimum length (see Section 6.1) and allows the cruiser to pencil buck (the imaginary sectioning of a portion of the tree) at grade changes rather than at predetermined log lengths. General Procedures The cruiser will be able to grade the log into at least the correct major category. The major categories are lumber, peeler, sawlog, shingle, and utility chipper. VRI grades are assigned to logs based on size, quality, and soundwood recoverability. Grades are assigned using the hierarchy of VRI grades. Start at the highest grade in the hierarchy. If the log cannot meet that grade, move to the next in the list until the grade can be met. A log cannot be one grade or another, it can be only one grade. It is not a choice of market preference, current harvesting practices, accessibility, or other factors. A log is the highest grade it qualifies for within the hierarchy. Grades are assigned to ALL trees (live or dead, standing or fallen) selected within the integrated plot. Grades must also be assigned to all enhanced trees in auxiliary plots. Small trees are assigned a small tree grade developed for use in the Vegetation Resources Inventory. Grade consideration is applied by the cruiser to determine the percentage of soundwood available for manufacturing. It includes deductions for rot, missing wood and surface characteristics as well as wood unavailable due to defect shape or characteristics. Grade consideration must be taken into account for butt rot, checks, insect/bird holes and twist. The grade consideration due to butt rot is shown in Table 6.2 below. For example, a sawlog (H-grade) fir log that is 8 m long and has a 45 cm top and severe butt rot (3/4 ratio): March
120 o Net factor = (8.0 m - 1.2m)/8.0 m = 85% (this alone would result in an H-grade, but then grade consideration must be calculated) o Grade consideration = 3.6 m = (8.0 m m)/8.0 m = 55% o Therefore it is an X-grade since it does not meet the minimum lumber percentage criteria for an H-, I-, J-, or U-grades. Field Cards for this Section Tree Details (TD) (Appendix A, Figures A.11 and A.12) Log grades, lengths, % sound Tree Loss Indicators (TL) (Appendix A, Figure A.13) Damage agent, severity, loss indicator, location, frequency Auxiliary Plot Card (TA) (Appendix A, Figures A.15 and A.16) Trees on Auxiliary Plots Detailed Procedures 6.1 Call Grading Procedures For standing or Fallen Trees, Live or Dead 1. Measure all log lengths from the high-side ground level. 2. Determine the highest grade the bottom log would satisfy, based on grading rules and characteristics of the minimum log lengths for that species. Table 6.1 Minimum log lengths (in m) by grade and species (highest grade at left). Category Lumber Peeler Sawlog Shingle Utility Chipper GRADES [D,F,G] [B,C] [H I J] [K L M] [U X Y] Douglas-fir Cedar Hemlock Balsam (Abies) Spruce Pine/Larch Cypress/Yew Deciduous - 5* Act is the only deciduous species that can have a peeler grade. 3. Add to that log in 1-metre increments until the top diameter of the log (measured as diameter inside bark [DIB]) or the log quality results in a grade change. Maintain that log grade as long as possible if the next grade would be a lower one in the hierarchy. 104 March 2018
121 Change the grade as soon as possible if the next log grade would be a higher one in the hierarchy. 4. Record the grade and the length. For example, an H grade 16 m log is H Follow the same procedure for the next log up the tree. 6. The last grade on the tree will normally be carried to the top of the tree and 99 recorded (except when top of tree is broken off), regardless of utilization limits (applies to grades J, U, X, Y). Do not attempt to grade the top log based on top diameter or on the fact that it may be a short log due to utilization top diameter. 7. For grading in immature stands where the first log is a J and the quality of the remaining stem is similar, call the whole tree J (J99). Similarly for grades U, X, and Y. 8. If the tree has certain defects (such as excessive butt rot, fork, conk, rotten branches) you may want to isolate for grading those portions of the tree. For Broken or Cut Stems If the stem is over 1.3 m tall, grade and net factor it like any other tree with a broken top. The stem will have to be graded on its length and recoverability (usually it will be an X or Y grade). If the length is less than 1.3 m it is a stump or CWD, not a tree. Stumps are measured in the 2.50 m plot and are not graded. CWD is measured on the line transect and is not graded. The missing or unconnected portion is always graded as N For Small Trees Trees that do not meet the minimum log size of 5 m to a 10 cm top diameter (U grade) are assigned a small tree grade developed for use in the Vegetation Resources Inventory. Assign a single grade to the entire tree, using the following codes: P Pretty good Straight and good form. Well spaced/distributed knots or branches. Q Questionable Slight sinuosity, minor crooks, and so on Small knots R Reject Major sinuosity or deformity. Large knots/uneven distribution of knots or branches Note: For broken top trees, record the small tree grade to the break, and record N to the broken-off portion. Dead trees are assessed on their condition at the time of the survey. For example a dead tree with straight and good form with no checking could still be graded as a P grade. Trees with very minor checking could be Q grade if they meet the other grade criteria. Trees with moderate to severe checking should be graded as R grade. March
122 6.2 Grading Conventions and Guidelines Conventions Trees with conk or blind conk will have the affected portion graded as Y grade. The last grade on the tree will normally be carried to the top of the tree and is coded as 99 regardless of utilization limits (this applies to J,U,X,Y and small tree grades). If the top of the tree is broken off (missing), the missing portion is graded as N (Nothing) and net factored as 00 (0% sound wood). Guidelines 1. HEART ROT Conk, blind conk, and rotten branches have specific lengths and grades applied. Conk Y 4 m above, 6 m below, 50% sound Blind Conk Y 4 m above, 6 m below, 50% sound (like conk) Rotten Branch Y 1 m above, 1 m below, 50% sound Scars Severe cylindrical cat face should be pencil bucked at the top of the cat face, with that length and net factor used to determine the grade. 2. BUTT ROT Refer to the Butt Rot Guide for Length Deductions table. Note that the net factor may determine the grade, based on the % lumber recovery or other grade requirements. The table also provides a guide for grade considerations, which is how much of the piece will not produce lumber. Best practice is to isolate butt rot in a short log if it is 2/4 or more; but if there is only ¼ butt rot, best practice is to extend the bottom log to allow for a higher grade (as opposed to pencil bucking a very short valueless X-grade log. Table 6.2 Butt rot guide for length deductions. Ratio Length Deduction Grade Consideration* ¼ diameter m 0.2 m 0.6 m ½ diameter m 0.4 m 1.8 m ¾ diameter m 1.2 m 3.6 m 4/4 diameter 7.2 m 2.4 m 4.2 m *Grade consideration describes how much of a piece will not produce lumber. 106 March 2018
123 3. FROST CRACKS Pencil buck at the top of the frost crack(s) for log length. Assign a percentage loss (based on 10% per frost crack, if they run the length of the log) with a maximum total deduction of 40% (net factor of 60%). Note: The angle, position, or net factor will determine the appropriate grade based on % lumber recovery and/or % merchantable. 4. OCCASIONAL LARGER KNOTS (OLK) All sawlog grades (H, I, J, U and X grades) can have occasional larger knots (OLK's). Occasional larger knots are allowed to the extent of one per 3 metres of log length [two per 3 metres for X grade logs over 50 centimetres top diameter] and must be located where knot sizes for portions of the logs are specified. For example, if a grade requirement allows 4 cm knots over the entire log, then occasional larger knots can be anywhere on the log. Where the requirement allows larger knots on a portion of the log then the occasional larger knots must be within this portion only. 5. SUN CHECKS AND/OR INSECT DAMAGE A check is a separation of the wood, at right angles to the annular rings that runs through the heart of the log. There is no soundwood deduction for sun checks or insect damage. Grade considerations, particularly % lumber, are applied. No soundwood deduction for sun checks or insect damage. Formula for Grade Consideration Calculation of Sound % Lumber πr 2 % Recovered = * 100 % πr 2 where r = radius of sawable lumber portion, and R = radius of tree March
124 EXAMPLE Diameter = 50 cm; Radius of tree (R) = 25 cm; Sun check = 5 cm Radius of sawable lumber portion (r) = 20 cm Whole tree is sun checked Checked wood 25 cm 20 cm 5 cm 50 cm πr 2 % Recovered = * 100 % πr 2 r 2 = * 100 % R = * 100 % OR * 100 % 50 2 (These give the same mathematical result.) = 64% lumber recovery The appropriate grade is X (J grade would require 75% lumber; U grade would require 66% lumber). Figure Example of Grade Calculation for Sun Checked Logs 108 March 2018
125 6. TWIST There is no soundwood deduction for twist. Grade considerations, however, are applied. The amount of twist is measured along 30 cm at the mid-point of the log. The percentage of twist is calculated by dividing this amount by the diameter at the top of the log. With the exception of J grade, there are maximums of both of these values, as shown below. Twist must be less than both of these restrictions. For example, a D grade must deviate by no more than 6 cm over the 30 cm distance, and the deviation divided by the top diameter must be no more than 4%. The displacement of twist over 30 cm is also observed. Twist comprises two factors: percentage of top diameter; and maximum displacement over 30 cm. Table 6.3 shows the maximum values for specific grades. If the parameters are not met, the next lower grade applies. Table 6.3 Maximum twist displacement by grade. Grades % of top diameter Maximum displacement (over 30 cm) Lumber D, F, G 4% 6 cm Peeler B, C 7% 8 cm Sawlog H 7% 8 cm Sawlog I 10% 9 cm Sawlog J 10% No limit Utility U, X 13% 13 cm Note: Waterline to waterline (180 degree twist) over 2 m is automatically Y grade. If twist only appears on a portion of a tree it should be pencil bucked out with the appropriate grade, length, and net factor applied. Calculations Estimated top DIB: 60 cm for log section Severe twist 8 cm (along 30 cm section) EXAMPLE 1 % twist = (8 cm twist)/(60 cm top) * 100% = 13% This log is graded as U, since this is the first grade met in the hierarchy (other defects may lower the grade further). March
126 Calculations Estimated top DIB 25 cm for log section Minor twist, 2 cm displacement EXAMPLE 2 % twist = (2 cm twist)/(25 cm top) * 100% = 8% This log is graded as J, since this is the first grade met in the hierarchy. Figure Examples of Grade Calculation for Twist 7. CEDAR SHINGLE CRITERIA Cedar will not be graded as a shingle if it can make a sawlog grade. If a log, due to heart rot or butt rot, has less than 75% soundwood, but meets slab thickness requirement for that grade, the log becomes shingle grade. If logs are unsuitable for lumber manufacture due to, shape (heavy fluting), heart rot (less than 75 % lumber), or splits (creating triangular or U shaped slabs), but otherwise meet the grade criteria, then: initial grade D grade F grade H/I grade 8. SURFACE CLEAR changes to K grade L grade M grade Logs which are free of knots and knot indicators are valued for use in specialty forest products, such as window and door stock. A typical log grade criteria will be written as 90% surface clear. In application this indicates 10% of the log may have knots or knot indicators on any surface [from the top of the log] with the remaining 90% of the log being clear of knots or knot indicators. Similarly, a log grade that requires 80% surface clear may have 20% of the log with knots or knot indicators on any surface [from the top of the log] with the remaining 80% of the log being clear of knots or knot indicators. 110 March 2018
127 6.3 Inventory Call Grading Criteria Fir/Pine/Larch Grades and Grade Requirements Table 6.4 Fir/Pine/Larch Grades and Grade Requirements. D GRADE Min. top diameter inside bark Min. log length 76 cm 5 m Min. percentage lumber 75% Min. percentage clear lumber 50% Max. twist over 30 cm of length Grade Requirements Knots Rot 4% of top diameter, Max. deviation 6 cm Fir/Pine/Larch 90% surface clear, with well-spaced knots or knot indicators permitted on the upper 10% of two sides of the log or upper 20% of one side of the log only. No conk permitted. Rot permitted, provided 75% lumber attained. F GRADE Min. top diameter inside bark Min. log length 60 cm 5 m Min. percentage lumber 75% Min. percentage clear lumber 25% Max. twist over 30 cm of length Grade Requirements Knots Rot 4% of top diameter, Max. deviation 6 cm Fir/Pine/Larch Logs cm must have 75% surface clear, with well-spaced knots or knot indicators permitted on the upper 25% of two sides of the log or upper 50% of one side of the log only. Logs 76 cm or greater must have 50% surface clear, with well-spaced knots or knot indicators permitted on the upper 25% of two sides of the log or upper 75% of one side of the log only. No conk permitted. Rot permitted, provided 75% lumber attained. March
128 B GRADE (Fir only) Fir/Pine/Larch Min. top diameter inside bark 60 cm Min. log length 5 m Min. percentage veneer 80% Maximum twist over 30 cm of length 7% of top diameter, Max. deviation 8 cm Grade Requirements Knots Rot Misc. No knots or bunch knots over 4 cm are permitted. Logs cm top diameter must have the lower 2.6 m free of knots or knot indicators. Logs 76 cm top diameter must have the lower 2.6 m free of knots. Knot indicators are permitted. No conk rot permitted. No butt rot permitted. No butt rot in adjacent log permitted Sap rot permitted to 4% of top diameter or 5 cm in depth. No splits permitted. Sun checks or insect holes permitted to a depth of 4% of top diameter or to a maximum of 5 cm in depth. Sweep is not permitted. Crook is not permitted. Burls are permitted to 1 burl per 2.6 m of log length. C GRADE (Fir only) Fir/Pine/Larch Min. top diameter 38 cm Min. log length 5 m Min. percentage veneer 80% Max. twist over 30 cm of length 7% of top diameter, Max. deviation 8 cm Grade Requirements Knots Rot Misc. No knots or bunch knots over 4 cm are permitted. No conk permitted. No butt rot permitted. No butt rot in adjacent log permitted Sap rot: For logs < 50 cm top diameter, none is permitted. For logs 50 cm top diameter, permitted up to 4% of the top diameter, and a maximum of 5 cm actual depth. No splits permitted. Sun checks or insect holes: For logs < 50 cm top diameter, none is permitted. For logs 50 cm top diameter, permitted up to 4% of the top diameter, and a maximum of 5 cm actual depth. Sweep is not permitted. Crook is not permitted. Burls are permitted (1 burl per 2.6 m of log length). 112 March 2018
129 H GRADE Min. top diameter Min. log length Min. lumber percentage: Logs 38 cm top diameter Logs 50 cm top diameter 38 cm 5 m 75% 50% Fir/Pine/Larch Min. merchantable percentage 65% Max. twist over 30 cm of length 7% of top diameter, Max. deviation 8 cm Grade Requirements Knots Rot Misc cm top diameter: 4 cm knots over the entire log OR 5 cm knots over the upper 50% of the log, with knots 2 cm in diameter permitted over the lower 50% of the log. 50 cm top diameter: 4 cm knots over the entire log OR 5 cm knots over the upper % of the log* OR 8 cm knots over the upper 50% of the log* (* with knots 2 cm in diameter permitted over the lower portion of the log). Occasional larger knots (OLKs) are permitted, to 1 per 3 metres. Permitted provided percentage lumber is maintained. No insect holes penetrating the sapwood permitted. I GRADE Min. top diameter Min. log length Min. lumber percentage: Logs 38 cm top diameter Logs 50 cm top diameter Logs cm top diameter (former H log quality) 38 cm 4 m 75% 50% 50% Fir/Pine/Larch Min. merchantable percentage 50% OR former H log quality cm top diameter Max. twist over 30 cm of length 65% 10% of top diameter, Max. deviation 9 cm Grade Requirements Knots cm top diameter 8 cm cm top diameter 9 cm 76 cm top diameter 10 cm Occasional larger knots (OLKs) are permitted, to 1 per 3 metres. Rot Permitted, provided 75% percentage lumber is attained. March
130 J GRADE (same for all Coniferous species) Fir/Pine/Larch Min. top diameter 16 cm * Max. top diameter Min. log length 36 cm 5 m Min. lumber percentage 75% Min. merchantable percentage 50% Max. twist over 30 cm of length 10% of top diameter * Refer to grading procedure, item 6, Section 6.1 for variance to this diameter limit. Grade Requirements Knots cm top diameter 4 cm cm top diameter 6 cm Occasional larger knots (OLKs) are permitted, to 1 per 3 metres. Rot Permitted provided 75% lumber is attained. U GRADE (same for all Coniferous species) Min. top diameter 10 cm * Min. log length Min. lumber percentage: cm top diameter cm top diameter 38 cm top diameter 5 m 75% % 50% Min. merchantable percentage 35% Max. twist over 30 cm of length 13%, Max. deviation 13 cm * Refer to grading procedure, item 6, Section 6.1 for variance to this diameter limit. Grade Requirements Knots cm top diameter 4 cm cm top diameter cm top diameter cm top diameter cm top diameter 76 cm top diameter 6 cm 8 cm 10 cm 12 cm 14 cm Occasional larger knots (OLKs) are permitted, to 1 per 3 metres Fir/Pine/Larch Rot Permitted provided percentage lumber is attained. 114 March 2018
131 X GRADE (same for all Coniferous species) Min. top diameter 10 cm * Min. log length 3 m Fir/Pine/Larch Min. lumber percentage % Min. merchantable percentage 35% Max. twist over 30 cm of length 13% Max. deviation 13 cm * Refer to grading procedure, item 6, Section 6.1 for variance to this diameter limit. Grade Requirements Knots Rot Same as U Grade cm top diameter cm top diameter cm top diameter cm top diameter cm top diameter 76 cm top diameter 4 cm 6 cm 8 cm 10 cm 12 cm 14 cm Occasional larger knots (OLKs) are permitted, to 1 per 3 metres for logs 50cm. Logs 50 cm may have oversize knots up to a maximum of 2 per 3 m of log length Permitted provided 33 1 / 3% lumber is attained. Y GRADE (same for all Coniferous species) Lower than X grade. Fir/Pine/Larch March
132 Cedar Grades and Grade Requirements Table 6.5 Cedar Grades and Grade Requirements. D GRADE Logs Min. top diameter 60 cm Min. length 5 m Min. percentage lumber cm top diameter 75% Cedar 120 cm top diameter % Min. percentage clear lumber 50% Max. twist over 30 cm of length Slabs Min. top diameter 50 cm Min. thickness Min. length 4%, Max. deviation 6 cm 38 cm 5 m Min. percentage lumber 75% Min. percentage clear lumber 50% Max. twist over 30 cm of length Grade Requirements Knots Rot Misc. 4%, Max. deviation 6 cm cm top diameter, 75% surface clear*, with well spaced knots or knot indicators permitted on the upper 25% of two sides or on the upper 50% of one side of the log length only. 76 cm top diameter, % surface clear, with well spaced knots or knot indicators permitted on the upper % of one side or on the upper % of one side of the log length only. Rot permitted provided percentage lumber is met. D quality logs with < 75% lumber OR if > 120 cm with less than % lumber become K shingle 116 March 2018
133 F GRADE Logs Min. top diameter 50 cm Min. length 5 m Min. percentage lumber 75% Min. percentage clear 25% Max. twist over 30 cm of length 4%, Max. deviation 6 cm Slabs Min. top diameter 50 cm Min. length 5 m Min. thickness 38 cm Min. percentage lumber 75% Min. percentage clear 25% Max. twist over 30 cm of length 4%, Max. deviation 6 cm Grade Requirements Knots Rot Misc cm top diameter, must be surface clear of knots or knot indicators cm top diameter, % surface clear with well spaced knots or knot indicators permitted on the upper 33 1 / 3% of two sides or on the upper % of one side of the log length only. 76 cm top diameter, 50% surface clear with well spaced knots or knot indicators permitted on the upper 50% of two sides or on the upper 75% of one side of the log length only. Permitted provided 75% lumber is attained. F quality logs with < 75% lumber become L shingle Cedar H GRADE Min. top diameter 38 cm Min. length 5 m Min. percentage lumber 75% Min. percentage clear 65% Max. twist over 30 cm of length 7%, Max. deviation 8 cm Grade Requirements Knots Rot Misc cm top diameter: 4 cm knots over the entire log OR 5 cm knots over the upper 50% of the log (with knots 2 cm in diameter permitted over the lower 50% of the log). 50 cm top diameter: 4 cm knots over the entire log OR 5 cm knots over the upper % of the log* OR 8 cm knots over the upper 50% of the log* (*knots 2 cm in diameter permitted over the lower portion of the log). Occasional larger knots (OLKs) are permitted, to 1 per 3 metres. Rot permitted, provided 75% lumber is attained. H quality logs with < 75% lumber become M shingle provided clear requirements can be met. Cedar March
134 I GRADE Min. top diameter Min. log length 4 m top diameter 38 cm OR Logs 10 m in length top diameter 50 cm OR 38 cm 75% L 50% M 50% L 50% M Logs 10 m in length top diameter 38 cm 50% L 65% M Otherwise H Grade Max. twist over 30 cm of length Grade Requirements 10%, Max. deviation 9 cm Knots cm top diameter 8 cm cm top diameter 9 cm 76 cm top diameter 10 cm Occasional larger knots (OLKs) are permitted, to 1 per 3 metres. Rot Misc. Permitted provided percentage lumber is attained. I quality logs with < 75% lumber become M shingle provided clear requirements can be met. Cedar J GRADE (same for all Coniferous species) Min. top diameter Max. top diameter Min. log length 16 cm* 36 cm 5 m Min. lumber percentage 75% Min. merchantable percentage 50% Max. twist over 30 cm of length 10% of top diameter *Refer to grading procedure, item 6, Section 6.1 for variance to this diameter limit. Grade Requirements Knots cm top diameter 4 cm cm top diameter 6 cm Occasional larger knots (OLKs) are permitted, to 1 per 3 metres. Rot Permitted provided 75% lumber is attained. Cedar 118 March 2018
135 K GRADE Logs Min. top diameter 50 cm Min. log length 4 m Min. percentage shingle or shakes 50% Min. percentage clear shingle or shakes 75% Max. twist over 30 cm of length 4%, Max. deviation 6 cm Slabs Min. top diameter 50 cm Min. thickness 38 cm Min. log length 4 m Min. percentage shingle or shakes 50% Min. percentage clear shingle or shakes 75% Max. twist over 30 cm of length 4%, Max. deviation 6 cm Grade Requirements Knots Rot Cedar cm top diameter, must be surface clear of knots or knot indicators cm top diameter, 75% surface clear with knots or knot indicators permitted on the upper 25% of two sides or the upper 50% of one side of the log length only. 76 cm top diameter, % surface clear with knots or knot indicators permitted on the upper % of two sides or the upper % of one side of the log length only. Rot permitted provided 50% shingles or shake is attained. Note: D quality logs with < 75% lumber ( 120 cm top diameter with < % lumber) become K shingle. L GRADE Cedar Logs Min. top diameter 38 cm Min. log length 4 m Min. percentage shingle or shakes 50% Min. percentage clear shingle or shakes 50% Max. twist over 30 cm of length 7%, Max. deviation 8 cm Slabs Min. top diameter 38 cm Min. thickness 26 cm Min. log length 4 m Min. percentage shingle or shakes 50% Min. percentage clear shingle or shakes 50% Max. twist over 30 cm of length 7%, Max. deviation 8 cm Grade Requirements Knots 50% surface clear, with knots permitted on the upper 50% of two sides or all of one side of the log length only. Rot Rot permitted provided 50% shingle or shakes is attained. Note: F quality logs with < 75% lumber become L shingle. March
136 M GRADE Logs Min. top diameter 38 cm Min. log length 4 m Min. percentage shingles 50% Min. percentage clear shingles 25% Max. twist over 30 cm of length 7%, Max. deviation 8 cm Slabs Min. top diameter 26 cm Min. thickness 16 cm Min. log length 4 m Min. percentage shingles 50% Min. percentage clear shingles 25% Max. twist over 30 cm of length 7%, Max. deviation 8 cm Grade Requirements Knots 25% surface clear. Rot Rot permitted provided 50% shingle or shakes is attained. Cedar U GRADE (same for all Coniferous species) Min. top diameter Min. log length Min. lumber percentage: cm top diameter cm top diameter 38 cm top diameter 10 cm* 5 m 75% % 50% Min. merchantable percentage 35% Max. twist over 30 cm of length 13%, Max. deviation 13 cm *Refer to grading procedure, item 6, Section 6.1 for variance to this diameter limit. Grade Requirements Knots cm top diameter 4 cm cm top diameter 6 cm Rot cm top diameter 8 cm cm top diameter 10 cm cm top diameter 12 cm 76 cm top diameter 14 cm Occasional larger knots (OLKs) are permitted, to 1 per 3 metres Permitted provided percentage lumber is attained. Cedar 120 March 2018
137 X GRADE (same for all Coniferous species) Min. top diameter 10 cm* Min. log length 3 m Cedar Min. lumber percentage % Min. merchantable percentage 35% Max. twist over 30 cm of length 13%, Max. deviation 13 cm *Refer to grading procedure, item 6, Section 6.1 for variance to this diameter limit. Grade Requirements Knots cm top diameter 4 cm cm top diameter 6 cm cm top diameter 8 cm cm top diameter 10 cm cm top diameter 12 cm 76 cm top diameter 14 cm Rot Occasional larger knots (OLKs) are permitted, to 1 per 3 metres for logs 50cm. Logs 50 cm may have oversize knots up to a maximum of 2 per 3 m of log length Permitted provided % lumber is attained. Y GRADE (same for all Coniferous species) Cedar Lower than X grade. March
138 Hemlock/Balsam Grades and Grade Requirements Table 6.6 Hemlock/Balsam Grades and Grade Requirements. D GRADE Min. top diameter Min. log length 66 cm 5 m Min. percentage lumber 75% Min. percentage clear 50% Max. twist over 30 cm of length Grade Requirements Knots Rot 4%, Max. deviation 6 cm Hemlock/Balsam cm top diameter, must be 90% surface clear with well spaced knots or knot indicators permitted on the upper 10% of two sides or on the upper 20% of one side of the log length only. 76 cm top diameter, must be 80% surface clear with well spaced knots or knot indicators permitted on the upper 20% of two sides or on the upper 40% of one side of the log length only. No conk permitted. Rot permitted, provided 75% lumber is attained. Rot in balsam must be confined to centre 10% of log. F GRADE Min. top diameter Min. log length 50 cm 5 m Min. percentage lumber 75% Min. percentage clear lumber 25% Max. twist over 30 cm of length Grade Requirements Knots Rot 4%, Max. deviation 6 cm Hemlock/Balsam cm top diameter, must be 75% surface clear with knots or knot indicators permitted on the upper 25% of two sides or on the upper 50% of one side of the log length only. Logs 66 cm top diameter, must be 50% surface clear with knots or knot indicators permitted on the upper 50% of two sides or on the upper 75% of one side of the log length only. No conk or blind conk permitted. Rot permitted, provided 75% lumber is attained. 122 March 2018
139 H GRADE Min. top diameter Min. log length Logs 38 cm top diameter Logs 50 cm top diameter Former D or F grade Max. twist over 30 cm of length Grade Requirements 38 cm 5 m 75% lumber 65% merchantable 50% lumber 25% clear 7%, Max. deviation 8 cm Hemlock/Balsam Knots Rot cm top diameter: 4 cm knots over the entire log OR 5 cm knots over the upper 50% of the log (with knots 2 cm in diameter permitted over the lower 50% of the log). 50 cm top diameter: 4 cm knots over the entire log OR 5 cm knots over the upper % of the log* OR 8 cm knots over the upper 50% of the log* (* knots 2 cm in diameter permitted over the lower portion of the log). Occasional larger knots (OLKs) are permitted, to 1 per 3 metres. Permitted, provided 75% lumber is attained. I GRADE Min. top diameter Min. log length Logs 38 cm top diameter Logs 38 cm top diameter (former H grade) Max. twist over 30 cm of length Grade Requirements 38 cm 4 m 75% lumber 50% merchantable 50% lumber 65% merchantable 10%, Max. deviation 9 cm Hemlock/Balsam Knots cm top diameter 8 cm cm top diameter 9 cm 76 cm top diameter 10 cm Occasional larger knots (OLKs) are permitted, to 1 per 3 metres. Rot Permitted, provided percentage lumber is attained. March
140 J GRADE (same for all Coniferous species) Min. top diameter Max. top diameter Min. log length 16 cm* 36 cm 5 m Min. lumber percentage 75% Min. merchantable percentage 50% Max. twist over 30 cm of length 10% of top diameter *Refer to grading procedure, item 6, Section 6.1 for variance to this diameter limit. Grade Requirements Knots cm top diameter 4 cm cm top diameter 6 cm Occasional larger knots (OLKs) are permitted, to 1 per 3 metres. Rot Permitted, provided 75% lumber is attained. Hemlock/Balsam U GRADE (same for all Coniferous species) Min. top diameter Min. log length Min. lumber percentage: cm top diameter cm top diameter 38 cm top diameter 10 cm* 5 m 75% % 50% Min. merchantable percentage 35% Max. twist over 30 cm of length 13%, Max. deviation 13 cm *Refer to grading procedure, item 6, Section 6.1 for variance to this diameter limit. Grade Requirements Knots cm top diameter 4 cm cm top diameter 6 cm cm top diameter 8 cm cm top diameter 10 cm cm top diameter 12 cm 76 cm top diameter 14 cm Occasional larger knots (OLKs) are permitted, to 1 per 3 metres Rot Permitted, provided percentage lumber is attained. Hemlock/Balsam 124 March 2018
141 X GRADE (same for all Coniferous species) Min. top diameter Min. log length 10 cm* 3 m Min. lumber percentage % Min. merchantable percentage 35% Max. twist over 30 cm of length 13%, Max. deviation 13 cm *Refer to grading procedure, item 6, Section 6.1 for variance to this diameter limit. Grade Requirements Knots cm top diameter 4 cm cm top diameter 6 cm cm top diameter 8 cm cm top diameter 10 cm cm top diameter 12 cm 76 cm top diameter 14 cm Rot Hemlock/Balsam Occasional larger knots (OLKs) are permitted, to 1 per 3 metres for logs 50cm. Logs 50 cm may have oversize knots up to a maximum of 2 per 3 m of log length Permitted, provided % lumber is attained. Y GRADE* (same for all Coniferous species) Lower than X grade. Hemlock/Balsam March
142 Spruce Grades and Grade Requirements Table 6.7 Spruce Grades and Grade Requirements. F GRADE Min. top diameter 76 cm Min. log length 4 m Min. percentage lumber 75% Min. percentage clear lumber 50% Max. twist over 30 cm of length 4%, Max. deviation 6 cm Spruce Grade Requirements Knots Rot Must be 90% surface clear with well spaced knots or knot indicators permitted on the upper 10% of two sides or on the upper 20% of one side of that log length only. No conk permitted. Insect holes must not penetrate beyond the sapwood. Permitted provided 75% lumber is attained. G GRADE Min. top diameter 60 cm Min. log length 4 m Min. percentage lumber 75% Min. percentage clear lumber 25% Max. twist over 30 cm of length 4%, Max. deviation 6 cm Spruce Grade Requirements Knots Rot cm top diameter, must be 75% surface clear with well spaced knots or knot indicators permitted on the upper 25% of two sides or on the upper 50% of one side of the log length only. 76 cm top diameter: must be 50% surface clear with well spaced knots or knot indicators permitted on the upper 50% of two sides or on the upper 75% of one side of the log length only OR with whorls of large knots spaced so that 75% of the log can be cut into clear 2.6 m lengths. 100 cm top diameter with whorls of large knots spaced so that 50% of the log can be cut into clear 2.6 m lengths. No conk rot permitted. Insect holes must not penetrate beyond the sapwood. Rot permitted if 75% lumber is attained. 126 March 2018
143 H GRADE Min. top diameter Min. log length 38 cm 4 m Spruce Logs 38 cm top diameter Logs 60 cm top diameter (former F or G grade) Max. twist over 30 cm of length 75% Lumber 65% merchantable 50% lumber 25% clear 7%, Max. deviation 8 cm Grade Requirements Knots Rot cm top diameter: 4 cm knots over the entire log OR 5 cm knots over the upper 50% of the log (with knots 2 cm in diameter permitted over the lower 50% of the log). 50 cm top diameter: 4 cm knots over the entire log OR 5 cm knots over the upper 6623% of the log* OR 8 cm knots over the upper 50% of the log* (*knots 2 cm in diameter permitted over the lower portion of the log). Occasional larger knots (OLKs) are permitted, to 1 per 3 metres. Insect holes must not penetrate beyond the sapwood. Permitted, provided percentage lumber is attained. I GRADE Min. top diameter Min. log length Logs 38 cm top diameter Logs 38 cm top diameter (former H grade) Logs 50 cm top diameter Max. twist over 30 cm of length Grade Requirements 38 cm 4 m 75% Lumber 50% merchantable 50% lumber 65% merchantable 50% lumber 50% merchantable 10%, Max. deviation 9 cm Spruce Knots cm top diameter 8 cm cm top diameter 9 cm cm top diameter 10 cm 100 cm top diameter 13 cm Occasional larger knots (OLKs) are permitted, to 1 per 3 metres. Rot Permitted, provided percentage lumber is attained. March
144 J GRADE (same for all Coniferous species) Min. top diameter Max. top diameter Min. log length 16 cm* 36 cm 4 m Min. percentage lumber 75% Min. percentage merchantable 50% Max. twist over 30 cm of length 10% *Refer to grading procedure, item 6, Section 6.1 for variance to this diameter limit. Grade Requirements Knots cm top diameter 4 cm cm top diameter 6 cm Occasional larger knots (OLKs) are permitted, to 1 per 3 metres. Rot Permitted, provided 75% lumber is attained. Spruce U GRADE (same for all Coniferous species) Min. top diameter Min. log length Min. lumber percentage: cm top diameter cm top diameter 38 cm top diameter 10 cm* 5 m 75% % 50% Min. merchantable percentage 35% Max. twist over 30 cm of length 13%, Max. deviation 13 cm *Refer to grading procedure, item 6, Section 6.1 for variance to this diameter limit. Grade Requirements Knots cm top diameter 4 cm cm top diameter 6 cm cm top diameter 8 cm cm top diameter 10 cm cm top diameter 12 cm 76 cm top diameter 14 cm Occasional larger knots (OLKs) are permitted, to 1 per 3 metres Rot Permitted, provided percentage lumber is attained. Spruce 128 March 2018
145 X GRADE (same for all Coniferous species) Min. top diameter Min. log length 10 cm* 3 m Min. lumber percentage % Min. merchantable percentage 35% Max. twist over 30 cm of length 13%, Max. deviation 13 cm *Refer to grading procedure, item 6, Section 6.1 for variance to this diameter limit. Grade Requirements Knots cm top diameter 4 cm cm top diameter 6 cm cm top diameter 8 cm cm top diameter 10 cm cm top diameter 12 cm cm top diameter 14 cm 100 cm top diameter 16 cm Rot Spruce Occasional larger knots (OLKs) are permitted, to 1 per 3 metres for logs 50cm. Logs 50 cm may have oversize knots up to a maximum of 2 per 3 m of log length Permitted, provided % lumber is attained. Y GRADE (same for all Coniferous species) Lower than X grade. Spruce March
146 Cypress/Yew Grades and Grade Requirements Table 6.8 Cypress/Yew Grades and Grade Requirements. D GRADE Min. top diameter Min. log length 60 cm 4 m Min. percentage lumber 75% Min. percentage clear lumber 50% Max. twist over 30 cm of length Grade Requirements Knots Rot 4%, Max. deviation 6 cm Cypress/Yew cm top diameter, 75% surface clear with knots or knot indicators permitted on the upper 25% of two sides or the upper 50% of one side of the log length only. 76 cm top diameter, % surface clear with knots or knot indicators permitted on the upper % of two sides or the upper % of one side of the log length only. Permitted, provided 75% lumber is attained. F GRADE Min. top diameter Logs 50 cm top diameter Min. Log Length Min. percentage lumber Min. percentage clear lumber Logs 60 m top diameter (former D grade) Min. Log Length Min. percentage lumber Min. percentage clear lumber Max. twist over 30 cm of length Grade Requirements Knots Rot 50 cm 4 m 75% 25% 6 m 50% 50% 4%, Max. deviation 6 cm Cypress/Yew cm top diameter, 75% surface clear with knots or knot indicators permitted on the upper 25% of two sides or the upper 50% of one side of the log length only. 60 cm top diameter, 50% surface clear with knots or knot indicators permitted on the upper 50% of two sides or the upper 75% of one side of the log length only. Permitted, provided percentage lumber is attained. 130 March 2018
147 H GRADE Min. top diameter Min. length 38 cm 4 m Min. percentage lumber 50% Min. percentage merchantable 65% Max. twist over 30 cm of length Grade Requirements Knots Rot cm top diameter: 4 cm knots over the entire log OR 7%, Max. deviation 8 cm Cypress/Yew 5 cm knots over the upper 50% of the log, with knots 2 cm in diameter permitted over the lower 50% of the log. 50 cm top diameter: 4 cm knots over the entire log OR 5 cm knots over the upper % of the log* OR 8 cm knots over the upper 50% of the log* (*knots 2 cm in diameter permitted over the lower portion of the log). Occasional larger knots (OLKs) are permitted, to 1 per 3 metres. Permitted, provided 50% lumber is attained. I GRADE Min. top diameter Min. log length 38 cm 4 m Min. percentage lumber 50% Min. percentage merchantable 50% Max. twist over 30 cm of length Grade Requirements 10%, Max. deviation 9 cm Knots cm top diameter 8 cm cm top diameter 9 cm 76 cm top diameter 10 cm Occasional larger knots (OLKs) are permitted, to 1 per 3 metres. Rot Permitted provided 50% lumber is attained. Cypress/Yew March
148 J GRADE (same for all Coniferous species) Min. top diameter Max. top diameter Min. log length 16 cm* 36 cm 4 m Min. percentage lumber 75% Min. percentage merchantable 50% Max. twist over 30 cm of length 10% *Refer to grading procedure, item 6, Section 6.1 for variance to this diameter limit. Grade Requirements Knots cm top diameter 4 cm cm top diameter 6 cm Occasional larger knots (OLKs) are permitted, to 1 per 3 metres. Rot Permitted, provided 75% lumber is attained. Cypress/Yew U GRADE (same for all Coniferous species) Min. top diameter Min. log length Min. lumber percentage: cm top diameter cm top diameter 38 cm top diameter 10 cm* 5 m 75% % 50% Min. merchantable percentage 35% Max. twist over 30 cm of length 13%, Max. deviation 13 cm *Refer to grading procedure, item 6, Section 6.1 for variance to this diameter limit. Grade Requirements Knots cm top diameter 4 cm cm top diameter 6 cm cm top diameter 8 cm cm top diameter 10 cm cm top diameter 12 cm 76 cm top diameter 14 cm Occasional larger knots (OLKs) are permitted, to 1 per 3 metres Rot Permitted, provided percentage lumber is attained. Cypress/Yew 132 March 2018
149 X GRADE (same for all Coniferous species) Min. top diameter Min. log length 10 cm* 3 m Min. lumber percentage % Min. merchantable percentage 35% Max. twist over 30 cm of length 13%, Max. deviation 13 cm *Refer to grading procedure, item 6, Section 6.1 for variance to this diameter limit. Grade Requirements Cypress/Yew Knots cm top diameter 4 cm cm top diameter 6 cm cm top diameter 8 cm cm top diameter 10 cm cm top diameter 12 cm 76 cm top diameter 14 cm Logs 50 cm may have oversize knots up to a maximum of 2 per 3 m of log length. Rot Occasional larger knots (OLKs) are permitted, to 1 per 3 metres for logs 50cm. Logs 50 cm may have oversize knots up to a maximum of 2 per 3 m of log length Permitted, provided percentage lumber is attained. Y GRADE (same for all Coniferous species) Lower than X grade. Cypress/Yew March
150 Deciduous Grades and Grade Requirements Table 6.9 Deciduous Grades and Grade Requirements. C GRADE (ACT -Cottonwood only) Min. top diameter Min. log length 25 cm 5 m Min. percentage veneer 80% Max. twist over 30 cm of length Grade Requirements Knots Rot Misc. 7%, Max. deviation 8 cm No knots over 4 cm in diameter are permitted. Knots < 4 cm in diameter must be well spaced. No conk allowed. No butt rot allowed. No butt rot in adjacent log permitted No sweep permitted. No crook permitted. Deciduous I GRADE Min. top diameter Min. log length 25 cm 5 m Min. percentage lumber 50% Min. percentage merchantable 50% Max. twist over 30 cm of length Grade Requirements Knots cm top diameter 4 cm cm top diameter 8 cm 50 cm top diameter 9 cm Rot Permitted provided 50% lumber is attained. 10%, Max. deviation 9 cm Deciduous 134 March 2018
151 U GRADE Min. top diameter Min. log length Logs cm top diameter cm top diameter 25 cm top diameter 10 cm* 5 m Min. merchantable percentage 35% Max. twist over 30 cm of length 75% Lumber 66% Lumber 50% Lumber 13%, Max. deviation 13 cm * Refer to grading procedure, item 6, Section 6.1 for variance to this diameter limit. Grade Requirements Knots cm top diameter 4 cm cm top diameter 6 cm cm top diameter 8 cm cm top diameter 10 cm 50 cm top diameter 12 cm Rot Permitted, provided percentage lumber is attained. Deciduous Y GRADE Lower than X grade. Deciduous March
152 6.4 Summary of Log Grades by Species Table 6.10 Fir/Pine/Larch log grade summary. Grade Min. Length (m) Min. Top DIB (cm) Min. Top DIB Knots Knots max DIB Min. Scale Defects Twist D Lumber 5 m % surface clear 75% L 50% CL no conk, blind conk or rotten branches 4% (6 cm) F 5 m % surface clear 75% L 25% CL no conk, blind conk or rotten branches 4% Lumber % surface clear (6 cm) B* 5 m m butt block is clear 80% V no conk, blind conk or butt rot 7% Peeler m butt block knot indicators allowed no butt rot in adjacent log (8 cm) C * Peeler 5 m cm Maximum 80% V no conk, blind conk or butt rot no butt rot in adjacent log 7% (8 cm) H** Sawlog 5 m cm or 5 cm top half (rem. 2 cm max.) 75% L 65% M 7% (8 cm) cm or 5 cm top 2/3 (rem. 2 cm max.) or 8 cm top half (rem. 2 cm max.) 50% L 65% M I** Sawlog 4 m cm 75% L 50% M or former H 50% L 65% M 10% (9 cm) cm 50% L cm 50% M * Fir only ** Occasional larger knots (OLKs) 1 per 3 m L = Lumber CL = Clear M = Merchantable V = Veneer 136 March 2018
153 Table 6.11 Cedar log grade summary. Grade Min. Length (m) Min. Top DIB (cm) Min. Top DIB Knots Knots max DIB Min. Scale Defects Twist D 5 m % surface clear 75% L 4% % surface clear 50% CL (6 cm) % surface clear 66% L 50% CL F 5 m % surface clear 75% L 4% H *** I *** % surface clear 25% CL (6 cm) % surface clear 5 m cm or 5 cm top half (rem. 2 cm max.) cm or 5 cm top 2/3 (rem. 2 cm max.) or 8 cm top half (rem. 2 cm max.) 75% L 65% M 4 m cm 75% L 50% M cm 50% L/50% M cm 50% L/65% M or former H 50% L 65% M K 4 m % surface clear 50% SS* slabs >38cm thick 7% (8 cm) 10% (9 cm) former % surface clear 75% CL (6 cm) D % surface clear L former F 4 m % surface clear 50% SS 50% CL slabs > 26 cm thick 4% 7% (8 cm) M 4 m % surface clear 50% S** 25% CL slabs >16 cm thick 7% (8 cm) *SS = shingles or shakes **S = shingles only *** OLK = 1 per 3 m March
154 Table 6.12 Hemlock/Balsam log grade summary. Grade Min. Length (m) Min. Top DIB (cm) Min. Top DIB Knots Knots max DIB Min. Scale Defects D 5 m % surface clear 75% L no conk, blind 4% lumber % surface clear 50% CL conk or rotten branches F 5 m % surface clear 75% L no conk, blind 4% % surface clear 25% CL conk, or rotten Twist (6 cm) lumber branches (6 cm) H sawlog * 5 m cm or 5 cm top half (rem. 2 cm max.) cm or 5 cm top 2/3 (rem. 2 cm max.) or 8 cm top half (rem. 2 cm max.) 75% L 65% M or former D,F 50% M 25% CL 7% (8 cm) I 4 m cm 75% L or former H 10% sawlog* cm 50% M 50% L 65% M (9 cm) * OLK = 1 per 3 m cm 138 March 2018
155 Table 6.13 Spruce log grade summary. Grade F lumber G lumber H sawlog Min. Length (m) Min. Top DIB Grade (cm) Min. Top DIB Knots Knots max DIB 4 m % surface clear 75% L 50% CL 4 m % surface clear 75% L 25%CL % surface clear or 2.6 m clear sections over 75% of the log % surface clear or 2.6 m clear sections over 50% of the log 4 m cm or 5 cm top half (rem. 2 cm max.) * cm or 5 cm top 2/3 (rem. 2 cm max.) or 8 cm top half (rem. 2 cm max.) I sawlog Min. Scale Defects Twist 75% L 65% M 60+ or former F, G 50% L 25% CL 4 m cm 75% L 50% M * cm 50% L * OLK = 1 per 3 m cm 50% M cm no conk 4% (6 cm) no conk 4% (6 cm) or former H 50% L 65% M 7% (8 cm) 10% (9 cm) March
156 Table 6.14 Cypress/Yew log grade summary. Grade Min. Length (m) Min. Top DIB (cm) Min. Top DIB Knots Knots max DIB Min. Scale Defects D 4 m % surface clear 75% L 4% Twist lumber % surface clear 50% CL (6 cm) F 4 m % surface clear 75% L 25% CL lumber % surface clear or former D (6m) 50% L 50% CL H sawlog 4 m cm or 5 cm top half (rem. 2 cm max.) * cm or 5 cm top 2/3 (rem. 2 cm max.) or 8 cm top half (rem. 2 cm max.) 50% L 65% M 4% (6 cm) 7% (8 cm) I 4 m cm 50% L 10% sawlog cm 50% M (9 cm) * cm * OLK = 1 per 3 m 140 March 2018
157 Table 6.15 Coniferous Common Grades log grade summary. Grade J sawlog U utility **** Min. Length (m) Min. Top DIB Grade (cm) 5 m* 16-36** Min. Top DIB Knots Knots max DIB 4 cm 6 cm Min. Scale 75% L 50% M 5 m cm 75% L 35% M cm 66% L cm 35% M cm cm 50% L cm 35% M Defects Twist 10% 13% (13 cm) X 3 m cm 33% L 13% utility **** Y chipper N Missing cm 35% M (13 cm) cm cm cm 2 oversized cm per 3 m 1 m *** Logs lower in grade than X *** On Broken Top tree missing portion graded as N *Note Spruce & Cypress 4 m ** Maximum top diameter 36 cm *** No minimum diameter ****OLK 1 per 3m March
158 Table 6.16 Deciduous Species log grade summary. Grade C* peeler Min. Length (m) Min. Top DIB Grade (cm) Min. Top DIB Knots Knots max DIB Min. Scale Defects Twist 5 m cm 80% V no conk or butt rot no butt rot in adjacent log 7% (8 cm) I 5 m cm 10% sawlog cm 50% L 50% M cm (9 cm) U utility Y chipper N Missing 5 m cm 75% L 35% M cm 66% L 35% M cm cm 50% L cm 35% M 1 m Logs lower in grade than U *** On Broken Top tree missing portion graded as N % (13 cm) * Cottonwood only (Act) *** No minimum diameter 142 March 2018
159 7. Plants, Soils, and Old Growth Introduction The data collected in this section of the inventory will be used in a variety of ways: To provide data for management and research applications, such as enhancement of the provincial ecological classification system, particularly in previously un-described ecosystems and managed successionally younger ecosystems. To generate vegetation lists, including species codes and percentage cover values, and to assist in wildlife management and resource planning. To build a database that will permit different users to track floristic changes over time, in different regions, and in a variety of Biogeoclimatic zones or subzones. Objectives To establish a network of sample plots that can be located and resampled in the future. To collect accurate information about plant species composition in Vegetation Resources Inventory sample plots. To identify, estimate, and measure selected soil and site features to provide a record of conditions at Vegetation Resources Inventory sample plot locations. To determine the successional characteristics of the stand. To classify Vegetation Resources Inventory sample plots using the Biogeoclimatic ecosystem classification system, the British Columbia Land Cover Classification Scheme, and to identify the site series. To describe forested as well as non-forested ecosystems. March
160 General Procedures The following is a recommended sequence of steps in collecting the ecological measurements (steps 3 and 4 may be interchanged): 1. Establish the 10 m fixed-radius plot and the 5.64 m sub-plot. 2. Describe vegetation in the 5.64 m and 10 m fixed-radius plots before the soil pit is dug and the site is trampled too much. 3. Record the site and soil description. 4. Sample the coarse woody debris transects (Cards EW and EC) discussed in Section 8. CWD sampling can provide insights into successional processes and recent stand history on sampled sites. 5. Interpret the successional characteristics of the stand. Refer to other data collected to make successional interpretations. Field Cards for this Section Ecological Description 1 (EP) (Appendix A, Figures A.17 & A. 18) Site classification, site features, soil features, soil description for pin location and summary information Ecological Description 2 (ED) (Appendix A, Figures A.19 & A. 20) As above, for when plot centre not in dominant site Tree and Shrub Layers (ET) (Appendix A, Figures A.21 and A.22) Species, and cover by species and for seedlings Herb and Moss Layers (EH) (Appendix A, Figures A.23 and A.24) Species, and cover by species and substratum Succession Interpretations (EO) (Appendix A, Figures A.25 and A.26) Factors influencing vegetation establishment, tree species succession, stand structure features, structural stages, old growth assessment 144 March 2018
161 Detailed Procedures 7.1 Establishing Plots The main ecological plot is 10 m radius (314 m 2 ), centred on the Integrated Plot Centre. It is used to collect vegetation data from the tree and shrub layers, and for site description, soil, and site classification. The nested subplot is 5.64 m radius (100 m 2 ), also centred on the Integrated Plot Centre. It is used to sample vegetation in the herb and moss layers, and tree seedlings. In order to evaluate slope gradient, aspect, meso slope position, succession interpretations, and a number of other attributes it is necessary to look beyond the 10 m main ecological plot to an approximate radius of 25 m around the Integrated Plot Centre, depending on the attribute, site variability, and topographic breaks. The inventory sampling method does not allow movement of the ecological plot to more typical or homogeneous portions of the polygon as this would introduce sampling bias. Some plots may therefore contain more than one site series. This may lead to difficulties with secondary applications of the data such as ecological classification. To address this concern, field crews will assess the ecological variability (uniformity) of the plot and estimate the relative proportions of component site series and/or land cover classes comprising a plot. If the Integrated Plot Centre does not fall in the dominant site series (within the 10 m plot), then additional soil and site data are needed for the dominant site series. Procedure Measure the 10 m and 5.64 m plots and flag at appropriate intervals around the circumferences of the plots to demarcate plot boundaries. For detailed procedures, see Section 3: Plot Establishment. 7.2 Assessing Ecological Variability 1. Assess the ecological variability within the integrated plot. If more than one site series occurs, identify the dominant site series (occupying the greatest proportion of the plot) and determine whether the plot centre falls within this site series. The dominant site can occur as discontinuous patches or as one contiguous area in the plot. 2. If the plot centre falls within the dominant site series, record only one site series and soil description (Field Card EP). 3. If the plot centre is not in the dominant site series, record the site features of the plot centre on Field Card EP, and a second set of soil and site features for the dominant site on Field Card ED. 4. Record the percentage cover of site series and land cover class, or land cover alone if site series does not apply. 5. Figure 7.1 illustrates some situations that may be encountered. Note that only one plant list is done for the entire plot, in all cases. March
162 A B Example 1: plot centre is in dominant site series (A) complete one site and soil description at plot centre complete EP card for A only. A B Example 2: plot centre is in dominant site series (A); subdominant (B) is discontinuous complete one site and soil description at plot centre complete the EP card for A only. A B A Example 3: plot centre is subdominant site series (B) complete one site and soil description at plot centre complete another site/soil description within dominant site (A) complete ED card for A and EP card for B. A B Example 4: plot centre is in subdominant (B), but site series is discontinuous complete one site and soil description at plot centre complete another site/soil description at dominant site (A) complete ED card for A and EP card for B. Figure Assessing Uniformity and Attributes in Areas with Ecological Variability Within the 10m Fixed-Radius Plot 146 March 2018
163 7.3 Identifying and Recording Site and Soil Features The following classifications are based on all the observations taken in this section. Record your observations on the field cards in the numbered areas indicated for each observation. A. Site Classification 1. UNIFORMITY Record the uniformity of the plot using the five-class scale shown in Table 7.1. Table 7.1 Plot uniformity codes. Code Description 1 (uniform) > 98% of plot in one homogeneous* ecosystem or site series 2 > 90% 98% of plot in one homogeneous* ecosystem or site series; the remainder in other ecosystems ** 3 > 70% 90% of plot in one homogeneous* ecosystem or site series; the remainder in other ecosystems ** 4 > 50% 70% of plot in one homogeneous* ecosystem or site series; the remainder in other ecosystems ** 5 (variable) 50% or less of plot is the largest homogeneous* ecosystem or site series * Homogeneous means the same site series and structural stage. ** Other ecosystems include different successional and structural stages (for example, major structural differences beyond that of understorey vegetation associated with smaller canopy gaps due to mortality of 1-3 trees) as well as different sites (different site series, or inclusions of avalanche tracks, streams, gullies, rock outcrops, roads). 2. BIOGEOCLIMATIC UNIT Record the Biogeoclimatic unit as determined on the ground. This includes zone, subzone, variant, and phases (if applicable). Note: Biogeoclimatic phases have not been defined for all variants. An example of a phase is the ICH mc1a (ICH Zone, Moist Cold Subzone, Nass Variant, Amabilis Fir Phase) as described in Chapter 5 page 116 of the Field Guide to Site Identification for the Prince Rupert Forest Region. For a concise introduction to Biogeoclimatic and site unit terminology see Ecosystems of British Columbia (Meidinger and Pojar 1991). A digital copy of valid codes for "Biogeoclimatic Unit" and "Site Series and Coverage" is available (boxes 2 and 3 on the EP12 card). This complete list of BEC Zones, Subzones, Variants, Phases and matching Site Series is available from the MFLNRO Research Branch website. It is called BECdb.mdb. Currently it is only available as a relational database file (MS Access 97). To obtain a copy go to the following website: These are the official provincial codes from Research Branch. MFLNRO Research Branch is the data custodian of the BEC and Site Series information. March
164 3. SITE SERIES AND COVERAGE As clarified by Klinka et al. (1989), Indicator Plants of Coastal British Columbia, site series identification is aided by indicator plants, even when their cover and vigour are low and their presence is sporadic. Although, the VRI ecological methodology does suggest you do not need to record genera or species with less than 1% coverage, this does not imply that such plants should be ignored when doing site series identification. 1. Identify the site series at the plot centre and up to 2 other sites within the 10 m radius plot. 2. Enter the three-character site series/phase code from the appropriate MFLNRO regional field guide to site identification and interpretation. 3. If the plot occurs on an ecosystem not recognized in the ecological classification, record the soil moisture regime (SMR) and soil nutrient regime (SNR). If these values cannot be estimated (for example, roads, gravel pits, boulder fields), record site series # as 99_ and in the SMR and SNR columns record a dash ( ). 4. Estimate the coverage of each site series as a percentage of the 10 m plot, to a maximum of 100% if there is only one site series. Note: Second and third site series or land cover classes covering less than 5% (16 m 2 ) are considered too small to recognize. 4. SOIL MOISTURE REGIME Relative Soil Moisture Regime (SMR) refers to the average annual amount of soil water available to plants, relative to a given Biogeoclimatic subzone variant. This attribute is particularly valuable when the site series is not defined. 1. Record SMR for the plot centre and up to two other sites. 2. The SMR classes, given in Table 7.2, are inferred from the physiographic and soil features described. (A more complete description and keys are in the relevant regional field guide and in Describing Ecosystems In The Field, Luttmerding et al ) Table 7.2 Relative Soil Moisture Regime codes. Code Description 0 very xeric (very dry) 1 xeric 2 subxeric 3 submesic 4 mesic 5 subhygric 6 hygric 7 subhydric (very wet) 8 hydric (certain wetland ecosystems and persistent standing water) 148 March 2018
165 5. SOIL NUTRIENT REGIME Soil Nutrient Regime (SNR) refers to the amount of essential soil nutrients, particularly nitrogen, available to plants. This attribute is particularly useful when the site series cannot be determined in other ways. 1. Record SNR for the plot centre and up to two other sites. 2. The SNR classes, given in Table 7.3, are inferred from the physiographic and soil features described. (A more complete description and keys are in the relevant regional field guide and in Describing Ecosystems In The Field, Luttmerding et al ) Table 7.3 Soil Nutrient Regime codes. Code A B C D E F Description very poor poor medium rich very rich ultra rich or saline (rarely used, but may be encountered) 6. LAND COVER CLASSIFICATION 1. Record the land cover class to the appropriate level. 2. Record up to three separate land cover designations if necessary, corresponding on a oneto-one basis with up to three site series designations (in a highly variable 10 m radius plot). 3. If 99_ is recorded for site series, then the land cover classification still provides a description for that area of the plot. Note: Second and third site series or land cover classes covering less than 5% (16 m 2 ) are considered too small to recognize. See Table 7.4 for a condensed version of the B.C. Land Cover codes. For full definitions and tables, please refer to the current Vegetation Resources Inventory B.C. Land Cover Classification Scheme available on the MFLNRO Vegetation Resources Inventory website. March
166 Table 7.4 B.C. Land Cover Classification codes in condensed form. Level I Codes Description V Vegetated Total cover of tree-, shrub-, herb-, and moss-layers (other than crustose lichens) >= 5% of the site within the 10m radius plot. N Non-vegetated Total cover of tree-, shrub-, herb-, and moss-layers (other than crustose lichens) < 5% of the site within the 10m radius plot. Level II Codes Description V T Treed > = 10% of the area is covered in tree species of any size. N Non-Treed < 10% of the area is covered in tree species of any size. N L Land More than half of the area is not covered by water as defined below. V W Water More than half of the area is covered by a naturally occurring static water body >= 2m in depth in some portion, or flowing water between continuous definable banks. These flows may be intermittent or perennial; but does not include ephemeral flows where a channel with no definable banks is present. Islands within streams that have definable banks are not part of the stream; gravel bars are part of the stream. Level III Codes Description N W Wetland Includes SMR = 7 and wetter. Land having the water table near, at, or above the soil surface, or which is V o saturated for a long enough period to promote wetland or aquatic processes as indicated by poorly drained soils, specialized vegetation, and various kinds of biological activity which are adapted to the wet environment. r V U Upland Includes everything between wetland and alpine; SMR ranges from 0 to 6. A Alpine Treeless by definition (for practical purposes <1 % tree cover can be included) with vegetation dominated by shrubs, herbs, graminoids, bryoids and lichens. Much of the alpine is covered by primarily rock, ice and snow. Level IV Codes Description V TB Treed Broadleaf Total cover of broadleaf trees is = 75 % of the total tree cover, and tree cover is = 10%. TC Treed Coniferous Total cover of coniferous trees is = 75 % of the total tree cover, and tree cover is = 10%. TM Treed Mixed Neither coniferous nor broadleaf trees cover = 75 % of the total tree cover, and tree cover is = 10%. ST Shrub Tall Shrub site with height >= 2 m and < = 10 m. SL Shrub Low Shrub site with height < 2 m. HE Herb Herb site with no distinction between forbs and graminoids. HF Herb Forbs Herb site with forbs (non-graminoid) > 50% of the herb cover. HG Herb Graminoids Herb site with graminoids (grasses, sedges & rushes) > 50% of herb cover. BY Bryoid Bryoid site with no distinction between mosses, liverworts, hornworts and lichens. BM Bryoid Moss (bryophytes) Bryoid site with mosses, liverworts and hornworts forming > 50% of the bryoid cover. BL Bryoid Lichens Bryoid site with lichens (not crustose) forming > 50% of the bryoid cover. N SI Snow / Ice Permanent snow or ice. V RO Rock / Rubble Bedrock or fragmented rock moved to present position by gravity or ice. EL Exposed Land All other forms of exposed land. Level V Codes Description V DE Dense Tree, shrub or herb cover % NV LL Landing OP Open Tree, shrub or herb cover 26 60%, or bryoids < =50% BU Burned Area N V SP Sparse Treed cover 10 25%, and shrub and herb cover <26% RZ Road Surface CL OP Bryoid polygon-closed Bryoid site, with bryoid cover > 50% Byroid polygon Open,with bryoid<= 50% MU Mudflat Sediment GL Glacier CB Cutbank PN Snow Cover MN Moraine BR Bedrock GP Gravel Pit TA Talus TZ Tailings BI Blockfield RN Railway MZ Rubbly Mine Spoils UR Urban LB Lava Bed OT Other RS River Sediments LA Lake ES Exposed Soil RE Reservoir LS Pond or Lake Sediments RI River / Stream RM Reservoir Margin OC Ocean BE Beach 150 March 2018
167 Comments Record on the field cards any items of ecological interest that have been otherwise missed. Preface your remarks with card and attribute identification. B. Site Features Site features such as slope, aspect, surface shape, meso slope, microtopography, rocky substrates, flood hazard, and open water should be assessed only for the particular site being described. For example, in the event of a site A and a site B (see Figure 7.1; examples 3 and 4 requiring EP and ED cards), do not average any of the above attributes (7, 8, 10, 11, 12, 13, 16, and 17) across the two site series. Record separate values on the EP and ED field cards. 7. SLOPE (%) Record the slope gradient to the nearest percent. On uniform conditions, assess slope by averaging over a 100 m distance (50 m above and below the plot centre). On the EP card give more weight to the slope conditions at the IPC, particularly when the IPC falls within a topographically different site series, compared with the remainder of the 10 metre radius plot. If there is a major topographic break in the slope, measure only to the break point. If required, record separate values on the EP and ED cards. 8. ASPECT () Record the orientation of the downward slope (in degrees) using a compass bearing. On the EP card give more weight to the slope orientation at the IPC, particularly when the IPC falls within a topographically different site series, compared with the remainder of the 10 metre radius plot. Level ground (less than 2% slope) has no aspect; code as 999. If the aspect is due north the value is recorded as 0 degrees. If required, record separate values on the EP and ED cards. 9. ELEVATION (M) Record the elevation of the plot centre in metres. 10. SURFACE SHAPE Describe the general shape of the slope the site is situated on (convex, straight, concave). If required, record separate values on the EP and ED cards. 11. MESO SLOPE Meso slope describes the relative position of the site within a local catchment area, which affects surface and subsurface water flow to the plot. Slope position relates to the segment of slope between prominent topographic irregularities (for example, major slope breaks). If required, record separate values on the EP and ED cards. 1. Describe the meso slope of the site. Refer to Figure 7.2 for descriptive terms. 2. Record using the codes described in Table 7.5. March

168 Figure Side View Showing Meso Slope Descriptive Terms Table 7.5 Meso slope codes. Code C U M L T D F Description crest the generally convex upper portion of a hill. upper slope the generally convex upper portion of the slope immediately below the crest. middle slope the area of the slope between the upper slope and the lower slope where the slope is generally neither distinctly convex or concave. lower slope the area towards the base of a slope, generally concave. toe the area demarcated from the lower slope by an abrupt decrease in slope gradient. depression any area that is concave in all directions. flat any level area not directly adjacent to a slope (for example, toe). The surface profile is generally horizontal. 152 March 2018
169 12. MICROTOPOGRAPHY 1. Microtopography describes the variability (or mounding) of the surface of the site being described. If required, record separate values on the EP and ED cards. 2. Record one of the classes of microtopography shown in Table 7.6. Table 7.6 Microtopography codes. Code SM MO ST EX Description smooth few or no mounds; if present, less than 0.3 m high and more than 7 m apart moderately mounded mounds 0.3 to 1 m high and 3 to 7 m apart strongly mounded mounds 0.3 to 1 m high and less than 3 m apart extremely mounded mounds more than 1 m high 13. ROCKY SUBSTRATES 1. Estimate the percentage of the within-site ground surface covered by rocky substrates within the 10 m radius plot. If required, record separate values on the EP and ED cards. 2. Record percentage for codes listed in Table 7.7. Table 7.7 Rocky substrate codes. Codes CS BR Description cobbles/stones exposed rock fragments larger than 7.5 cm* diameter; may be covered by mosses or lichens, for example, with a forest floor less than 1 cm thick. bedrock exposed bedrock that may be covered by mosses or lichens, for example, with a forest floor less than 1 cm thick. *Coarse fragment size or diameter is measured along the b axis, where a = length, b = width, and c = height (a > b > c). 14. SLOPE FAILURE 1. Note any evidence of recent or past slope failure greater than 100 m 2 surface area in the plot or intercepted by the bearings between the main plot and the auxiliary plots. Evidence of failure includes landslides, slumps, debris flows, debris torrents, and bedrock failures. For further information about slope failure refer to Chatwin (Chatwin et al. 1994). 2. Record if present in the plot (Y or N) or along the transects between the plots. Not visited (NV) applies if evidence was not found because the lines were not all traversed. 3. Features that would indicate slope instability are shown in Table 7.8. March
170 Table 7.8 Indicators of slope instability. obvious recent failures (tracks of exposed soil oriented downslope) headwall or sidewall scarps that are rectangular or horseshoe shaped deposits of slide materials at the base of the failure which are fan-shaped and often hummocky a significant difference in vegetation (species and age) from the surrounding area, which may indicate older failure tracks generally on steeper slopes, and often in association with wet sites (seepage zones, draws, and so on) 15. GULLIES Gullies are long, linear depressions incised into the landscape by active erosion processes, mainly running water in places accompanied by mass movement and/or snow avalanching. Where the stream channel is confined in a narrow ravine with banks usually higher than 3 m. The longitudinal profile may range from gentle to steep, and uniform to irregular (benched). The cross-section profile may be V-shaped to U-shaped with moderate to steep sidewalls (50% or greater slope). Dry draws (gully shaped features without a stream) with long established vegetation and soils, and stream channels with none of the above active or potentially active sidewall erosion features are not included. 1. Note the presence of gullies in the main plot or intercepted by the bearing between the main plot and the Auxiliary Plots. 2. Record if present in the plot or along transects (Y or N). 3. Not visited (NV) applies if evidence was not found because the lines were not all traversed. 16. FLOOD HAZARD Estimate the relative frequency of flooding of rivers, creeks, and streams using the biophysical features shown in Table 7.9. If required, record separate values on the EP and ED cards. Table 7.9 Indicators of flood hazard. Flood hazard Frequent F Occasional O Flood frequency subject to annual flooding occasionally flooded Overbank deposits recent organic or inorganic deposits may be present recent organic or inorganic deposits may be present Vegetation Topography Litter cover none, or species of primary colonization mature vegetation, typically deciduous species; conifers restricted to elevated sites low lying areas adjacent to the potential flood waters areas of moderate elevation relative to the potential flood waters none or very thin layer of fresh litter thin forest floor ranging from fresh to partially decomposed material 154 March 2018
171 Flood hazard Rare R Not Applicable N Flood frequency subject to flooding at high stage not subject to flooding Overbank deposits no evidence of recent organic or inorganic overbank deposits Vegetation Topography Litter cover mature vegetation, includes coniferous species areas of high elevation relative to the potential flood waters well above or away from potential flood waters (adapted from Describing Ecosystems in the Field Luttmerding et al. 1990). thicker forest floor with developed profile 17. OPEN WATER 1. Estimate the within-site area covered by either flowing (F) or standing water (S). If required, record separate values on the EP and ED cards. 2. Record as a percentage. C. Soil Features 1. Dig a soil pit to represent the centre point of the Integrated Plot and representative of conditions at the plot centre, regardless of which point is the most representative of the dominant site of the 10 m radius plot. 2. Dig a second soil pit if necessary to represent the most dominant site. Complete a second soil pit only where the dominant site (versus the IPC site) is clearly one of contrasting site quality due to obviously different site and soil conditions. 3. The soil pit should be a minimum of 60 cm deep unless you encounter impenetrable material. If a soil pit cannot be excavated on the plot, draw a line through the soil features section on the field card and note the reason in the comments. 4. Upon completion of the sample, refill the soil pit. 18. SURFICIAL MATERIAL Surficial material refers to the soil parent materials. They are classified according to their mode of formation. The following description is based on the Terrain Classification System for British Columbia (Version 2), Howes and Kenk Record the surficial materials seen in the soil pit using the appropriate code shown in Table If two types of material are observed, record both (for example, C_/M_ [colluvial over morainal]). March
172 Table 7.10 Surficial material codes. Code A C E F FG L M O R V Description Anthropogenic landfill, mine spoils, roadfill Colluvium deposits a direct result of gravity (talus, landslide deposits) on steep terrain; below rock bluffs coarse fragments, angular, same rock type as bedrock coarse fragment >35%, loosely packed, porous. landslide and slope failure deposits Eolian wind action (loess, dunes) well-sorted silt or fine sand, loose and fluffy a capping over other material Fluvial transported & deposited by streams or rivers (floodplain, fluvial terrace, fan, delta) deposits gravels, sands, and/or silts, depending on stream velocity rounded gravels well sorted, stratified topography flat, or steep erosional scarp along valley bottoms near a river or stream Glaciofluvial deposited by glacial meltwater streams in front of, within, or along margins of glacial ice (eskers, kame terraces, outwash) coarse-textured, non-sorted to well-sorted, gravels and sands, with layers of finer textured materials topography flat, sometimes steep erosional scarp along valley bottoms, up valley sides, or extensive plain outside valley systems gravel pits are often present Lacustrine old lake bottoms or old lake beaches stratified silts and clays, often with varves glaciolacustrine sediments may contain ice-rafted stones and lenses of morainal or glaciofluvial material topography flat, sometimes with a steep erosional scarp, along valley bottoms slumps and landslides are often present Morainal Till (till) deposited directly by glacial ice highly variable, compacted to non-compacted sediments, unsorted mixture of coarse and fines looks like cement stones of different rock types may have striations (grinding marks from the ice). The most widespread and variable parent material in B.C. Organic wetland (peat, muck in bogs, fens, swamps) and forest floor overlying bedrock (LFH >10 cm thick; noted as O/R) Bedrock exposed bedrock, organic layer (<10 cm) Volcanic unconsolidated ash, cinders cappings over other parent materials (for example, V / M ) 156 March 2018
173 Code W Description Marine salt water deposits old mud flats old beaches fine textured (silts and clays) often dense old beaches are well-sorted sands and/or gravels with rounded coarse fragments shells, marine concretions flat or very gently sloping lower elevations near the ocean (as high as 200 m above present sea level in the Georgia Strait area) glaciomarine sediments similar to marine except may contain stones and lenses of morainal or glaciofluvial materials 19. DEPTH TO: (IN CM) Record the observed depth from the 0 depth (mineral soil surface for mineral soils, ground surface for organic soils) to each of the features shown in Table 7.11, if present within the soil profile. Table 7.11 Soil features codes. Code W M R B F C N Description water table or seepage Measure to the free water surface in the soil, or to the line along which water emerges. Free water may collect as the result of a high groundwater table or it may be due to a temporary accumulation of water above a relatively impermeable layer. Depth to water table and depth to seepage are closely related concepts which are combined here to avoid unnecessary difficulties in the field. mottles (not applicable in organic soils) Measure to the surface of orange to red (oxidized) spots or blotches within a predominantly dull yellow, grey, blue, or olive-coloured (reduced) mineral soil horizon. Mottles are characteristic of soils with periodic intense reduction (absence of free oxygen from the atmosphere). The mottled zone often overlies a permanently reduced, or strongly gleyed horizon of dull bluish to grey colour (often indicated by presence of a water table or seepage). Mineral soils with more intensely reduced conditions have relatively greater volumes of bluish-grey colours. Soils become reduced when they are anaerobic, or deficient in oxygen which happens when microorganisms and plant roots use oxygen faster than it can be replaced from the atmosphere, or when oxygen entry is blocked, as in compact basal till. The colours associated with mottles and gleying are due to the effects of oxidation and reduction on iron, aluminum, manganese, and other metals. root-restricting pan Measure to layers that impede root penetration (pans, cemented horizons, compact parent materials). bedrock Measure to consolidated bedrock. Weathered bedrock that can be removed with a shovel should be considered soil. frozen layer Measure to the top of a frozen layer. carbonates Measure to the top of a layer containing carbonate accumulations. not observable (glacier, paved surface, lake) March
174 20. HUMUS FORM Humus refers to the forest floor and organic-enriched surface mineral horizons. Describe the humus form as one of the types shown in Table Table 7.12 Humus form codes. Code MO MM MD MR MU NA Description Mor LFH horizons prominent, F horizon is matted, with abundant fungal mycelia, mushroom smell common, usually abrupt transition to mineral soil. Mormoder intergrade between Mor and Moder, F horizon not strongly matted and often variable with clumps of matted material and pockets of friable material, fungal mycelia and insect droppings may both occur, but neither clearly predominates over the other. Moder LFH horizons prominent, F horizon loose and friable, fungal mycelia less common, insects and droppings common, rich potting-soil smell, may have thin Ah horizons Mullmoder intergrade between Moder and Mull, features well developed F and H (F+H horizons >2 cm thick) but Ah present which is thicker than the F+H horizons. Mull Ah horizon prominent, F + H horizons <2 cm thick, F horizon very friable, Ah granular, earthworms often present. Not applicable use this option when none of the above humus forms apply. For example, in situations where there is very little or no surface organic matter, such as on bare bedrock, on fresh mineral deposits (floodplain sands, active talus slopes), and on road surfaces. The L, F, H horizons are freely drained, upland organic horizons which are found on most mineral soils, and occasionally on some organic soils. You may need to use this category when describing wetland ecosystems. 21. SOIL COLOUR 1. Describe the general colour of the rooting-zone mineral soil. 2. Record one of the categories shown in Table Table 7.13 Soil colour codes. Code D M L N Description dark chocolate brown or black (Munsell colour value <4 when moist) medium intermediate colour (most commonly encountered) light very pale soil (Munsell colour value >6 when moist) not applicable (bedrock, no soil) 158 March 2018
175 D. Soil Description 22. HORIZON 1. Record the main types of organic and mineral horizons. 2. Enter the appropriate code left justified, using Table 7.14, beginning with the uppermost horizon, followed by subsequent horizons proceeding down through the profile. 3. Horizons include L, F & H, Ah _, Ae _, B, and C. 4. Differentiate subdivisions of the B or C horizons (for example, B1 _, B2 _) if they differ substantially in colour, texture, coarse fragments, or structure. 5. Subordinate horizons of B and C (for example, Bf _, Bf1, Bf2, Bfg, Bt _, and Bm _) may be recorded if you can confidently identify them. The soil classification system follows the Canadian System of Soil Classification (1998) with additional combinations specific to British Columbia. The additional combinations are documented in the "Field Manual for Describing Terrestrial Ecosystems". A list of allowable codes can be found on the Inventory Branch website for reference. Table 7.14 Examples of important soil horizons. Horizon L F H Ah Ae B C Of Description an upland organic horizon consisting of relatively fresh, undecomposed plant residues. an upland organic horizon consisting of partly decomposed plant residues in which fragmented plant residues are generally recognizable as to origin. an upland organic horizon comprised of well-decomposed plant residues in which plant structures are generally not recognizable. Note: F and H can be combined and recorded as an FH _ horizon if they are difficult to distinguish surface mineral horizons enriched with organic matter (darker coloured than underlying horizon) surface mineral horizons leached (eluviated) of organic matter, Fe, Al, and other elements (lighter [usually light greyish] coloured than underlying horizon). mineral horizons affected by pedogenic processes and characterized by enrichment in organic matter, Fe and Al, clay, or by the development of soil structure, or by a change in colour indicating gleying or oxidation. mineral horizons relatively unaffected by pedogenic processes except gleying, and accumulation of carbonates and salts. It represents the unweathered parent material. a wetland organic horizon consisting of poorly decomposed plant residues that are readily identifiable as to origin ( peat ). Horizon Om Oh R Description a wetland organic horizon consisting of partly decomposed plant residues which are at a stage of decomposition intermediate between Of and Oh horizons ( peat ). a wetland organic horizon consisting of well decomposed plant residues ( black muck ). bedrock March
176 23. DEPTH (CM) 1. Record the average distance from 'zero' depth for each horizon in the profile (Figure 7.3). For forest floor horizons (L, F, H) zero depth is the boundary between organic and mineral horizons. Depths are measured from the ground surface to 0 depth (for example, in the diagram, L: 6, F: 4, H: 2). For mineral horizons, zero depth is the top of the uppermost mineral horizon, and lower boundary depths are measured in descending order (for example, in the diagram A: 3, B: 10, C: 60). For organic soils, zero depth is the top of the organic material. Organic soils are soils with greater than 60 cm of organic material (if surface horizons are Of _), or greater than 40 cm of organic material (if surface horizons are Om _ and Oh _), or greater than 10 cm thick if they overlie rock, as described on pp in the Canadian System of Soil Classification (1998). 2. Record the total depth of the soil pit (DOP). Example in Organic Soils Example in Mineral Soils Zero Depth OM _ OH _ L F H Organic Horizons A B C Zero Depth Mineral Horizons Not to Scale Figure Example of Recording Horizon Depth in Organic Soils and Mineral Soils 24. TEXTURE 1. Estimate the texture of the mineral soil (grains 2 mm or less in diameter) using field estimation methods as described in MFLNRO Regional Ecology Field Guides to Site Identification and Interpretation. 2. Estimate texture of each mineral soil horizon, not just the main horizon. 3. Enter the appropriate codes. 25. COARSE FRAGMENTS 1. For each mineral soil horizon, estimate the proportion of the total volume of soil material occupied by mineral particles larger than 2 mm in diameter. 2. Record the total coarse fragment percentage. Coarse fragment size or diameter is measured along the b axis, where a = length, b = width, and c = height (a > b > c). 3. Break this total down into two categories: gravel (greater than 2 mm and less than 7.5 cm) cobbles and stones (greater than or equal to 7.5 cm) 160 March 2018
177 7.4 Describing Vegetation Species Coding System There are a number of taxonomically difficult plants which need only be identified to the level of genus. In the interests of saving time, you are not required to identify these plants to the species level. However, if you know the species and/or time permits, you are encouraged to record these genera to the species level. In general, species codes consist of the first 4 letters of the genus and the first 3 letters of the species. The most current plant species codes and descriptive information is available at the MFLNRO Research Branch BEC website. However, there are a number of instances which would result in the same code for two different species. For example Vaccinium myrtilloides and Vaccinium myrtillus. The species that comes first alphabetically is assigned the standard code, and the last letter of the code for the second species defaults to the fourth letter in that species name. Thus V. myrtilloides = VACCMYR _ and V. myrtillus = VACCMYT _. This is a potentially serious error, which may be impossible to detect or correct. You must refer to master lists provided for the Biogeoclimatic units in your project area, to ensure the code you use is correct. If the genus is known but not the species, record all the characters (up to 7) in the genus. For example, if an unknown lichen of the Cladonia genus is collected, it is coded as CLADONI _. A grass of the Poa genus would be coded as POA _. If the grass is known to be Poa alpina, it would be coded as POA_ALP _. If you are uncertain of genus but know the plant family, record the first 6 letters of the family name, and collect a specimen for determination. As an example, several species from the sunflower family could be recorded as ASTERA1 and ASTERA2, rather than as HERB1 and HERB2. Assuming the species is unknown, use the following coding priority for vascular plants: genus > family > non-latin code such as FERN. Since family names are not as widely documented for lichens, liverworts, and mosses, the coding priority for these non-vascular unknown species is: genus > non-latin code such as MOSS (see Table 7.15). As a general rule, the non-latin unknown code uses 4 letters (MOSS), the family code uses 6 (ASTERA), and the genus code uses 7 (VACCINI) or fewer if there are not 7 available (POA, CAREX, SALIX). Although not encouraged, an 8-character code, may be used for special purposes to distinguish a variety or subspecies. For example, PINUCON1 versus PINUCON2, to differentiate Pinus contorta var. contorta (shore pine) from Pinus contorta var. latifolia (lodgepole pine). March
178 Table 7.15 Suggested coding conventions for collected unknown species. Code* genus family TREE SHRU SEED HERB LYCOPO or CLUB SELAGIN EQUISET or HORS FERN GRAM POACEA or GRAS JUNCAC or RUSH CYPERA or SEDG SAPR LICH LIVR MOSS Description code first 7 letters of genus code first 6 letters of family coniferous or deciduous tree coniferous or deciduous shrub coniferous or deciduous seedling herb (catch-all for herb-layer species) clubmosses belong to one family Lycopodiaceae clubmoss lesser-clubmosses belong to one genus Selaginella horsetails belong to one genus Equisetum horsetail fern graminoid (grass, rush or sedge) grasses belong to one family Poaceae grass rushes belong to one family Juncaceae rush sedges belong to one family Cyperaceae sedge saprophyte or parasite lichen liverwort moss *CODE add numbers to the codes for multiple samples. For example, CLADONI3, CAREX2, CYPERA3, VIOLAC2, HERB3, LIVR2, MOSS4. Collecting Unknown Species and Voucher Specimens 1. Collect a sample for any species you cannot identify in the field for which you should record a percentage. Depending on the project, Voucher Specimens may be required. Voucher Specimens are samples collected, preserved, and stored to later verify identifications made in the field. For trees, low shrubs, and tall shrubs, collect representative samples of flowers, fruits/cones, bark, a branch with leaves (needles) showing branching patterns. Record the height of plants when they are not collected as an intact specimen; this would obviously apply to trees and most shrubs. For herb-layer species collect the entire plant or as much of the plant as feasible, including roots and, in particular, any flowering structures. For mosses and lichens, collect a palm-of-the-hand size sample. Try to include moss capsules, lichen apothecia. 162 March 2018
179 2. The following points will ensure good-quality specimens: Use appropriate containers: paper bag, envelopes, plastic bags (allow air in occasionally). Press or process as soon as possible. Keep different genera separated. Keep mosses/lichen samples separated and unpressed to maintain their threedimensional form. Cross-reference to item number on field card. Collect specimens from outside the plot area, if possible. 3. Complete a waterproof plant label: for each plant sample being forwarded for identification (Fig. 7.4). Concentrate on microsite conditions directly associated with the plant, rather than duplicating general habitat or site information for the larger sample plot. Typical plant microsite habitat information: soil or substrate conditions (humus, decaying wood, fibric organic soil, coarse- or finetextured mineral soil, disturbed or recently mixed soil, SMR and SNR conditions, salinity) drainage (seepage track, stream or pond margin, depressional hollow or shedding mound) exposure and other physical factors (growing in open exposed or in relatively protected/shaded conditions, in an avalanche or a slide track, exposure to periodic or frequent flooding from standing or moving water). Record only the most applicable microsite conditions, such as in these examples: associated with an exposed seepage draw in saturated nutrient-poor organic soil; growing in steep welldrained mor humus beneath a large canopy gap; on disturbed sandy mineral soil associated with overturned tree roots; in a rocky south-aspect grassy patch with coarse well-drained dark soil. In the descriptive notes, include diagnostic characteristics which may not be obvious from a casual look at the dried and/or pressed specimen. Here are some examples of useful additional descriptive information: distribution and abundance (solitary individuals in a scattered pattern; common and growing in small clumps; several large clumps within the plot; continuous coverage) leaves (leaves feel slightly sticky; fresh leaves have a cucumber scent when crushed; blades have an undulating margin) associated species (with skunk cabbage and lady fern; within clumps of Cladonia spp., in patches with Veratrum, Fauria and Sphagnum) Keep documentation on the labels as concise and applicable as possible. Do not allow labels to become separated from their relevant plant samples. March

180 Plant Identification Figure VRI Unknown Plant Label As a guideline, you should not need to spend more than 10 minutes per plot checking your plant identification references. If you cannot quickly identify the plant, collect it. Identify Vascular Plants to the Species Level Identification of vascular plants (tree-, shrub-, and herb-layer) should be carried to the species level. Identify Non-vascular Plants to Genus Level Identification of bryophytes and lichens need only go to the genus level. Alternatively, if the species is known or if there is enough time to sample, you are encouraged to carry on to the species level. If you are uncertain about the genus, you should sample anyway. Recommended Procedure for Identification of Collected Plants 1. Time permitting, identify collected plants in the evening if this can be done efficiently. Otherwise, deliver unknown plants to the project leader as soon as possible for help with identification. 2. The project leader should press or package remaining unknown samples considered sufficiently intact, and forward them to the MFLNRO Project Ecologist. Plant samples should be organized and packaged as separate life form groups, for example, shrubs, ferns, graminoids, herbs, bryophytes (mosses and liverworts) and lichens. Bryophytes and lichens should not be pressed. Rather, they should be stored in loose packaging such as envelopes, so they can air-dry while retaining their general shape. 3. If the Project Ecologist is unable to identify some of the samples, intact specimens should be forwarded to the MFLNRO Regional Ecologist. If the Regional Ecologist is unable to identify the remaining samples within a designated time, the identifications should default to genus or possibly a higher taxonomic level, such as family. Specimen quality or developmental stage may also limit identification to a higher taxonomic level. In any case, the final database entry must be the correct code for the particular taxonomic level. 164 March 2018
181 Unknown Species Coding Please use the unknown species coding conventions listed in Table 7.15, as this will help simplify interpretation of the unknown coding on the forms. You are encouraged to continue recording your descriptive notes for unknown species in the comments section on the ET and EH forms, as this will help you remember the species when you determine its cover value, and later when you key the plant or store it for identification. These codes are normally temporary if the plant has been collected for identification, and they should be replaced on the forms and in the database with the correct Latin codes upon receiving results. 26. SPECIES CODES 1. Record all shrub and tree species growing in the 10 m radius plot, and all herbs and bryoids growing on the dominant substrate within the nested 5.64 m radius plot, using codes based on the scientific names. A list of scientific names with codes will be provided by a local ecologist for an inventory project. Collect samples of any unknown species, bag and label them for later identification by specialists. Record the item number from the field card on the tagged plant sample as a cross-reference. 2. Maintain a systematic method of recording the species in the plot. The results are much easier to read and compile. One common method is to record species by strata, starting with the uppermost stratum, and within strata by abundance. 3. In some circumstances it may be necessary to collect the plant list at another time of the year to take advantage of peak floristic conditions. 4. Certain ecosystems are more difficult to sample (for example, alpine, subalpine meadows, wetlands, riparian edge communities, grasslands, rock outcrops, and disturbed sites with introduced weedy and non-native species). It may be necessary to have these plots sampled by specialists. Estimating Percent Coverage by Layer Percent canopy cover is the percent of the ground area covered by a vertical projection of the crown of the plant onto the ground surface. When estimating percent cover, care must be taken not to bias estimates because of crown density. Except for distinct holes in the crown, the area within the perimeter of the crown is assumed to be fully covered. It is required that percent cover be recorded for each species in each plot. To aid in assessing percent cover, a set of comparison charts are provided in Figure 7.5. Table 7.17 also provides examples of the area coverage and the percent cover for the plot. Figure 7.6 illustrates some relative amounts of percent canopy coverage and shows the drip line of the plant. March
182 Matt 1% 2% 3% 5% 7% 10% 15% 20% 25% 30% 40% 50% Adapted from: Richard D. Terry and George V. Chillinger. Journal of Sedimentary Petrology 25(3): , September 1955 Figure Comparison Charts for Visual Estimation of Foliage Cover 166 March 2018
183 Stratum % Cover Trees 10% Shrubs 5% Herbs 60% Total Cover 70% 0 2m Figure An Example of Percent Coverages in a Plot, Viewed From Above Percent cover is estimated as the percentage of the ground surface covered when the crowns of the plants are projected vertically. The values are estimates that will vary somewhat between individuals, however, the relative cover values are required to provide information on species abundance. With regards to species of very low coverage, you are not expected to produce an exhaustive list. It is easy to overlook a few species given the seasonal variation in flowering and vegetative production. Species of very low coverage, less than 0.1 percent can easily be missed by anyone. Save time and energy by focusing on the main substrate, which in most forested ecosystems is the forest floor, as discussed in item 4 below. 1. Initially, record an estimate of overall coverage (in percent) in each layer (all species), excluding any overlapping. Use this figure to help calibrate cover estimates for individual species. 2. Estimate the coverage for each species in the tree and shrub layers within the 10 m radius plot. Estimate the coverage within the nested subplot (5.64 m radius) for seedlings (ET card) for herbs and mosses (EH card) For calibration, Table 7.17 (conversion factors) shows the equivalent area for percent cover when applied to the 10 m radius main plot and 5.64 m radius nested plots. 3. If the total of individual species percentages in a layer is less than the overall total, adjust cover estimates for individual species or totals. If the cover of a species overlaps within a strata, then the total percentage may be considerably less than the sum of individual layer coverages, but never more. Do not sum the individual cover values to compute the overall coverage. March
184 Vegetation layers are listed in Table 7.16 and in Figure The D layer consists of mosses, lichens, liverworts, and seedlings. Three main substrates are recognized in Layer D: Dh (on forest floor and mineral soil) Dw (on decaying wood) Dr (on rock) In Layer D emphasize species growing on the main substrate, which in most cases will be Dh (forest floor or mineral soil). Describe the species on atypical substrates (for example, Dw decaying wood, and Dr rock) only when these substrates individually represent 40% or more of the 5.64 m vertically projected plot surface. If present, forest floor (Dh) species should always be described, because they are often important indicators of soil conditions. Table 7.16 Vegetation layer codes. Layer A Description Tree layer: includes all woody plants greater than 10 metres tall. Estimate cover values for individual tree or shrub species for the entire A layer. Overlapping crown is not additive for the same species, consequently a given tree or shrub species cannot have coverage greater than 100%. B1 Tall shrubs: includes all shrubs and advanced tree regeneration between 2-10 m tall. In some low productivity and young ecosystems the canopy of mature trees may be less than 10 m tall and should be recorded in the B1 layer. B2 C Low shrubs: consist, with minor exceptions, of shrubs and established tree regeneration less than 2 m tall and at least 2 years old. Herbs: refers to herb-layer plants such as ferns, graminoids, forbs, saprophytes, and some woody Species. Appendix E provides a list of low woody species and species of doubtful lifeform assigned to the herb (C) layer. D Mosses, lichens, liverworts and seedlings: includes tree seedlings less than 2 years old. Table 7.17 Conversion factors from percent coverage to horizontal area. Percent coverage 10 m radius plot 5.64 m radius plot Horizontal surface area 314 m m 2 25% coverage ¼ of the plot pie or 78.5 m 2 1% coverage 1.8 m 1.8 m or 3.14 m 2 1 m 2 ¼ of the plot pie or 25 m 2 Note: You are not required to record genera or species with less than 1% coverage. 0.1% coverage ~ 55 cm 55 cm or 0.31 m 2 ~ 32 cm 32 cm or 0.1 m % (1H* hundredth of a percent) 0.001% (1T* thousandth of a percent) ~ 18 cm 18 cm or 314 cm 2 ~ 10 cm 10 cm or 100 cm 2 ~ 6 cm 6 cm or 31.4 cm 2 ~ 3 cm 3 cm or 10 cm 2 *1H and 1T, or multiples (3H, 5H, 2T, 9T,...), allow for better estimates for species with very small coverage. Note that 9H or 9T is the maximum since 10H = 0.1% and 10T = 1H. ~ means approximately 168 March 2018
185 A 10 m B1 2 m B2 0m Cover Assigned to B2 Layer Cover Assigned to B1 Layer Cover Assigned to A Layer Estimating Average Shrub Height Figure Taller Vegetation Layers 27. AVERAGE SHRUB HEIGHT B1 (M) AND B2 (M) The height and the percent cover estimates will be used to calculate shrub volume by species. 1. Record the mean height, weighted by percent cover, for each species in shrub layers. Include all woody shrubs as well as trees in the shrub layers. March
186 EXAMPLE The following calculation provides the weighted average for a stand of Douglas maple 3 m tall covering 30%, with one 8 m tall shrub covering 10%. Cover-weighted average height = (height cover) / cover = = (3m * 0.3) + (8m * 0.1) ( ) (0.9m + 0.8m) m = 0.4 = 4.2m (round down to nearest 0.1m) 2. There is not enough time to calculate the weighted average in the field, and you are not expected to do it. Develop a quick visual estimate of average species height, weighted by coverage. 7.5 Interpreting Succession Successional interpretations are based on an area within approximately 25 m of the Integrated Plot Centre, and within the polygon. As the sample may cover more than one land cover type (for example plot centre, site two and site three) the succession interpretation which best describes the IPC location is to be recorded. For example, if the IPC falls within a stream channel which bisects an older pine forest, and if the stream channel covers more than half of the 10 metre plot, then the succession interpretations should be restricted to the stream channel site alone. 1. Record data on the EO Field Card using appropriate codes. 2. Identify factors influencing vegetation, including previous and current tree species, and structural class of the area surrounding the Integrated Plot Centre. 3. Assess the factors used to determine old growth characteristics of the stand, and estimate the percent of old trees remaining. 4. Decide whether the stand is old growth or not. 5. If not old growth, decide whether the stand has some old-growth characteristics. 28. FACTORS INFLUENCING VEGETATION ESTABLISHMENT Record the major observable factors that are relevant to development of the current vegetation and soil characteristics. The time frame is (approximately) the past 500 years. Use from one to a maximum of four of the categories shown in Table Only record factors for which direct evidence can be observed. 170 March 2018
187 Use a 2-character description (such as Aw), or a 1-character description (such as A ) if the specific factor is unknown. Enter a slash if no evidence can be observed. Table 7.18 is adapted from the Field Manual for Describing Terrestrial Ecosystems draft, Table 7.19 provides a more detailed description of certain factors marked *. Table 7.18 Site disturbance codes. Code A B D F L Description Atmosphere-related effects e p w climatic extremes (extreme cold and/or heat; glaze ice, hail, heavy snow) atmospheric pollution (toxic gases, acid rain) windthrow* Biotic effects (specify animal or plant in comments) b d e i p v w Disposals c e g m o r Fires c g i l r s beaver tree-cutting* domestic grazing/browsing excrement accumulation (other than that normally associated with grazing/ browsing) insects (infestation, kill)* disease (excluding insects)* aggressive vegetation wildlife grazing/browsing (specify animals) chemical spill or disposal effluent disposal domestic garbage disposal mine spoils oil spill or disposal radioactive waste disposal or exposure overstorey crown fire* light surface (ground) fire repeated severe surface fires (intense) burning of logging slash ( broadcast burn, piled and burned, burned windrows) repeated light surface fires severe surface fire* Forest harvesting a c d e l o s patch cut system clearcut system (if slash burned, see also Fires) seed tree system (uniform, grouped) selection system (group selection, strip, single tree) land clearing (includes abandoned agriculture) coppice shelterwood system (uniform, group, strip, irregular, natural, nurse tree) March
188 Code M P S T W X Description Plant or site modification effects c f g h i s t herbicide (chemical) use fertilization seeded or planted to grasses seeded or planted to herbs irrigation planted or seeded to shrubs planted or seeded to trees Gathering or removal of plant products f m o s x firewood gathering mushrooms moss salal other (specify in comments) Soil disturbance a c e f g m p r s t cultivation (agricultural) compaction excavation sidecast/fill gouging (> 5 cm into mineral soil) mining effects (placer tailings, rock quarrying, open pit mines, tailings) mechanical site preparation (brush blading, scarification, trenching, mounding) road bed, abandoned scalping (forest floor removed) railway, abandoned Terrain-related effects a d e s v avalanche recent deglaciation eolian (active soil removal or deposition by the wind) terrain failures (active/recent slumps, slides, solifluction soil creeping) volcanic activity Water-related effects d e i s water table control (diking, damming) water table depression (associated with extensive water extraction from wells) inundation (including temporary inundation resulting from beaver activity) temporary seepage (usually man-induced; excludes intermittent seepage resulting from climatic conditions) Miscellaneous (for further disturbance types, enter X and describe in comments) *Indicates additional information in Table 7.19 For certain factors shown in Table 7.18, further details are provided in Table March 2018
189 Table 7.19 Indications of site disturbances. Signs of windthrow trees may be uprooted or snapped along the bole may lie parallel to each other if in patches stands arising after extensive windthrow will have mounded terrain Signs of clearcut logging scattered, large stumps of similar species, size condition evidence of saw cut or felling machine cut on stumps CWD may be of a few large logs from previous stand and smaller material from mortality in new stand new growth will contain trees of fairly uniform DBH/height Signs of selective logging scattered larger stumps, possibly of the same species skid trails will be visible larger trees of the logged species should still be present do not confuse with small clearcut Signs of surface fire larger CWD will be charred or partially burned standing trees will have charred lower boles, and crowns raised (crown scorch) lower crown foliage discoloured (recent fire) dead or dying smaller trees in the understorey (recent fire) fire scars on larger trees (basal wound with a burned catface) if surface fires common in area Signs of overstorey crown fire most trees dead; most of their foliage gone and some small twigs bark charred (recent); bark shed, leaving silvery snag (older) soil organic layer consumed to various degrees tree roots exposed near boles charred debris present Signs of beaver tree-cutting stumps show chipping and conical tops bark may be removed from larger branches primarily hardwood trees and willowy shrubs Signs of disease symptoms specific to each agent (cankers, rusts, mistletoes, blights, root diseases) swellings on branches or boles dead leaves, needles, bark, tops resin flows, galls, brooms distress cone crops and fruiting bodies on various parts Signs of Insects symptoms specific to each type (defoliators, sucking insects, woody tissue feeders) foliage discolouration to foliage loss curled twigs, branch galls, crown distortion March
190 stunted or deformed leaders Signs of snow avalanching tracks (if fairly frequent); shrub and herb species instead of trees (in tracks) broken branches, snapped boles, piles of debris windthrow or pushed over trees forests affected may be on slope beside or between tracks or in valley floor below runout zone Signs of slope failures sharp boundaries with remaining forest (severe) upper portion consists mostly of exposed mineral soil lower portion composed of soil, rock and forest debris debris forms mounded or lobed pattern trees dead, displaced or leaning older failures show decreasing mineral soil and increased organic matter slow regeneration of trees 29. TREE SPECIES SUCCESSION 1. In forested ecosystems look for signs of the earlier predominant tree species. The primary species has the greatest basal area. 2. Record previous and current predominant tree species with the appropriate code. For example, in a red alder stand with western hemlock and western redcedar stumps, record previous species as Hw _ Cw _, and current species as Dr _. Alternatively, if the stand is, and appears to have always been Bl _ Se _, simply record as Bl _ Se _ in both previous and current species boxes. 3. If stumps are present but they are unidentifiable, record the appropriate code for: Unknown (X ), Unknown hardwood (Xh _ ), Other hardwood species (Zh _ ). Stand Structure Features Evidence for the decision as to whether or not the stand has some old growth characteristics will be based on the following set of observations. 30. TREE HARVESTING Record if the forest has experienced some form of harvest: Clearcut C Partial P None N 31. SNAGS > 25 CM DBH Count the standing dead trees within the 25 m radius that meet the minimum size criteria: >25 cm DBH and >10 m tall or shorter due to advanced stage of decay (for example, wildlife tree classes 7 to 9). None 0 N Some 1 5 S Common > 5 C 174 March 2018
191 32. SNAGS/CWD IN ALL SIZES AND STAGES OF DECAY Assess the range of size and decay stage of the snags and CWD and record using codes in Table This observation is meant to identify those sites where snag and coarse woody debris recruitment is an ongoing process. Table 7.20 Snags/CWD codes. Code N S Y Description No No snags that meet the minimum size criteria, or all snags are within a narrow range (1 or 2) of decay classes; CWD absent or limited to a narrow range of decay classes. Some Snags meet the minimum size criteria but are limited to 3 consecutive decay classes; CWD limited to 3 consecutive decay classes. Yes Snags meet the minimum size criteria and represent most decay stages; CWD in most decay classes. 33. CANOPY GAPS DUE TO TREE MORTALITY Gaps are openings, caused by natural tree mortality, which are not yet occupied by A3 layer (>10 m tall) or equivalent trees. Mortality refers to natural causes of death; for instance trees have blown over, snapped off, or died standing. 1. Record gaps in the canopy that are due to natural tree mortality using codes in Table Do not count gaps if the cause of death appears to be related to harvesting or other human activities. It may be hard to decide, for example, where death is due to fire or other damage that could be related to human activities. 3. Do not include openings due to climatically drier or otherwise harsh regimes where trees are widely spaced. This also does not include natural stocking irregularities which may be caused by edaphic factors such as shallow soils, bluffs or rock outcrops, seepage or stream channels, wet depressional sites, colluvium, slide or avalanche tracks, snow accumulation patches, landings, trails, and roads. 4. Do not include successionally young sites where trees have not yet grown into the A3 layer. Table 7.21 Canopy gap codes. Code N S C Description None No apparently natural gaps. Some Smaller gaps amounting to <10% of crown closure in 25 m area. Common One or more larger gaps occupying 10% or more of the potential canopy area. March
.")
192 34. VERTICAL STRUCTURE Describe the distribution of shrub and tree layer strata using Figure 7.6 and Table Table 7.22 Vertical structure codes. Code S M C Description Simple Tends to be even-height, with limited coverage in up to two other strata (B2, B1, A3, A2, or A1). Moderate Tends to be uneven height with >10% of total coverage in each of three strata (B2, B1, A3, A2, or A1). Complex Stand is uneven-height with >10% of total coverage in each of four or five strata (B2, B1, A3, A2, and A1). Figure 7.8 Stratification of forest stands, shrubs, and trees. 35. SUCCESSIONAL STABILITY Assess whether the dominant species composition is relatively stable and record the appropriate code from Table We need to know if there is likely to be change in species composition of the dominant vegetation. It is important to consider the potential of a given species in a particular site. For example, in a MH wh_ subzone plot there may be frequent Hw and Cw in the understorey, but observations on the way to the plot suggest that in spite of their shade tolerance, few, if any, Hw and Cw survive into the main canopy, which is occupied by Hm, Yc and some Ba. 176 March 2018
193 Table 7.23 Successional stability codes. Code U I S Description Unstable Change in dominant species composition is imminent. Clues are recently disturbed sites, early structural stages, or presence of shade-intolerant (pioneer) species for the given site. With no apparent sign of a short cyclic major disturbance regime (floods, slides, windthrow, fire, disease) the vegetation will likely progress unimpeded to more advanced structural stages, with changes in dominant species composition along the way. Unstable means that the relative rate of change is rapid (on the order of less than 40 years). Intermediate Change in species composition has and will continue to take place in the dominant vegetation. The longevity of the species involved is such that the relative rate of change in composition is gradual, but directional (on the order of years). Stable Persistence in dominant species composition is apparent from factors such as advanced structural stage, occupation by shade-tolerant species, or when the rate of change in the dominant species composition is relatively very slow (stable for more than 80 years). Even relatively young dominant vegetation may qualify as stable if there is little sign of change in species composition. For example, an avalanche track dominated by slide alder would be considered stable if disturbance appears to be frequent enough to maintain the alder. Likewise a young shade-tolerant Hw stand that is unlikely to undergo much change in dominant species composition as its canopy gains height and structural complexity, would also be considered stable. 36. TREE AGE FOR SPECIES AND SITE SERIES Assess whether the trees appear old for their species and the site conditions, and record one of the codes shown in Table Because few tree ages are being collected, this will be difficult to determine. Even-aged stands will tend to be the easiest to evaluate. In a stand with differing tree ages, assigning an approximate age for the trees dominating the site will be difficult. Concentrate on the trees that dominate the canopy. Table 7.24 Stand age codes. Code Y I O Description Young Characteristic of even-height forests in the young forest or earlier structural stages. Intermediate Species may have attained near-maximum height, but there is little mortality in the main to upper canopy as the species are only in a mature forest stage. Old Trees in the upper canopy have been established for a relatively long time. Some upper canopy trees appear to have reached their physiological maximum age. Others may already have died. March
194 37. TREE SIZE FOR SPECIES AND SITE Evaluate the size of the trees on the plot, relative to the potential size expected for the site quality, amount of disturbance, and growing time. Relatively larger trees will obviously tend to be found in the less disturbed, older stands. Even-aged stands will be easier to evaluate. Small S Intermediate I Large L 38. STRUCTURAL STAGES Evaluate the stand and record one of the codes shown in Table Note that, depending on the climatic conditions and the site properties, the length of time required to reach mature and/or old forest stages varies considerably. Table 7.25 Structural stage codes. Code NV SP Structural Stage Nonvegetated Nonvegetated or Sparse Definition Time since major disturbance 1 < 5% vegetation cover <20 years for normal forest succession. Up to 100+ years for rocky or bouldery substrates and other severe sites. Initial stages of primary and secondary succession. Little or no residual vegetation except up to 100% cover of bryophytes and lichens. <10% cover of vascular plants. This stage may be prolonged ( years) where there is little or no soil development (bedrock, boulder fields). H Herb Early successional stage or restricted development due to environmental conditions or disturbance (snow fields, avalanche tracks, wetlands, flooding, grasslands, intensive grazing, intense fire damage) dominated by herb-layer (forb, graminoid, fern) vegetation; some invading or residual shrubs and trees may be present. Tree cover <10%, shrub cover <20% or <33% of total cover, herb-layer cover >20%, or >33% of total cover. LS Low Shrub Early successional stage or restricted development due to environmental limitations and conditions, dominated by shrubby vegetation <2 m tall. Seedlings and advance regeneration may be abundant. Tree cover <10%, shrub cover >20% or >33% of total cover. <20 years for normal forest succession. Up to 100+ years under conditions of soil, climate, or disturbance which limit succession. 178 March 2018
195 Code Structural Stage Definition TS Tall Shrub Early successional stage or restricted development due to environmental limitations and conditions dominated by shrubby vegetation > 2 m and < 10 m tall. Seedlings and advance regeneration may be abundant. Tree cover <10%, shrub cover 20% or 50% of total cover. PS YF MF Pole/ Sapling Young Forest Mature Forest Trees >10 m tall, have overtopped shrub and herb layers and stands are typically densely stocked; younger stands are vigorous and usually > years old. Older pole-sapling stages composed of stagnated stands (up to 100 yrs. old) are also included. This stage persists until self-thinning and vertical structure becomes evident in the canopy (often by the age of 30 yrs. in vigorous deciduous stands). Deciduous stands are generally younger than coniferous stands belonging to the same structural stage. Self-thinning has become evident and the forest canopy has begun differentiation into distinct layers (dominant, main canopy, and overtopped); vigorous growth and a more open stand than in the pole-sapling stage; begins as early as age 30 and extends to years depending on tree species and ecological conditions. Trees established after the last disturbance have matured and a second cycle of shade tolerant trees may have become established; understories become well developed as the canopy opens up. OF Old Forest Old, structurally complex stands comprised mainly of shade tolerant and regenerating tree species, although older seral and long-lived trees from a disturbance such as fire may still dominate the upper canopy; snags and coarse woody debris in all stages of decomposition are typical and understories are patchy. In some ecosystems, such as high elevation, or otherwise stressed, the understorey may have a number of tree species which are uncommon in the canopy, due to the inherent limitations of these tree species under the given conditions. 1 Structural characteristics have priority over time guidelines) 2 BGCU Group A includes the following: BWBSdk, BWBSmw, BWBSwk, BWBSvk, ESSFdc, ESSFdk, ESSFdv, ESSFxc, ICHdk, ICHdw, ICHmk1, ICHmk2, ICHmw1, ICHmw3, MS, SBPS, SBSdh, SBSdk, SBSdw, SBSmc, SBSmh, SBSmk, SBSmm, SBSmw, SBSwk1 (on plateau), and SBSwk3. Time since major disturbance 1 <40 years for normal forest succession. Up to 100+ years under conditions of soil, climate, or disturbance which limit succession. < 40 years for normal forest succession. Up to 100+ years for dense (> 2,000 stems/ha.) stagnant stands years yrs. for Biogeoclimatic group A yrs. for Biogeoclimatic group B 3 >140 yrs. for Biogeoclimatic group A 2 >240 yrs. for Biogeoclimatic group B 3 3 BGCU Group B: All other biogeoclimatic units. March
196 39. PERCENTAGE OF LIVE OLD TREES REMAINING Assess the proportion of live old-growth trees by examining the numbers of dead and living old forest or old-growth trees ( see table 7.25 Old Forest structural stage ages for your Biogeoclimatic unit: for example, in the MS zone trees > 140 years are old growth trees, or their remains, in the form of snags, fallen trees, or stumps to support your estimate. This is not an estimate of the number of live old trees versus an imaginary potential number of oldgrowth trees. For example, if the 25 m radius area has evidence of 10 old trees and only 3 are still alive and standing, the value would be 30%. Examples: 2 old trees x 100% = 100% (2 old trees + 0 old tree snags + 0 fallen old trees + 0 stumps) 0 old trees x 100% = 0% (0 old trees + 2 old tree snags + 1 fallen old trees + 3 stumps) 3 live old trees x 100% = 30% (3 live old trees + 2 dead old trees + 5 stumps of old trees) If the percentage of live old trees remaining is less than 40%, the site is probably too disturbed for the old growth forest designation. 40. OLD-GROWTH FOREST Base your choice on your opinion using all the succession attributes discussed above. No (some) suggests the stand has some old growth forest attributes, but it is not old growth. Record one of the following: No No (some) Yes 180 March 2018
197 Literature Cited Soil Classification Working Group The Canadian System of Soil Classification. Agric. And Agri-Food Can. Publ (revised). 187 pp. Howes, D.E. and E. Kenk. (eds.) 1997, Terrain Classification System for British Columbia. Version 2.0. Ministry of Environment, Lands and Parks, Victoria, BC. Klinka, K., V.J. Krajina, A. Ceska and A.M. Scagel Indicator Plants of Coastal British Columbia. University of British Columbia Press, Vancouver, BC. Luttmerding, H. A., D.A. Demarchi, E.C. Lea, D. Meidinger, and T. Vold Describing Ecosystems in the Field (2nd ed.) Ministry of Environment, Lands and Parks, Victoria, BC. MOE Manual 11 Meidinger, D. and J. Pojar Ecosystems of British Columbia. Ministry of Forests, Victoria, BC. SRS6. Ministry of Forests, B.C. Environment Field Manual for Describing Terrestrial Ecosystems. Draft for 1996 field season. Ministry of Forests Biodiversity Guidebook (Forest Practices Code of B.C.) Ministry of Forests and Ministry of Environment, Lands and Parks, Victoria, BC. ISBN Ministry of Forests Field Guide to Site Identification for the Prince Rupert Forest Region. Ministry of Forests, Victoria, BC. Land Management Handbook 26. March
198
199 8. Coarse Woody Debris Introduction Coarse woody debris (CWD) is a major contributor to structural diversity in forests and provides habitat for plants, mammals, amphibians, insects, and micro-organisms. It influences hillslope and stream geomorphology, affects the microtopography and microclimate of the forest floor, is an important nutrient and moisture pool, and in some ecosystems, may be a nitrogen fixation site. This section outlines the procedures for establishing the sampling transects, for deciding which CWD to measure, and for recording the measurements. Objectives 1. To accurately determine the gross volume of coarse woody debris by decay class. 2. To identify merchantable material and potential removals. Definitions Coarse woody debris (CWD), for the purpose of this inventory, is dead woody material located above the soil, in various stages of decomposition. CWD must be larger than 7.5 cm in diameter (or equivalent cross section) at the crossing point, and not self-supporting. Trees and stumps (intact in ground) are considered self supporting. CWD can also be in the form of felled and bucked logs or log decks. General Procedures 1. Set out the 24 m sampling transects. 2. Assess the transect conditions. 3. Measure and record information for the CWD pieces. Field Cards for this Section Coarse Woody Debris (EW) (Appendix A, Figure A.9) Field card for the random transect 1, species, diameter, % class 1, other decay class, tilt angle, accumulations. Coarse Woody Debris (EC) (Appendix A, Figure A.10) Field card for transect 2 species, diameter, % class 1, other decay class, tilt angle, accumulations. March
200 Detailed Procedures 8.1 Establishing the Sampling Transects Coarse woody debris is sampled along two horizontal 24 m line transects extending from the Integrated Plot Centre. 1. Establish the first line at a pre-assigned random azimuth from the plot centre. Measure out along the random azimuth with a tape to 24.0 m, correcting the distance to horizontal. Mark the end of the transect, for example, with a small stick stuck in the ground, flagged with ribbon (temporary marking for quality control), or a small paint mark on the ground. Mark along the line with logging paint the intersection of the line transect with potential coarse woody debris. Number a few of the large CWD with log marking paint to aid re-measurement and quality control. 2. Establish the second line at plus 90 from the first transect commencing at the Integrated Plot Centre. 3. Record the azimuth of each line on the Coarse Woody Debris (EW) and (EC) Field Cards. 8.2 Assessing the Transect Conditions Normally, the full length of the transect will be sampled. However, because the transects are based on a random bearing, unsafe or difficult conditions may be encountered and you may be unable to sample the full length. If the full length of the line cannot be sampled, record the distance you actually sampled, and explain in the Comments section why the remainder was not measured. Possible situations are: 1. Normal conditions Sample both 24 m transects using the procedures outlined in Section Anomalous conditions If the sample line intercepts an anomaly within the polygon such as a stream, pond, avalanche chute, on a rock outcrop (Figure 8.1) continue to sample the line as long as it is safe to do so. If the debris is floating, the pieces are measured in their location at the time of sampling (make a note of this in the comments). Note: Irregularities, such as swamps, rock outcrops, roads, and trails, are to be sampled if they are part of the polygon. 184 March 2018
201 24 m Transect (horizontal) IPC Stream 15.0 m Figure CWD Transect Encounters an Anomaly Within the Polygon 3. Unsafe conditions If the sample line intercepts unsafe conditions, record the length of the line actually sampled in the field.(for example if you encounter a cliff at metre 19 record horizontal length observed 19 out of 24 Note in the Comments section why a portion was not sampled. 4. One or both transects encounter the polygon boundary If the sample line would cross the polygon boundary and enter a different polygon: Stop at the polygon boundary and follow the original line back into the polygon (called the bounce-back method). Continue recording the CWD along the line in the reverse direction to complete the required 24 m sampling transect. Although each CWD is measured a second time, record it again with a new number (Figure 8.2). If the polygon boundary is reached before the halfway point (before 12 m), the bounce-back will pass through and past the Integrated Plot Centre. March
202 Re-measure Bounce back 8m Integrated Plot Centre Polygon Boundary Measure 16m Figure 8.2 The Bounce-Back Method When the Transect Intersects the Polygon Boundary 5. Transect encounters a heavy accumulation of CWD If a heavy or very heavy accumulation of CWD is encountered (for example, windthrow, felled and bucked timber, logging debris), the transect may be partially sampled. Each transect is individually assessed and a decision to split the transect is made before establishing each transect. Partial sampling reduces potential errors and sampling time. On heavy accumulations sample as follows: even azimuth: sample the 2nd quarter (from 6 to 12 m) and the 4th quarter (from 18 to 24 m) odd azimuth: sample the 1st quarter (from 0 to 6 m) and the 3rd quarter (from 12 to 18 m) record the length observed as 12 m of 12 m note in the Comments section the type of accumulation encountered, such as windthrow, felled and bucked timber, cold decks, or logging debris. If the line falls on very heavy accumulations, sample the partial line as follows: even azimuth: sample the 2nd quarter (from 6 to 12 m) odd azimuth: sample the 3rd quarter (from 12 to 18 m) record the length observed as 6 m of 6 m note in the Comments section the type of accumulation encountered, such as windthrow, felled and bucked timber, cold decks, or logging debris. 186 March 2018
203 8.3 Sampling CWD Along the Transects Which CWD to measure Measure the following along the transects: All pieces of CWD greater than 7.5 cm in diameter (or an equivalent area at the crossing of 44.2 square centimetres measured perpendicular to their length for odd shaped pieces) where the centreline is crossed by the vertically projected transect. Fallen or suspended (not self-supporting) dead tree boles, with or without roots attached, that intercepts the vertically projected sample line whether the transect passes above or below the CWD (Figure 8.3). CWD may be suspended on nearby live or dead trees, other coarse woody debris, stumps, or other terrain features. Visually estimate un-measureable suspended CWD at the intercept point. Suspended CWD Horizontal Tilt angle in degrees Plot Centre Transect Figure Measuring Suspended CWD Fallen trees with green foliage if they are no longer rooted to the ground. Large fallen branches and fallen broken tree tops, horizontal or leaning. Pieces that are physically attached (lengthwise) are considered to be one piece. Recently cut logs. Uprooted (not self-supporting) stumps greater than 7.5 cm in diameter and less than 1.3 metres in length, and any exposed dead roots greater than 7.5 cm. CWD that lies above the soil (Figure 8.4). CWD is considered no longer above the soil when it is entirely buried beneath a layer of surface organic matter (forest floor) or mineral soil. March
204 Does not qualify as CWD Qualifies as CWD Surface organic matter Mineral Soil Figure Side View of Partially Buried Coarse Woody Debris Do not measure the following: live or dead trees (still rooted) which are self-supporting dead branches still connected to standing trees exposed roots of self supporting trees self-supporting stumps or their exposed roots a piece is no longer considered CWD when the wood is decomposed to the point where it could be described as forest floor humus. Determining in or out CWD To be measured the CWD piece must be greater than 7.5 cm in diameter (or equivalent) at the point where the line transect crosses the centreline. The centreline is the midline of any section of wood (Figure 8.5 and 8.6.), and may not correspond to the pith. Centrelines > 7.5 cm out out out > 7.5 cm diameter Figure Centreline of a CWD Piece (Top View) If the sample line appears to follow the centreline of the CWD, decide whether it is measured (transect line crosses centreline of CWD) or not measured (transect line does not cross centreline). If the sample line is close to the centreline at the end of the CWD, decide whether it is measured (transect line crosses centreline of CWD ) or not measured (transect line does not cross centreline). 188 March 2018

 CLASS OTHER (OPTIONAL) TILT ANGLE MERCHANTABLE P/R DECAY CLASS FOR PIECE Record tree species at the level it is reliably known. See Code Table below.")
205 If the sample line is close to the centreline at the end of the CWD, decide whether it is measured (transect line crosses centreline of CWD) or not measured (transect line does not cross centreline). Figure Measuring CWD Near the Centreline of the Piece (viewed from above) Measuring CWD in the Standard Transect Section For each CWD record the following: SPECIES DIAMETER LENGTH (OPTIONAL) % DECAY CLASS 1 (OPTIONAL) CLASS OTHER (OPTIONAL) TILT ANGLE MERCHANTABLE P/R DECAY CLASS FOR PIECE Record tree species at the level it is reliably known. See Code Table below. Record the diameter (to nearest 0.1 cm) perpendicular to the point where the transect crosses the centreline of the CWD. For non-circular pieces, record in the Accumulation and/or Odd-shaped Pieces by a different method. Note the length of the piece of CWD. Record the percentage of Class 1 wood at the transect crossing. Record the decay class of the remaining percentage at the transect crossing. Measure the tilt angle of the piece, in degrees. Note if the piece is merchantable (X grade or better). Note if the CWD is a product likely to be removed (P/R). Record the decay class of the CWD piece. March
 unknown")
206 SPECIES 1. Record the tree species using the approved tree species code from the BC Tree Code List. 2. If the species or genus cannot be determined, record the best available information as follows: Zc _ Xc _ Zh _ Xh _ X other conifer not on the list (record species name in Comments section) unknown conifer other hardwood not on the list (record species name in Comments section) unknown hardwood unknown (you cannot determine if it was conifer or deciduous) DIAMETER 1. Record (to nearest 0.1 cm) the diameter (or equivalent) of the CWD perpendicular to the bole at the point where the transect crosses the CWD (Figure 8.7). Figure Measuring Diameter of Circular CWD Cross Sections 2. If the sample line intersects a curved or angular CWD more than once, measure each intersection as a separate observation, as shown in Figure 8.8. Figure The Sample Line Intersects the CWD More Than Once 190 March 2018
207 3. If the diameter cannot be measured, estimate it. 4. If the cross section is oval rather than circular estimate an equivalent diameter that will more accurately suggest the cross-section area. If the cross section is hard to express as a circle (or equivalent to a circle), refer to the procedures for measuring odd-shaped CWD. 5. Estimate an equivalent diameter for the remaining portion of CWD where part of the wood has decayed and become part of the soil layer. 6. If a log has split open but is still partially held together, record the equivalent diameter as if the piece were whole. If a stem has shattered into a number of distinct unconnected pieces, record each piece that is larger than 7.5 cm in diameter at the point of sampling. 7. If the CWD is hollow, estimate the diameter equivalent to the remaining wood. LENGTH For the Provincial VRI, the measurement of piece length is not required. A field has been left on the field card in case specific projects require length measurements for other purposes. % Decay Class 1 (at the Transect Crossing) (This is optional as of field season 2012) All CWD cross sections will be assessed a percentage decay class 1. The decay classes are shown in Table 8.1. Determine the percentage decay class 1 by probing the CWD close to the point of intersection with an axe (do not destroy the CWD at the line intercept) Record the percentage of decay class 1 If decay class 1 equals 100%, record as If decay class 1 equals 0%, record as 00 Note: Percentage decay class 1 is an estimate across the cross section, not for the CWD as a whole. Decay class 1 is equivalent to wood commonly referred to as sound which is suitable for lumber or chips (regardless of the length or diameter). CLASS OTHER (AT THE TRANSECT CROSSING) (This is optional as of field season 2012) Record the decay class of the remaining percentage of the CWD piece cross section using the classification scheme shown in Table 8.1. The emphasis is on the wood texture. Other criteria, such as portion on the ground, twigs, bark, shape, and invading roots, are guidelines to the wood texture. March
208 Table 8.1 Coarse woody debris decay classes CLASS 1 CLASS 2 CLASS 3 CLASS 4 CLASS 5 WOOD TEXTURE intact, hard intact, hard to partly decaying hard, large pieces, partly decaying small, blocky pieces many small pieces, soft portions Other associated characteristi cs PORTION ON GROUND elevated on support points elevated but sagging slightly sagging near ground, or broken all of log on ground, sinking all of log on ground, partly sunken TWIGS < 3 cm (if originally present) twigs present no twigs no twigs no twigs no twigs BARK bark intact intact or partly missing trace bark no bark no bark SHAPE round round round round to oval oval INVADING ROOTS none none in sapwood in heartwood in heartwood 192 March 2018
209 TILT ANGLE The tilt angle is the angle, measured in degrees, between the central axis of the CWD and the horizontal plane at the crossing point (Figure 8.9). Tilt angle at crossing point transect diameter horizontal side view Figure Measuring the Tilt Angle of CWD Pieces Measure the angle the CWD makes from the horizontal, regardless of the slope of the ground. Normally you can place a clinometer on the top surface of the CWD at the point of the intercept and record the angle in degrees. MERCHANTABILITY If the CWD is an X grade or better, record it appropriately. An X grade or better may potentially be harvested. PRODUCT TO REMOVE P/R This procedure is designed to accommodate wood that might be removed from the site. If the piece is expected to be removed as product (for example, blowdown which is scheduled for harvest, shakeblocks or felled and bucked material), record.an X in the P/R Column. This does not include a merchantable piece that is expected to be left on site. DECAY CLASS FOR PIECE Record the class for the entire CWD piece using the classification scheme shown in Table 8.1. Decay Class is based on the wood texture. Assess the conditions along the entire piece length to determine Class on the basis of volume. Other criteria, such as the portion on the ground, twigs, bark, shape, and invading roots, are guidelines to the wood texture. March
210 Measuring Odd-Shaped CWD Record any odd-shaped CWD encountered in the appropriate section of the field card. Note: It is important that any CWD that is not round or oval in cross section be recorded in this category. A different volume compilation formula is used because the measurement is made along the transect line, not at right angles to the centreline of the CWD. 1. Record the species of the CWD. 2. Measure the full horizontal length and average vertical depth of the CWD along the transect (this gives a rectangular area equivalent to the cross section along the transect). the length is the full distance along the line intersect (shown as L in Figure 8.10). the depth of the cross section is the average depth along the line intersect (shown as D in Figure 8.10). Note: It is incorrect to measure the length and width, average the values, and record it as a circular cross section. Example: An odd-shaped CWD is 25 cm x 40 cm. Consider the cross section as a rectangle and record the 25 and 40 in the accumulations section. Record the other information in the same way as in the standard transect section for round pieces. Top view Measure full length along transect L transect Cross section along the transect D Average depth Figure Measuring the Horizontal Length and Vertical Depth of Odd-Shaped CWD Measuring Accumulations In heavy accumulations that cannot be safely or accurately measured, record an estimate of the depth and length of the accumulation. 194 March 2018

211 1. Record the full horizontal length of the line intercept through the accumulation, and the average vertical depth of the accumulation. Visually compress the pile to measure the actual cross sectional area of wood, not the space between the pieces, as shown in Figure Identify and record species, as possible. If the mixture of species is complex or too difficult to identify, record the following: Zc _ Xc _ Zh _ Xh _ X other conifer not on the list (record species name in Comments section) unknown conifer other hardwood not on the list (record species name in Comments section) unknown hardwood unknown (you cannot determine if it was conifer or deciduous) 3. If species can be determined, estimate the proportion of each, and record length and depth for each species separately. Note: This horizontal and vertical cross section is the part which is along the transect line, not the average of the entire pile, and CWD described in this way is treated as rectangular in cross section. 4. For each species, record the other information in the same way as in the standard transect section. Figure Measuring an Accumulation of Coarse Woody Debris March