What explanations for the productivity of temperate agroforestry systems?
|
|
|
- Audra Floyd
- 5 years ago
- Views:
Transcription


1 What explanations for the productivity of temperate agroforestry systems? Christian Dupraz Aurélie Querné Grégoire Talbot Lydie Dufour INRA, UMR System, Montpellier

2 To mix or not to mix trees and crops
 = RY tree + RY crop Same production Less land with mixtures if")
3 An indicator of the productivity of mixtures Land Equivalent Ratio LER (Mead and Willey, 1980) LER = Sum (Relative Yields) = RY tree + RY crop Same production Less land with mixtures if LER>1

4 Indicators of the productivity of mixtures LER = 1 : no advantage in mixing plants Common observed values : 0.9 to 1.2 for mixtures of annual species 1.0 to 1.25 for legumes/non legumes species What about mixtures of trees and crops?


5 LER = 1 LER > 1? Question centrale pour l axe 2 de l UMR LER >> 1?
6 Measured LER 1.36 Poplars-winter cereals, 14 years rotation
7 Predicted modelled LER 1.2 to 1.6 LER=1.6 LER=1.4 LER=1.2 LER=1.0 Tree density Pruning height Tree row orientation
8 Part of the new ecologically intensive green revolution? IF LER = 1.4 A 100 ha farm that would adopt agroforestry will produce as much as a 140 ha farm that would grow separately trees and crops But it takes time until you harvest the first trees!
9 Caution! Many reports on crop productivity in alley-cropping, but almost no assessments of final LER of the system Many wrong claims of LERs based on partial measurements during limited years and/or AF systems not typical (e.g. obtained by thinning forest plots) Annual LERs of young agroforestry stands may be high, but should not be extrapolated without care
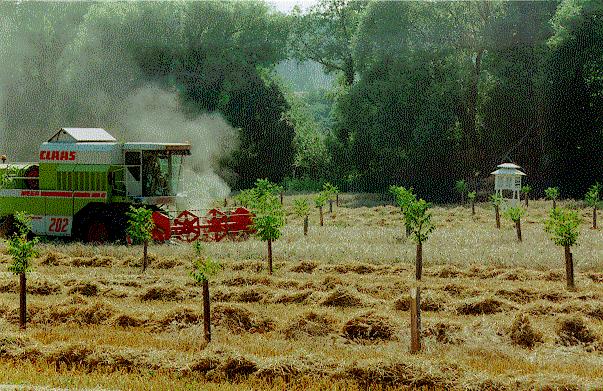
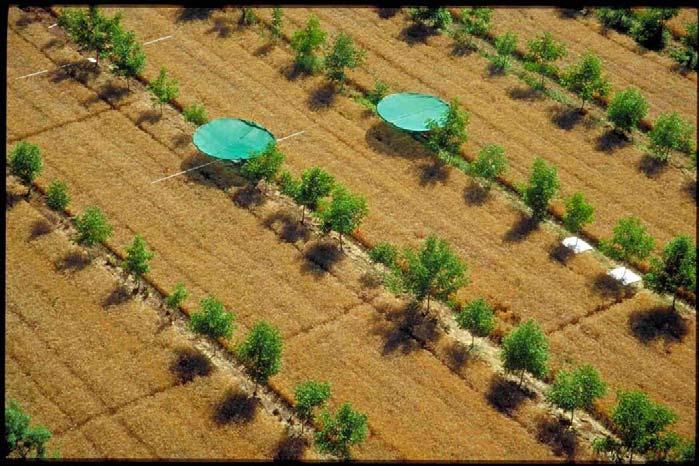
 Cereals and canola")

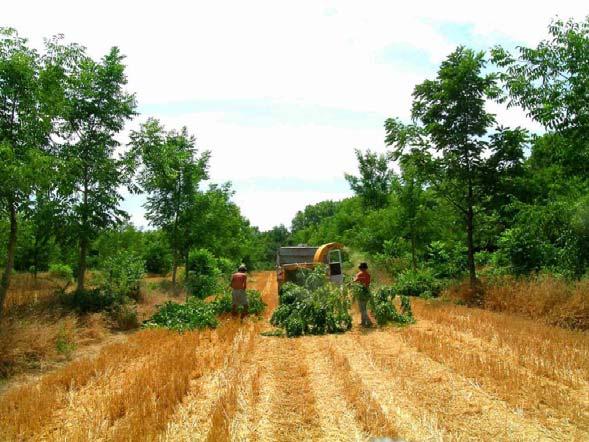
10 The Vézénobres agroforestry test site (14 years) Cereals and canola intercrops from 1996 to 2007 Tree harvest in December 2009 F AF AF F A

11


12


13

14

15


16


17

18
19 Measured dynamics of the yields in the poplar-wheat system at Vézénobres 1.6 Yearly LER Crop RY Tree RY 1.6 Final LER Integrated LER Integrated Crop RY Integrated Tree RY Annual values Integrated values
20 Modelled dynamics of the poplar-wheat system at Vézénobres Crop stopped when RY crop < 40% If (as a consequence of tree competition) the crop yield falls under a threshold, cropping may no longer be profitable. This reduces the final LER value.
21 LER interpretation LERs are «black box» indicators But LERs can be calculated with a process-based model Such simulations allow to decompose the LER in various interacting effects This is a way to hierarchy factors of success/failure in agroforestry systems
22 Example of a LER decomposition on a Walnut-Wheat system
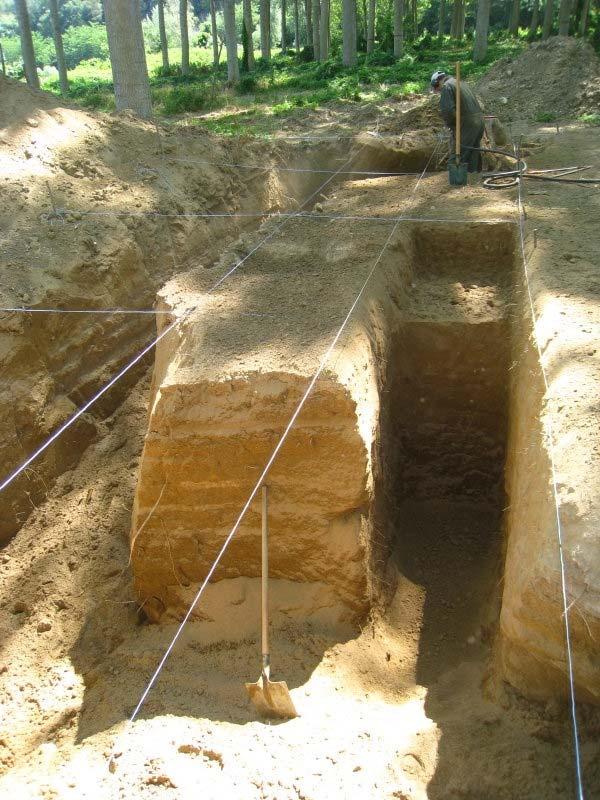
23 The Restinclières agroforestry test site

24 Walnut trees winter cereals 40 Year rotation 1.2 to 1.8 Tree earlyness LERs Predicted by models Wheat variety Groundwater availability

25 Light capture in 40 years as predicted by the model Crop AgroForestry Forestry
 0 200 400 600 800 1000 drainage runoff Soil")

26 Water capture in 40 years as predicted by the model amount of water (mm/year) drainage runoff Soil evapo Crop drainage runoff Soil evapo Crop Trees C AF F drainage runoff Soil evapo weeds Trees Groundwater depth varies between 1 and 4 m
27 OK, complementarity and possibly facilitation are at work. But what processes? No simple way with field measurements Controversial issue! Light? Water? Nitrogen? When? Is AF better adapted to Southern or Northern latitudes??? Deep or superficial soils? With or without a water-table? With winter or summer crops?
28 Suggested methodology : dynamic decomposition of the LER Requires a process-based model that provides details of light, water, Nitrogen, Carbon dynamics in the system Possible on year increment data (annual) or in cumulative increment data (integrated) -> Talbot et al, 2010, in prep. Check Poster Talbot et al. This congress
29 Decomposing the LER LER= RY tree + RY crop RY =π[relative indexes] Exemple of decomposition RY = Relative density x Memory (Leaf area / size) x Light capture x Water capture x Harvest Index

30 Decomposing the final LER Tree Crop LER RY Relative density Relative Size memory Relative Light competition Relative Water competition Relative Harvest index
31 Decomposing the final Tree RY Tree Interpretation Comments RY 0.52 Tree dominant Relative density RD 0.36 RY > RD Tree dominant Relative Memory Major (feed forward effect) Relative Light competition Relative Water competition Significant : less shade from tree to tree Not significant : AF and F trees experience same Water Stress Relative Harvest index Negative : AF trees invest less in the trunk Value > 1 = [AF tree > F tree]
32 Decomposing the final Crop RY RY 0.86 Crop Interpretation Comments Relative density RD 0.93 RY < RD Crop dominated Size / Memory 1.03 o Few memory effect Light competition Major negative effect Water competition Shaded crops protected Harvest index Slightly improved Value > 1 = [AF crop > Monocrop]
33 Hierarchy of components of the final LER Tree Crop Multiplicative Component Predicted RY = Relative density X Size memory X Light X competition Water competition X Harvest Index
34 If the model is right Component AF Advantages AF Drawbacks Indifferent Trees Memory = Larger canopies Invest more C in roots and branches Water stress Reduced intertree competition for light Crops Mitigated water stress Less light No memory Increased harvest index Integrated over 40 years But what dynamics during the 40 years?
35 Land Equivalent Ratio 2,0 1,8 1,5 1,3 1,0 0,8 0,5 0,3 0,0 Annual Integrated Years
36 Exploring RYs deeper Time dynamics of relative components documented First order relative components can be decomposed again following the model formalisms This allows to make a dynamic analysis of the system performances (When what?) This could help to improve both the design and the management of AF systems (new cropping schemes)
37 Exploring RYtree deeper Light competition Memory Dynamic First order decomposition of RY tree Harvest index Water stress Integrated Annual
38 Exploring RYcrop deeper Nitrogen stress Harvest index Light conversion Dynamic First order decomposition of RY crop Water stress Light competition Annual Integrated
39 and deeper. Heat excess during grain filling Grain filling stage duration Years Grains number Second order decomposition of the Harvest Index Protection against excess heat during grain filling essential when the trees are large medium-sized Increased grain filling stage length important (slow senescence) Impact on grain number negligible with late leafing walnut
40 We can go as deep as The conceptual model goes! But not deeper. However, the decomposition allows to quantify effects that result from the dynamic run of the model and therefore from various interactions, feedback and feed-forward controls (in 3D if the model used is in 3D).
41 System optimisation assisted by the model
42 System optimisation assisted by the model Tree line orientation North-South / East-West Pruning height : 10 / 6 m 133 trees.ha trees.ha -1 Tree density Querné et al, in prep
43 System optimisation assisted by the model NS EW NS EW Tree line orientation North-South / East-West LER Pruning height : 10 / 6 m 133 trees.ha trees.ha -1 Tree density 6 Replications = different climate time series built with the same observed data (no climate change) Querné et al, in prep
44 Deeper inside the model For the same 50% light availability, simulated RYcrop varied from 50 to 100% Process-based explanations can be found by looking at specific years Nitrogen or heat stress on the monocrop did explain such high RYcrops, indicating when AF systems may induce stability and/or resilience in crop yields Relative crop yield Tree plantation 133 trees.ha trees.ha -1? Tree harvest Relative light availability 8 scenarii x 3 climate replications
45 Looking for facilitation RYcrop biomass RYtree biomass Evidence of facilitation not that conclusive so far. Complementarity first!
46 Conclusions Association Plant Cycles Soil depth Walnut-cereal on plains with water table Almost complementary Root segregation Water body in summer Probable LER Deep High Yes 1.5 Sorbus-wheat Lagged Medium Intermediate No 1.4 Prunus-Medicago Close Deep Intermediate No 1.3 Prunus-sunflower Synchronous Shallow Poor No 1.2 Populus-maize Synchronous Poor No Yes 1.1 Evergreen tree and summer crop Superposed Any Variable No 1.0 Never experimentally evidenced nor modelled so far <1.0 A synthesis of probable LERs of temperate AFs
47 Conclusions LERs of AFs may be extremely high (contribution to a second green revolution?) Only process-based models may help in interpreting productivity results of AF systems at various time steps. Models may help to design and manage systems Validation of models required (Graal) Models tell only about what is incorporated in the model but reveal more (integration in time and space)
48 Conclusions LERs and LER decomposition are site-specific : beware of unsafe extrapolations On going simulation (in silico) studies : Tree and crop phenology (early-late varieties of trees and crops) Water table availability and depth fluctuations Soil water reserves (deep versus shallow soils) Climate change?

49 Now available but sorry, it s in French Contact : Christian Dupraz Lydie Dufour

50 Merci pour votre attention