South Dakota's Forest Resources in 2002
|
|
|
- Sabrina McKinney
- 5 years ago
- Views:
Transcription


1 United States Department of Agriculture Forest Service North Central Research Station South Dakota's Forest Resources in 2002 Ronald J. Piva, Douglas Haugan, Gregory J. Josten, and Gary J. Brand Resource Bulletin NC - 230
2 North Central Research Station U.S. Department of Agriculture - Forest Service 1992 Folwell Avenue Saint Paul, Minnesota
3 CONTENTS Results Area Volume Biomass Forest Health Summary Appendix Inventory Methods Sampling Phases Phase Phase Phase Literature Cited Table Titles Tables
4
5 South Dakota s Forest Resources in 2002 The North Central Research Station s Forest Inventory and Analysis (NCFIA) program began fieldwork for the fifth forest inventory of South Dakota s forest resources in This inventory initiated the new annual inventory system in which one-fifth of the field plots (considered one panel) in the State are measured each year. A complete inventory consists of measuring and compiling the data for all plots (or five panels). Once all panels have been measured, each will be remeasured approximately every 5 years. For example, in South Dakota, the field plots measured in 2002 will be remeasured in In 2002, NCFIA continued the annual inventory effort with the second panel of the fifth forest inventory. This fifth inventory of South Dakota s forest resources will be completed in However, because each year s sample is a systematic sample of the State s forests and because timely information is needed about South Dakota s forest resources, estimates have been prepared from data gathered during the first 2 years of the inventory. Data presented in this report represent 40 percent of the field plots (or two panels) for a complete inventory and are a combination of the first year s panel from 2001 and the second year s panel from An earlier report for the 2001 panel also has been published (Leatherberry et al. 2003). Results presented are estimates based on sampling; estimates were compiled assuming that the 2001 and 2002 data represent one sample. As additional annual inventories are completed, the precision of the estimates will increase and additional data will be released. Reports of previous inventories of South Dakota are dated 1936, 1962, 1984, and Data from new inventories are often compared with data from earlier inventories to determine trends in forest resources. However, for the comparisons to be valid, the procedures used in the two inventories must be similar. As a result of our ongoing efforts to improve the efficiency and reliability of the inventory, several changes in procedures and definitions have been made since the last South Dakota inventory in 1996 (Leatherberry et al. 2000). One significant change is that the border-toborder inventory of forest resources in South Dakota is now being handled by one FIA unit instead of two. Before 1996, both the NCFIA and the Interior West FIA (IWFIA) program (formerly the Intermountain FIA program) in Ogden, UT, inventoried South Dakota s forest resources. The NCFIA program inventoried South Dakota east of the 103rd meridian and the IWFIA program inventoried the State west of the 103rd meridian including the Black Hills National Forest (BHNF). In 1996, the NCFIA program inventoried all of South Dakota except for the BHNF, which was inventoried by IWFIA in 1999 (DeBlander 2002). The portion of the Custer National Forest located in South Dakota was inventoried again by IWFIA in 1997 (DeBlander 2001). Different designs and methods have been used in various South Dakota inventories, making it inappropriate to directly compare portions of the 2002 data with data published earlier. Therefore, few comparisons are made with data from the other South Dakota inventories. Where comparisons are made with published data from past inventories, they are done only to suggest the direction of change. About the Authors: Ronald J. Piva is a Forester with the North Central Research Station, St. Paul, MN; Douglas Haugan is a Senior Forester/GIS Specialist with the South Dakota Department of Agriculture, Resource Conservation and Forestry Division, Pierre, SD; Gregory J. Josten is a Senior Forester/Stewardship Prorams with the South Dakota Department of Agriculture, Resource Conservation and Forestry Division, Rapid City, SD; and Gary J. Brand is a Research Forester with the North Central Research Station, St. Paul, MN. 1

6 RESULTS Area In 2002, there were an estimated 1.7 million acres of forest land in South Dakota, accounting for almost 4 percent of the State s total land area. Forest land is land that is at least 10 percent stocked by forest trees of any size, or formerly having had such tree cover, and not currently developed for nonforest use. The minimum area for classification of forest land is 1 acre. Roadside, streamside, and shelterbelt strips of timber must have a crown width at least 120 feet wide to qualify as forest land. Sixty-eight percent, or 1.2 million acres of the forest land in the State, is publicly owned (table 1). The majority of the public land in the State is west of the Missouri River. There are three major areas of natural forests in South Dakota (Ball and Erickson 1998). The Black Hills forest, the largest area of forest land in the State, is composed primarily of ponderosa pine but also includes quaking aspen, Black Hills spruce (a variety of white spruce), paper birch, and bur oak. The second largest area of forest land is the flood plain forest that occurs along the Missouri River. American elm and green ash are the major species found in these forests. Bur oaks found along the upper terraces and draws of rivers, and in the Northern Black Hills account for the third largest area of forest land in the State. Other forested areas in South Dakota are the cottonwood forests scattered along the rivers and streams throughout the State and the maple and basswood forests of the upland forests on the eastern side of the State. Timberland accounted for 92 percent of the forest land in South Dakota in Timberland is forest land that is producing, or is capable of producing 20 cubic feet of wood per acre per year under natural conditions and is not restricted from harvest. Throughout most of the 20th century, the area of timberland in South Dakota remained relatively stable, rising and falling from between 1.5 and 1.7 million acres (fig. 1). The prospective increase between 1996 and ,800 1,500 Thousand acres 1, Year Figure 1. Area of timberland, South Dakota, (Note: The 1936 area may contain some area of forest land that does not classify as timberland. Sample errors are not provided for the 1936 and 1984 inventories because no single statewide sample error is available for those inventories. The 1962 and 2002 estimates are for total timberland area; the sample error associated with the 1996 estimate is calculated for timber area outside of 2 the BHNF. Sample error is represented by the vertical line at the top of each bar.)

, and the estimate is likely to change as more data are collected in ensuing annual inventories.")
7 may be due to a definitional change. Previously, forest lands that were being grazed or used as windbreaks were classed as nonforest with trees; now such lands are classed as forest land if they meet the definitional standards for size, width, and stocking. The 2002 timberland area estimate is also based on a partial inventory (two panels of five), and the estimate is likely to change as more data are collected in ensuing annual inventories. Nearly 70 percent of the timberland in the State is publicly owned (table 2). The USDA Forest Service, through the Black Hills and Custer National Forests, holds the majority of public timberland. Owners of less than 100 acres of timberland hold most of the private timberland in the State (Leatherberry et al. 2000). Those holdings are generally associated with farm or ranch operations. Native American tribal groups own an estimated 93 thousand acres of timberland held as tribal trust land within the boundaries of reservations in South Dakota (Haugen and Hansen 2002). The ponderosa pine forest type accounted for more than three-quarters of the total timberland area in South Dakota in 2002 (fig. 2). Overall, the softwood forest types combined accounted for more than 80 percent of the total timberland area in the State. The elm/ash/cottonwood forest type group occupied the second largest area of timberland but accounted for only 8 percent of the total. Although virtually all of the timberland area in South Dakota is of natural origin, South Dakota residents have a long history of planting trees. Most of these plantings are associated with windbreaks, shelterbelts, or farmstead plantings and do not meet the area or width requirements to be classified as timberland. Many of the earlier efforts to establish tree plantations failed or were abandoned. As South Dakota s forests mature and are affected by natural and human-caused events, they take on certain stand-size characteristics. Stand-size class is a measure of the average diameter of the dominant trees in a stand. Oak/hickory 3% Elm/ash/ cottonwood 8% Aspen/ birch 3% Maple/beech/ birch 3% Nonstocked 2% Spruce/fir <1% Ponderosa pine 77% Pinyon/ juniper 4% Figure 2. Area of timberland by forest type, South Dakota,

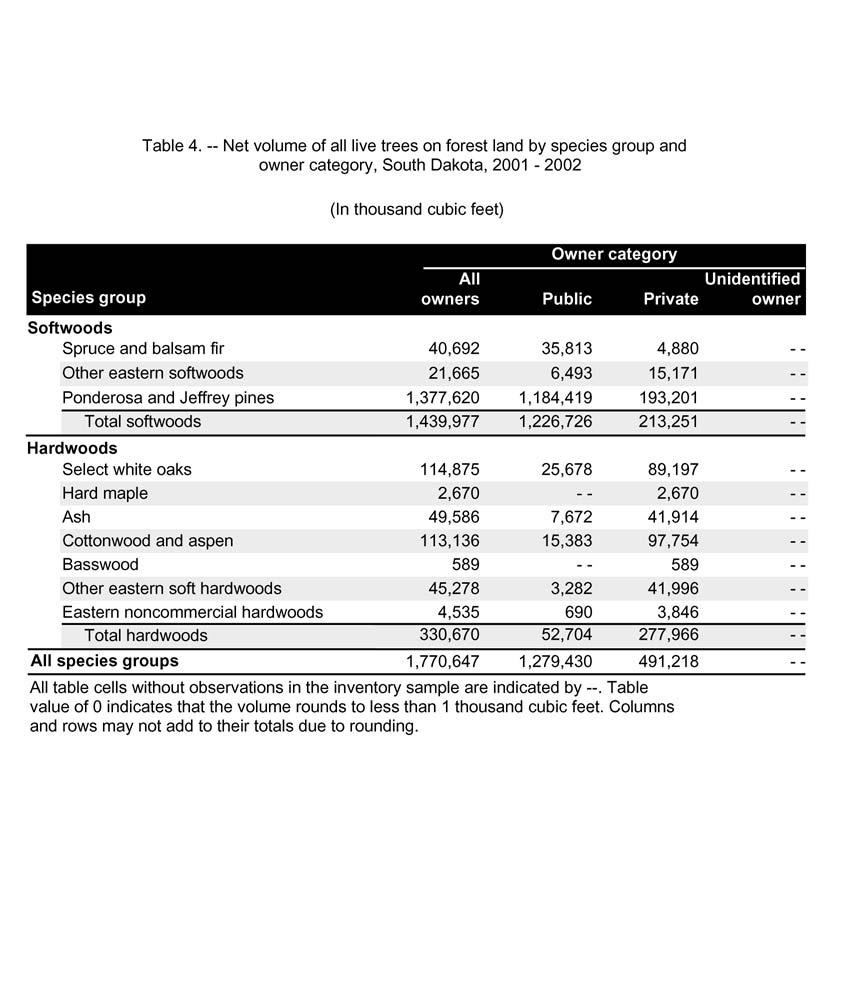
8 There are four stand-size classes: sawtimber large trees, softwoods at least 9 inches in diameter at breast height (d.b.h.) and hardwoods at least 11 inches d.b.h.; poletimber medium trees 5 inches d.b.h. to sawtimber size; sapling-seedling small trees, softwoods at least 6 inches tall and hardwoods at least 1 foot tall, to poletimber size; and nonstocked stands. In 2002, sawtimber stands occupied over 1 million acres of timberland, or nearly two-thirds of the timberland area (table 3). Seedling/sapling stands accounted for 18 percent of the timberland area, followed by poletimber-size stands on 14 percent of timberland area. Nonstocked timberland occupied less than 2 percent of the total timberland area. The predominance of sawtimber-size stands reflects the presence of larger diameter ponderosa pine in the BHNF, and older, largediameter, bottomland hardwood stands. Since South Dakota s forest inventory in 1996 and the BHNF inventory in 1999, the area of sawtimber-size stands has increased by almost 180 thousand acres and the area of poletimber-size stands has decreased by just over 170 thousand acres (fig. 3). The area of seedling-sapling-size stands increased by 45 thousand acres over the same period. This increase in sawtimber-size stands and subsequent decrease in poletimber-size stands may be the result of poletimber-size trees naturally increasing in diameter and moving into the larger size class, while the diameter of overstocked doghair ponderosa pine, seedling-sapling stands stagnates, and thus not grow into the next size class. Ensuing panels of the fifth South Dakota inventory will provide information for more definitive conclusions about forces driving the changes in stand-size class. Volume South Dakota s net volume of all live trees on forest land totaled 1.8 billion cubic feet in 2002 (table 4). Over three-fourths of this volume is from one species ponderosa pine. All the hardwoods species combined accounted for less than 20 percent of the total volume of all live trees on forest land. Growing-stock trees on timberland accounted for over 90 percent (1.6 billion cubic feet) of the live tree volume on forest land. A growing-stock tree is a live tree of commercial ,200 1,000 Thousand acres Sawtimber Poletimber Seedling-sapling Nonstocked Stand-size class Figure 3. Area of timberland by stand-size class, South Dakota, 1996 and
.")
9 species that meets specified standards of size, quality, and merchantability. Besides growingstock volume, there were an additional 41 million cubic feet in live cull trees and 11 million cubic feet of salvable dead trees on timberland in South Dakota (table 5). Over two-thirds of the live cull volume on timberland came from hardwood species. All of the salvable dead volume on timberland came from softwood species. Only 1 percent of the growing-stock volume from the softwood forest type groups was made up of hardwood species (table 6). Conversely, more than 10 percent of the growing-stock volume from hardwood forest types was made up of softwood species. The minor amount of growing-stock volume from timberland that was nonstocked came from hardwood species. Over 80 percent (1.3 billion cubic feet) of the growing-stock volume on timberland came from ponderosa pine (fig. 4, table 7). The cottonwood and aspen species group contained the second largest volume of growing stock but still only accounted for less than 7 percent of the total volume. Between 1996 and 2002, while ponderosa pine and spruce growingstock volumes decreased in South Dakota, eastern redcedar volume (as reflected in the pinyon/juniper forest type group and in the other eastern softwoods species group) appeared to increase. There were 6.2 billion board feet of sawtimber in South Dakota in 2002 (table 8). Sawtimber volume is the volume of wood in the saw log portion of sawtimber-size trees. More than half of the sawtimber volume came from the sawtimber-size trees less than 15 inches d.b.h. Biomass All live aboveground tree biomass on timberland in South Dakota was estimated at 30.5 million dry tons in 2002 (table 9). This averages to over 19 dry tons of biomass per acre of timberland. Biomass is the amount of total wood and bark (excluding foliage) of trees 1.0 inch d.b.h or larger, including all tops and limbs. Biomass is an important measure because it provides information that can be used for analyses related to carbon sequestration, wood fiber availability for fuel, and other uses. In 2002, 92 percent of the total biomass was in growing-stock trees, 5 percent came from saplings between 1.0 and 5.0 inches d.b.h., and the remaining 3 percent came from non-growing-stock trees (cull trees and noncommercial species). Almost 93 percent of the Million cubic feet 1,800 1,600 1,400 1,200 1, Ponderosa pine Other softwoods Cottonwood and aspen Species group Other hardwoods Figure 4. Growing-stock volume in South Dakota, 1996 and
10 total biomass from live trees on publicly owned timberland was from softwood species. More than 84 percent of the softwood biomass in the State is found on these public lands. Hardwood biomass, on the other hand, is mostly privately owned with more than threefourths of the total live hardwood biomass in private ownership. Forest Health Although South Dakota is mostly prairie and cropland, forests are an important component of the landscape. Currently, the primary concerns for South Dakota s forests are wildfire, the mountain pine beetle, and the pine engraver beetle (Ball and Harris 2003). Drought in 2000, 2001, and 2002 caused severe wildfire conditions in South Dakota. Over 370 wildfires occurred in South Dakota in 2002 and burned 21,810 acres of forest and range lands. In 2002, two large wildfires in the Black Hills near the communities of Deadwood and Rapid City burned a total of 24,471 acres. Extensive ponderosa pine mortality has occurred throughout the Black Hills due to a bark beetle, the mountain pine beetle (Dendroctonus ponderosae). The majority of the infestations are confined to BHNF lands, but as available host trees are killed, the large beetle populations are expanding to surrounding forest ownerships. By 2002, mountain pine beetle had affected approximately 15,000 acres of private forest land. The Sturgis watershed area was hardest hit by the beetle epidemic, and logging is in progress to reduce the forest s susceptibility to attack and remove infested trees. Thinning is also planned to increase tree vigor and health and to reduce the fire hazard. interface being one of the areas hardest hit. The population has been increasing in recent years due to the increase in suitable hosts: trees that have been injured or killed by fire, severe snow, or hail storms. A more complete discussion of forest health issues that have affected South Dakota forests since the last complete forest inventory is available at: 02/sd/sd_02.htm. Summary In summary, South Dakota s timberland area has remained relatively stable at about 3 percent of the total land area. Ponderosa pine, found mostly in the Black Hills, is the predominant forest type group. Eastern redcedar appears to be expanding in the State, but it is still a minor portion of the total area and volume. As additional data become available from ensuing annual inventories, a clearer picture of the direction of South Dakota s forests will emerge. Additional data related to the two most recent inventories of South Dakota (1980 and 1996) are available at: Another bark beetle causing significant amounts of ponderosa pine mortality in the Black Hills is the pine engraver beetle (Ips pini). In 2002, the pine engraver beetle affected approximately 25,000 acres of private forest and urban lands, with the wildland-urban 6
11 APPENDIX Inventory Methods Since the 1996 inventory of South Dakota s forest outside the Black Hills National Forest (BHNF), several changes have been made in NCFIA inventory methods to improve the quality of the inventory as well as meet increasing demands for timely forest resource information. The most significant difference between inventories is the change from periodic inventories to annual inventories. Historically, NCFIA periodically inventoried each State on a cycle that averaged about 12 years. However, the need for timely and consistent data across large geographical regions, combined with national legislative mandates, resulted in NCFIA s implementation of an annual inventory system. The annual inventory system began in South Dakota in At that time, the NCFIA program assumed responsibility for inventorying all forest lands in South Dakota. With an annual inventory system, approximately one-fifth of all field plots are measured each year. After 5 years, the entire inventory cycle will be completed. After the initial 5-year cycle, NCFIA will report and analyze results as a moving 5-year average. For example, NCFIA will be able to generate a report based on inventory results for 2001 through 2005 or for 2002 through Although there are great advantages to an annual inventory, one difficulty is reporting on results in the first 4 years. With the 2002 inventory, only 40 percent of all field plots have been measured. Sampling error estimates for the 2002 inventory results are 6.09 percent for area of forest land, 6.22 percent for area of timberland, percent for number of growing-stock trees on timberland, 7.79 percent for volume of growing stock on timberland, and 8.69 percent for volume of sawtimber on timberland. These sampling error estimates are much higher than those for the last periodic inventory completed in 1996 (i.e., 3.8 percent for timberland area outside the BHNF and 4.2 percent for growing-stock volume outside the BHNF) because of the smaller samples. Thus, caution should be used when drawing conclusions based on this limited data set. As we complete ensuing measurements, we will have additional confidence in our results because of the increased number of field plots measured. As each measurement year is completed, the precision of estimates will improve. Other significant changes between inventories include the implementation of new remote sensing technology, the implementation of a new field plot design, and the gathering of additional data. The advent of remote sensing technology since the previous inventory in 1996 has allowed NCFIA to use computerassisted classifications of Multi-Resolution Land Characterization (MRLC) data and other remote sensing products to stratify the total area of the State and to improve the precision of estimates. Previous inventories used manual interpretation of aerial photos to stratify the sample. New algorithms were used in 2002 to assign forest type and stand-size class to each condition observed on a plot. These algorithms are being used nationwide by FIA to provide consistency among States. The list of recognized forest types, grouping of these forest types for reporting purposes, models used to assign stocking values to individual trees, definition of nonstocked, and names given to the forest types changed with the new algorithms. As a result, comparisons between the published 1996 inventory results and those published for the 2002 inventory may not be valid. For additional details about algorithms used in both inventories, please contact NCFIA. Sampling Phases The 2002 South Dakota survey used a threephase inventory. The first phase used classified satellite imagery to stratify the State and 7
12 8 aerial photographs to select plots for measurement. The second phase entailed measurement of the traditional FIA set of mensurational variables, and the third phase focused on a set of variables related to the health of the forest. The only land that could not be sampled was private land where field personnel could not obtain permission from the owner to measure the field plot, and plots that could not be accessed because of a hazard or danger to field personnel. The methods used in the preparation of this report make the necessary adjustments to account for sites where access was denied. Access was denied to only one plot in 2001 and only four plots in In each of 2001 and 2002, part of one plot was too hazardous to establish. Phase 1 The 2002 South Dakota inventory used a computer-assisted classification of satellite imagery. FIA used the imagery to form two initial strata forest and nonforest. Pixels within 60 m (2 pixel widths) of a forest/nonforest edge formed two additional strata forest/nonforest and nonforest/forest. Forest pixels within 60 m on the forest side of a forestnonforest boundary were classified into a forest/nonforest stratum. Pixels within 60 m of the boundary on the nonforest side were classified into a nonforest/forest stratum. The estimated population total for a variable is the sum across all strata of the product of each stratum s estimated area and the variable s estimated mean per unit area for the stratum. Stratification and estimation were conducted by FIA Inventory Unit. The Eastern Forest Survey Unit was stratified into nonforest, nonforest/forest edge, and forest and forest/nonforest edge combined; the Western Forest Survey Unit was stratified into nonforest, nonforest/forest edge, forest, and forest/nonforest edge. Information related to the procedures for the 1996 South Dakota inventory can be found in Leatherberry et al. (2000). The BHNF has remeasurement ground plots that were last measured by IWFIA in Information related to the procedures for the 1999 BHNF inventory can be found in DeBlander (2002) and USDA Forest Service (2000). The move to satellite imagery changed NCFIA s phase 1 sample from being based on one photo plot for every acres to a sample based on a classified pixel every 0.22 acres. The increased intensity of the phase 1 sample greatly improved estimates of the area within each stratum, particularly at the county level. Also, because the classification was conducted using a computer-assisted algorithm across the entire State, biases in the photo plot sampling method that resulted from differences in photo quality, age of photography, and experience of the photointerpreter, were eliminated and classification was consistent across the entire State. Phase 2 Phase 2 of the inventory consisted of measuring of the first annual sample of field plots in South Dakota and remeasuring inventory plots from the 1999 BHNF inventory (DeBlander 2002). Current FIA precision standards for annual inventories require a sampling intensity of one plot for approximately every 6,000 acres. FIA has established a grid that divides the entire area of the United States into non-overlapping hexagons, each of which contains approximately 5,937 acres (McRoberts 1999). A grid of field plots was established by selecting one plot from each hexagon based on the following rules: (1) if a Forest Health Monitoring (FHM) plot (Mangold 1998) fell within a hexagon, it was selected as the grid plot; (2) if no FHM plot fell within a hexagon, the existing IWFIA plot from the 1999 inventory of the BHNF nearest the hexagon center was selected as the grid plot; and (3) if neither FHM nor existing IWFIA plots fell within the hexagon, a new NCFIA plot established at the hexagon center was selected as the grid plot (McRoberts 1999). This grid of plots is designated the Federal base sample and is considered an
13 equal probability sample; its measurement in South Dakota is funded by the Federal government. Phase 3 NCFIA has two categories of field plot measurements phase 2 plots (standard FIA plots) and phase 3 plots (forest health plots to optimize our ability to collect data when available for measurement). Both types of plot are uniformly distributed both geographically and temporally. Phase 3 plots are measured with the full array of FHM vegetative and health variables (Mangold 1998) collected as well as the full set of measures associated with phase 2 plots. Phase 3 plots must be measured between June 1 and August 30 to accommodate the additional measurement of non-woody understory vegetation, ground cover, soils, and other variables. We anticipate that in South Dakota the complete 5- year annual inventory will involve about 495 phase 3 plots, of which around 35 will have field measurements. On the remaining plots, referred to as phase 2 plots, only variables that can be measured throughout the entire year are collected. In South Dakota, the complete 5-year annual inventory is expected to involve about 330 phase 2 forested plots. The 2001/2002 annual inventory results represent field measures on 122 timberland, 10 other forest land, and 3,187 nonforest land plots. The total Federal base sample of hexagonal grid plots was systematically divided into five interpenetrating, non-overlapping subsamples or panels. Each year the plots in a single panel are measured, and panels are selected on a 5-year, rotating basis (McRoberts 1999). For estimation purposes, the measurement of each panel of plots may be considered an independent systematic sample of all land in a State. Field crews measure vegetation on plots forested at the time of the last inventory and on plots currently classified as forested or straddler (nonforest/forest and forest/nonforest) by trained photointerpreters using aerial photos or digital orthoquads. Plots classified as nonforest were checked to ensure correct classification. The new national FIA 4-point cluster plot design (fig. 5) was first used for data collection in South Dakota in the BHNF in 1999 and during the 2001 inventory. This design was also used in the 2002 inventory and will be used in subsequent years. On forest land outside the BHNF, all plots in the annualized inventory are newly established; therefore, some remeasurement data will not be available until the sixth year of the annual inventory. These measurements form the basis for change estimates between the first five-panel cycle and the second five-panel cycle for characteristics such as average annual net growth, mortality, and removals. The national plot design requires mapping forest conditions on each plot. Because of the small sample (20 percent) each year, precision associated with change factors such as mortality will be relatively low. Consequently, change estimates outside the BHNF may not be reported until at least the third annual panel of the second five-panel cycle of the inventory has been implemented, and even then we anticipate that estimates of change will be limited in detail. When the complete second five-panel annual inventory has been implemented in 2010, the full range of change variables will be available for the entire State Plot center N MAGNETIC Figure 5. Current NCFIA field plot design. 3 9
14 10 The overall plot layout for the new design consists of four subplots. The centers of subplots 2, 3, and 4 are located 120 feet from the center of subplot 1. The azimuths to subplots 2, 3, and 4 are 0, 120, and 240 degrees, respectively. The center of the new plot is located at the same point as the center of the previous plot if a previous plot existed within the sample unit. Trees with d.b.h. or diameter at the root collar (for woodland species such as Rocky Mountain juniper, commonly referred to as d.r.c.) 5 inches and larger are measured on a 24-foot-radius (1/24 acre) circular subplot. All trees less than 5 inches d.b.h./d.r.c. are measured on a 6.8-foot-radius (1/300 acre) circular microplot located 12.0 feet due east of the center of each of the four subplots. Forest conditions that occur on any of the four subplots are recorded. Factors that differentiate forest conditions are forest type, stand-size class, land use, ownership, and density. Each condition that occurs anywhere on any of the subplots is identified, described, and mapped if the area of the condition is 1 acre or more. Field plot measurements are combined with phase 1 estimates in the compilation process and table production. The number of tables generated from less than five panels of data is limited. However, at other tabular data can be generated. For additional information, contact: Program Manager Forest Inventory and Analysis North Central Research Station 1992 Folwell Ave. St. Paul, MN or State Forester South Dakota Department of Agriculture Resource Conservation and Forestry Division 523 East Capitol Ave. Pierre, SD LITERATURE CITED Ball, John; Erickson, David South Dakota forests. [Available at: Sdfore1.htm]. Ball, John; Harris, Jeri Lyn South Dakota, forest health highlights, [Available at: sd/sd_02.htm]. DeBlander. L.T Forest resources of the Custer National Forest. Misc. Publ. Ogden, UT: U.S. Department of Agriculture, Forest Service, Rocky Mountain Research Station. 13 p. DeBlander. L.T Forest resources of the Black Hills National Forest. Misc. Publ. Ogden, UT: U.S. Department of Agriculture, Forest Service, Rocky Mountain Research Station. 13 p. Haugen, D.E.; Hansen, M.H BIA forest lands of North and South Dakota, Resour. Bull. NC-202. St. Paul, MN: U.S. Department of Agriculture, Forest Service, North Central Research Station. 56 p. Leatherberry, E.C.; Haugan, Douglas South Dakota s forest resources in Res. Note NC-383. St. Paul, MN: U.S. Department of Agriculture, Forest Service, North Central Research Station. 8 p. Leatherberry, E.C.; Piva, R.J.; Josten, G.J South Dakota s forest resources outside the Black Hills National Forest, Res. Pap. NC-338. St. Paul, MN: U.S. Department of Agriculture, Forest Service, North Central Research Station. 103 p. Mangold, R.D Forest health monitoring field methods guide (National 1998). Research Triangle Park, NC: U.S. Department of Agriculture, Forest Service, National Forest Health Monitoring Program. 429 p. (Revision 0, April 1998). McRoberts, R.E Joint annual forest inventory and monitoring system, the North Central perspective. Journal of Forestry. 97(12): USDA Forest Service Forest inventory and analysis national core field guide, vol. 1: field data collection procedures for phase 2 plots. St Paul, MN: U.S. Department of Agriculture, Forest Service, North Central Research Station. 409 p. [National Core Field Guide, Version 1.6, March 2002].
15 TABLE TITLES Table 1. Area of forest land by forest type group and owner category, South Dakota, Table 2. Area of timberland by major forest type group, stand origin, and owner category, South Dakota, Table 3. Area of timberland by forest type group and stand-size class, South Dakota, Table 4. Net volume of all live trees on forest land by species group and owner category, South Dakota, Table 5. Net volume of all live trees and salvable dead trees on timberland by class of timber and softwood/hardwood categories, South Dakota, Table 6. Net volume of growing stock on timberland by forest type group and softwood/hardwood species categories, South Dakota, Table 7. Net volume of growing stock on timberland by species group and diameter class, South Dakota, Table 8. Net volume of sawtimber on timberland by species group and diameter class, South Dakota, Table 9. All live aboveground tree biomass on timberland by owner category, softwood/hardwood species category, and tree biomass component, South Dakota,
16 12 TABLES

17 13

18 14

19 15
20 16

21 17

22 18

23 19

24 20

25 21
26 Piva, Ronald J.; Haugan, Douglas; Josten, Gregory J.; Brand, Gary J South Dakota s forest resources in Resour. Bull. NC-230. St. Paul, MN: U.S. Department of Agriculture, Forest Service, North Central Research Station. 21 p. Results of the 2002 annual inventory of South Dakota show an estimated 1.7 million acres of forest land in the State. Timberland accounts for 92 percent of the forest land area. Nearly 70 percent of the timberland is publicly owned. Over 80 percent (1.3 billion cubic feet) of the growing-stock volume on timberland comes from ponderosa pine. All live aboveground tree biomass on timberland totals an estimated 30.5 million dry tons. Known pests in South Dakota s forests include the mountain pine beetle, pine engraver beetle, cedar bark beetle, red turpentine beetle, and ash/lilac borer. KEY WORDS: Annual inventory, forest land, timberland, forest type, volume, biomass, forest health, South Dakota.
27 The U.S. Department of Agriculture (USDA) prohibits discrimination in all its programs and activities on the basis of race, color, national origin, gender, religion, age, disability, political beliefs, sexual orientation, and marital or family status. (Not all prohibited bases apply to all programs.) Persons with disabilities who require alternative means for communication of program information (Braille, large print, audiotape, etc.) should contact USDA s TARGET Center at (202) (voice and TDD). To file a complaint of discrimination, write USDA, Director, Office of Civil Rights, Room 326-W, Whitten Building, 14th and Independence Avenue, SW, Washington, DC , or call (202) (voice or TDD). USDA is an equal opportunity provider and employer. Printed on recyclable paper.
28 MISSION STATEMENT We believe the good life has its roots in clean air, sparkling water, rich soil, healthy economies and a diverse living landscape. Maintaining the good life for generations to come begins with everyday choices about natural resources. The North Central Research Station provides the knowledge and the tools to help people make informed choices. That s how the science we do enhances the quality of people s lives. For further information contact: North Central Research Station USDA Forest Service 1992 Folwell Ave., St. Paul, MN Or visit our web site: The Forest inventory and Analysis web site is: