Forest Assessments with LiDAR: from Research to Operational Programs
|
|
|
- Eugene Mason
- 5 years ago
- Views:
Transcription
1 Forest Assessments with LiDAR: from Research to Operational Programs David L. Evans Department of Forestry Forest and Wildlife Research Center Mississippi State University

2 Forest Remote Sensing: Then and Now Aerial Photography: Stand Mapping Manual Measurements

3 Satellite Data: Landsat Type Mapping Could Not See the Trees

4 High-resolution digital imagery: can see the trees, hard to get measurements
5 Presentation Outline Profiling LiDAR Research Scanning LiDAR Research and Applications Individual tree measurements Timber inventory Forest structure analysis Stand visualization
6 Profiling LiDAR Concept Nelson, Krabill, and MacLean, 1984
7 LiDAR Profile
8 Early Profiling LiDAR Findings COV of laser heights indicated canopy structure High COV = open canopy (regeneration and mature stands Low COV = closed canopy (mid-rotation) Average tree height matched closely with average height of the upper 5-10% 5 of laser measurements


9 Scanning LiDAR Typical multi-return data acquisition An AeroScan LiDAR Sensor Courtesy of the Spencer B. Gross, Inc.website Courtesy of the Spencer B. Gross, Inc.website

10 Hi-Res Multi-spectral + LiDAR
 Southern coastal plain in MS, TX, GA, LA (loblolly pine, mixed oak/gum hardwoods) RCW habitat study in NC (longleaf and loblolly pine) WA ID TX MS LA")
11 LiDAR Study Sites Coastal forests in WA (Douglas-fir, western hemlock, red alder) Interior forest in ID (Ponderosa pine, Douglas-fir, lodgepole pine, grand fir, Engelmann spruce, subalpine fir) Southern coastal plain in MS, TX, GA, LA (loblolly pine, mixed oak/gum hardwoods) RCW habitat study in NC (longleaf and loblolly pine) WA ID TX MS LA NC GA
12 Measurements of Interest Stem density Total height DBH Height to base of live crown (HBLC) Crown diameter Understory density
13 Tree Recognition and Measurement Generate canopy and ground surfaces Variable radius focal maximum filter Based on relative target density Finds tall objects and gets highest value per object Output is a GIS of tree locations and associated heights Crown size from canopy returns


14 Surfaces from LiDAR Canopy Terrain


15 Tree Identification Combine LiDAR and MS data 65-93% location accuracy Determine height - (canopy ground) at tree loc. Canopy surface Tree locations

 Total")
16 Tree Locations Used for: Height, Crown Size, Leaf Area, and Volume LiDAR scatter plot Tree locations Crown depth (center of LA) Total height Ground
17 Tree Height Comparison 50 Total tree height measured in field (m) Douglas-fir selectionarea08 selectionarea37 isolated individual trees Tree height lidar: lintop/linbot ( m)


18 Timber Inventory First tested in Idaho 2001 (SE < 12%) Also tested in Louisiana in two studies (SE 2.7 to < 10%)
19 Timber Inventory Based on Double Sampling Relate sparse ground sample to very large remote (LiDAR) sample LiDAR flown in strips Very precise tree ht. from LiDAR but biased use regression to field tree heights to adjust Apply field relationship of DBH to tree ht. (regression) to predict DBH on LiDAR-identified identified trees Calculate volumes on LiDAR trees The double sample adjusts LiDAR estimate of vol. based on sparse field sample. See Parker and Evans (2004) W. J. Appl. Forestry for the gory details
20 Double-Sample Timber Inventory lr = y + B (Lvo lvo) Y lr _ Y lr is the regression adjusted mean volume per acre _ y is mean ground volume on Phase 2 B is relationship of ground volume (y) to LiDAR volume (lvo) on Phase 2 sample Lvo is mean LiDAR volume on Phase1 lvo is mean LiDAR volume on Phase 2
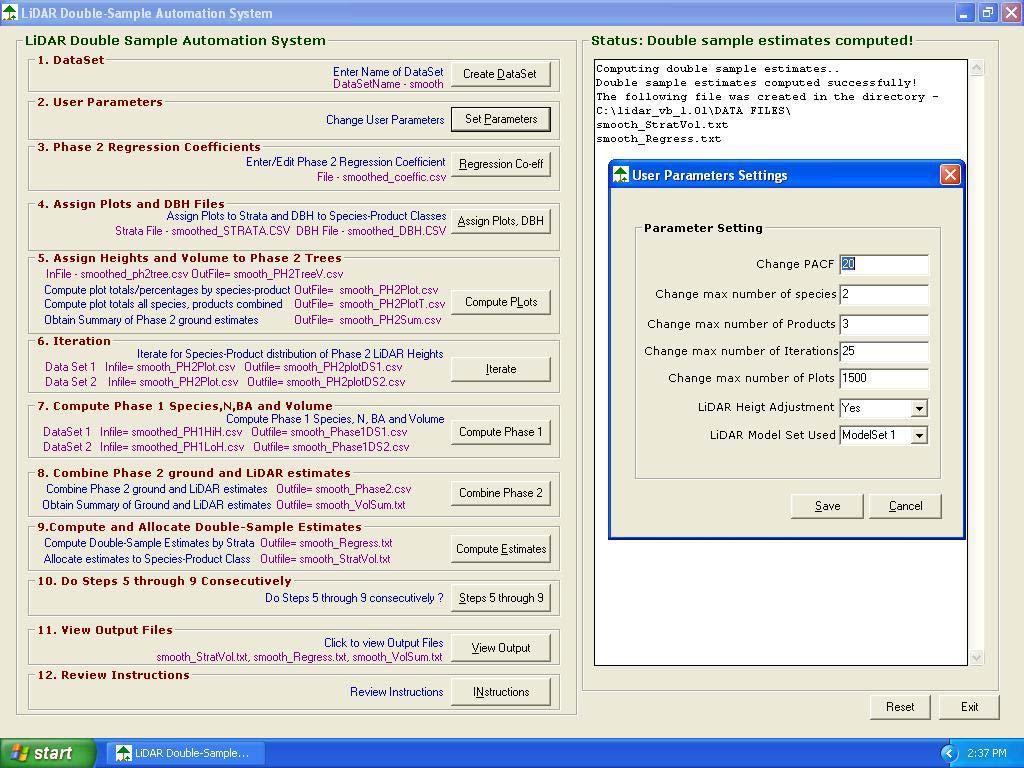
21
22 General Observations With traditional photogrammetric sampling: Use ground volume vs. photo volume. With LiDAR double sampling procedures: Use ground volume vs. LiDAR basal area or volume. Tree height strongly related to DBH and LiDAR provides consistent height measure. LiDAR height and DBH biases adjusted by regression estimator for basal area or volume. Volume differentiation by species presents challenges. Works well for monocultures.
23 Forest Structure and Wildlife Habitat Assessment


24 Habitat Assessments Input Variables Cover Type Tree Size H. Structure V. Structure Combined Information Problem: Habitat classification accuracy low in part due to insufficient information about forest structure.


25 Vertical Structure Classification from Tree Height Variation at Landscape Scale Classification Single-story or Multi-story

26 Multi-spectral and LiDAR Inputs to Habitat Suitability Models 1. Map stands by type 2. Identify snags

")
27 Output from Habitat Model (Pigmy Nuthatch) Aggregated by Stand
28 Stand Visualization from LiDAR Visualization tools Point clouds for forest structure Tree lists to stand graphics A vision of the future?


29 Forest Visualization Plot Stand Landscape LMS EnVis SVS Source SmartForest

30 Examination of Point Clouds

31 LiDAR Trees in SVS


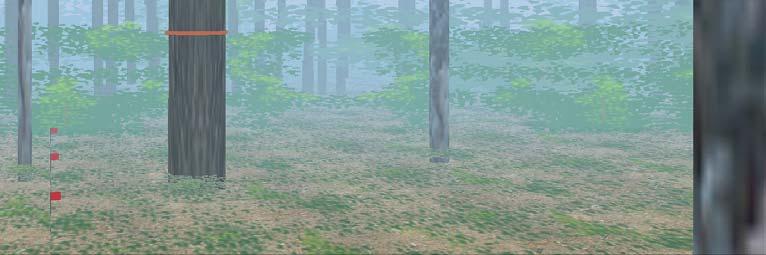
32 Virtual Environments from LiDAR Parameters of Individual Trees


33 Graphic Tree Models Low (pine) 224 triangles Med (pine) 508 triangles High (pine) 2,400 triangles Hardwood Billboards
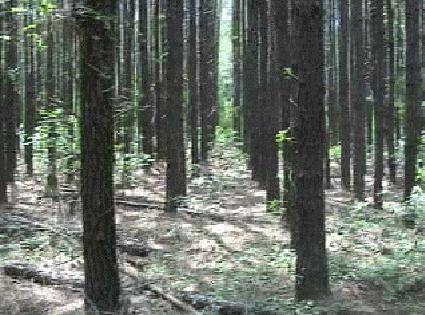
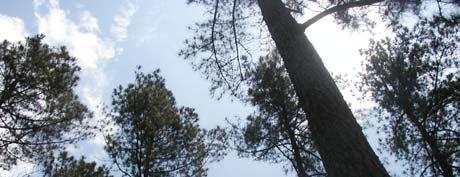
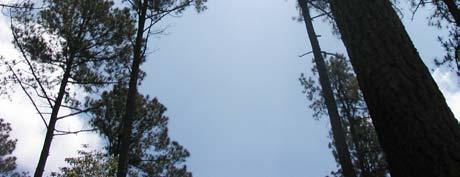
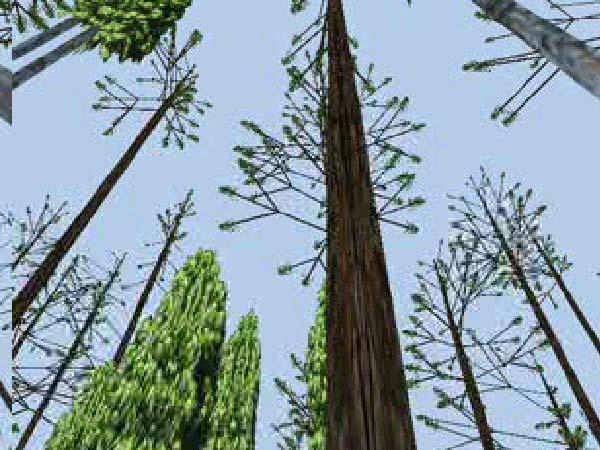
34 Experimental Media Stand Video vs. Graphic Simulations Trunk views Canopy views Video Graphic Video Graphic


35 Virtual Environment Tests Graphic realism (simple to complex) Interactivity (virtual navigation and stand examinations)


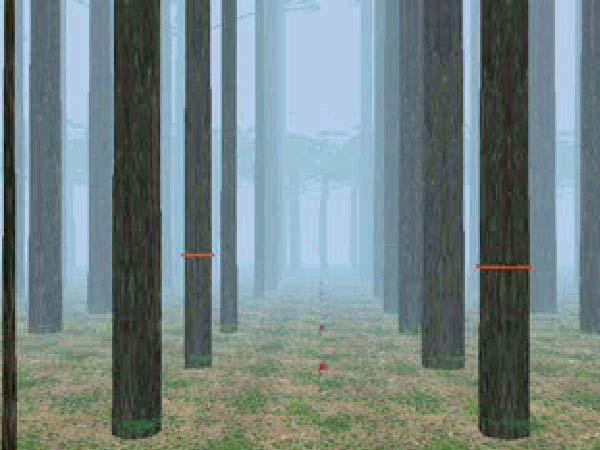
36 Graphic Aids in VE Height pole 10 x 10 foot grid Compass
37 Possible Applications of Virtual Stand Models Forest inventory Wildlife habitat assessment Stand management Recreation Environmental impact assessments Military Teaching tools (for all the above)
38 Current Research LiDAR and hyperspectral/multispectral data for RCW habitat modeling LiDAR sampling theory interaction of LiDAR with targets / target recognition Understory modeling from LiDAR returns Interactive tools for stand treatment and investigation in research/teaching Growth and yield modeling and visualization

39 Thank You Thompson Hall, Mississippi State University