Enhancing Soil Carbon Sequestration and Productivity on Arable Land of Thailand
|
|
|
- Edwina Lindsey
- 5 years ago
- Views:
Transcription

1 Enhancing Soil Carbon Sequestration and Productivity on Arable Land of Thailand Sathaporn Jaiarree, Ph.D Director of Degraded Soil Management Division Rungsun Im-Erb, Ph.D Consultant Official Land Development Department Ministry of Agriculture and Cooperatives Thailand
2 Contents National strategy on climate change Soil of Thailand Soil carbon stock Land management Carbon sequestration in soil Research Conclusion


3 GHG emissions by agriculture sector of Thailand in 2000 (National inventory, IPCC: ONEP, 2009 )
4 National strategy on climate change and Master plan on global warming mitigation Ministry of Agriculture and Cooperatives, MOAC Objective: Research on GHG emissions, sequestration and adaptation in agriculture areas. Develop efficient database, knowledgebase and warning system. Identify activities and areas to improve cropping system and mitigate. Capacity building for relevant organization, staffs, and cooperation system.
5 Development Activities * Campaign on crop residues management by incorporate into soil for carbon sequestration (mitigate global warming project) * Implementation on soil and water conservation measures and trees plantation in target areas (mitigate global warming project)

6 Land Development Department (LDD) Main purpose to develop the land for the highest utility as well as transfer technology. To enhance soil fertility and agricultural productivity while promoting long-term sustainability in environment based on participatory principle.


7 Landuse map Thailand 51.3 mil. ha Land use 21 million ha are currently under crops 13 million ha are forests 17 million ha compose of urban area, public area, sanitation, swamp land, railroads, highways, real estates and others Potential of agricultural soil Total area 51.3 mil. ha. Suitable for crop 7.2 mil. ha. Need to improve 18.4 mil. ha. Unfertile soil 24.6 mil. ha. Water storage 0.8 mil. ha.
8 Soil nutrient of Thailand 66% very low (<1.5%) (Northeast <1.0%) 66% strongly acid soil : (acid sulphate and acid soil) 90% very low in N 82% very low in P 73% very low in K

9 The soil organic carbon status of Thailand in 2008 (Suvannang, 2010)


10 Map of available P and K contents in surface soil of Thailand in 2008, (Suvannang, 2010)


11 Soil degradation in Thailand Complex slope Shallow Soil Salinity Acid Sulfate Soil Sandy soil Peat Soil

12 Soil carbon stock of Thailand
13 The soil C stock of Thailand Order Area OC (ton ha -1) ha (10 6 ) % cm Ultisols Alfisols Inceptisols Entisols Molisol Vertisols Spodosols Histosols , Oxisols


14 Land management Soil and fertilizer management Program for efficient use of chemical fertilizer for economic crop that that we can get the recommendation on how to make efficient use of fertilizer. Land Development Department, Ministry of agriculture and Cooperatives


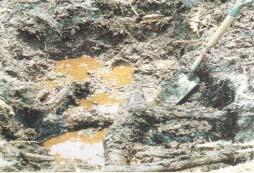
15 Soil and water analysis and mobile lab unit

16 Soil Erosion Soil erosion map Soil loss level Slightly areas (M. ha) Moderate 3.84 Severely 5.28 Very severely 1.92 Total areas Low organic matter content M. ha

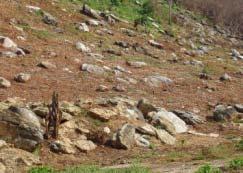
17 Deforestation: Northern Thailand


18 Soil Erosion Soil erosion process 1. Detachment 3.Deposition 2. Transportation

19 Soil and water conservation


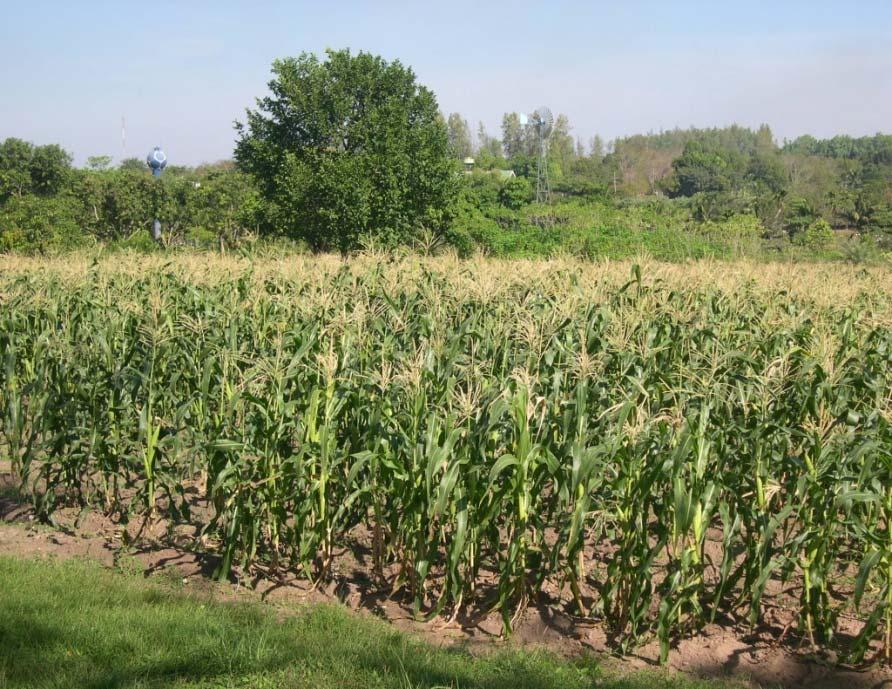
20 Engineering Soil Erosion Control

21 VEGETATION SOIL EROSION CONTROL
22 CROP MANAGEMENT Crop rotation Inter-cropping Multi-cropping Relay-cropping Protective-cover cropping Green manure Residual and mulching Windbreak Alley-cropping

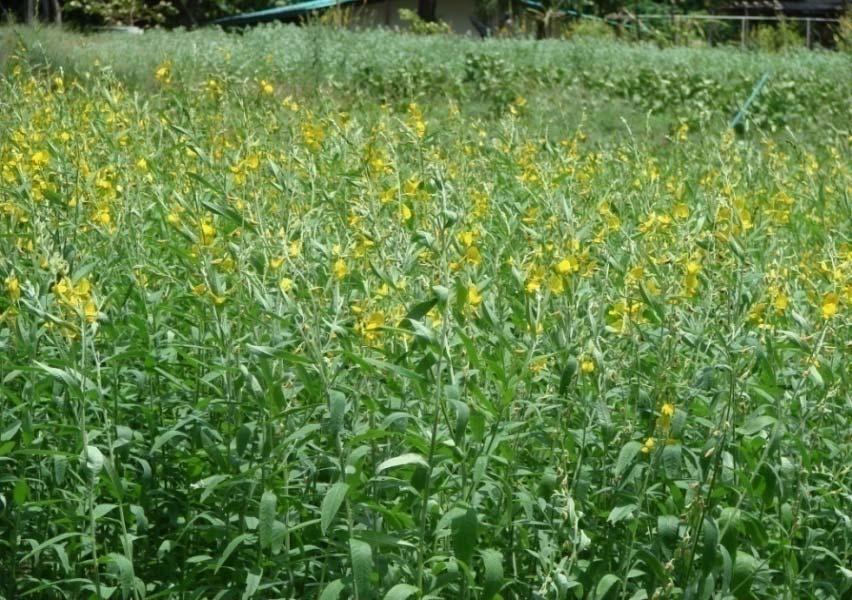
23 Jack bean (Sword bean) Canavalia ensiformis ถ วพร า Sunnhemp Crotalaria juncea L. ปอเท อง


24 Research Soil carbon sequestration in Thailand
25 Thailand Cha Choeng Sao province KHS site Khao Hin Sorn Development Study Center (King s Project) Panom Sarakam District TTK site Tha Ta Kieb District Study period :

26 Forest plot
27 Corn plot
28 Measurements of soil C pools Application of stable C isotope technique in carbon dynamic study (Stable carbon isotope ( 13 C)) Cs = C df + C dc Cs δ 13 Cs = (Cdf δ 13 Cdf) + (Cdc δ 13 Cdc) δ 13 Cs= value from study soil δ 13 Cdf = value from forest soil δ 13 Cdc= value from crop Original forest trees (C3) is replaced by crops C4), SOC of the cultivated land after deforestation is a mixture of SOC remaining from the previous forest (Cdf) and SOC derived from the crops (Cdc).
29 Soil carbon (ton C/ha) derived from C3 (forest) ( ) and C4 plant (corn) ( ) in surface soil at TTK site Graph of soil carbon derived from C3 (forest) and C4 plant (corn) with time after deforestation at TTK site Soil carbon (ton C/ha) Years after deforestation
30 soil carbon with stable and labile carbon with time after deforestation Tha Ta Kieb site C s = e t Stable foret C Labile forest C Labile crop (corn) C Soil C (ton/ha) R 2 = C dfl = e t R 2 = Time, years after deforestation
31 CO 2, CH 4 and N 2 O fluxes from soil plots mg CO2/m 2 /h r 1,200 1, NF CI CC NF (Forest) CI (Intensive management) CC (Conventional management) Jan Feb Mar Apr May Jun Jul Aug Sep Oct NovDec mg C H4/m 2 /hr Jan Feb Mar Apr May Jun Jul Aug Sep Oct Nov Dec NF CI CC g N2O/m 2 /hr Jan Feb MarApr May Jun Jul Aug Sep Oct Nov Dec NF CI CC
32 Research in King s project: The net carbon budget for agriculture and forest soil plots in 2005 Plots Forest (NF) (ton C ha -1 yr -1 ) Intensive (CI) (ton C ha -1 yr -1 ) Conventional (CC) (ton C ha -1 yr -1 ) Soil carbon stocks C emissions from soil C from biomass forest C from biomass (Corn) C from biomass (Canavalia spp.) C from compost C emissions from machinery C emissions from agricultural input Net C budget
33 The researches of soil C in Thailand Topic Year Soil Details C stock Bulk density References (ton ha -1) (g cm -3 ) Soil Organic Carbon Stock and Rate of Carbon Dioxide Emission of Abandoned Agricultural Land Soil Carbon Sequestration in Organic Tapioca at Tambon Maghurmai Amphur Soongnern Nakornratchasrima Province Impact of Rice Straw Management on Carbon Sequestration in Rice Soil: The Case Study of Kampheang Sean Soil Series Carbon Stock and Net Co 2 Emission in Tropical Upland Soils under Different Land Use 2008 Aeric Tropaquepts Depth 0-15 cm Chaun et al., 2010 Depth cm Oxic Paleustults Depth 0-20 cm 7.11 Funglatda et al., Typic Haplustalfs Normal soil Total C 1.53% 1.31 Ramnut et al., 2010 Straw soil Total C 1.63% 1.24 Straw burning soil Total C 1.59% sandy clay Natural forest 118(0-50cm) 1.69 Lichaikul et al., 2006 sandy clay loam Reforestation 66(0-50cm) 1.81 sandy loam Agriculture 57(0-50cm) 1.85 Soil organic carbon loss and turnover resulting from forest conversion to maize fields in eastern Thailand Paleustalfs Forest Corn 0 year years Jaiarree et al., 2011 Carbon budget and sequestration potential in a sandy soil treated with compost Typic Ustipsaments Natural forest (0-100cm) 1.40 Jaiarree et al., 2011 intensive management (0-100cm) 1.73 conventional management (0-100cm) 1.85
34 Conclusions Soil managements can improve SOC (soil C sequestration: global warming mitigation) Labile OC rapidly decrease caused from conventional managements Stable OC still sequester in soil (quantity and quality of biomass) SOC can turnover to the original level Soil C sequestration related to soil carbon stock

35 THANK YOU FOR YOUR ATTENTION
36 METHODOLOGY Plant sampling - Biomass from forest, litterfall - Biomass from corn - Biomass from green manure, Canavalia spp. Gas sampling -CO 2,CH 4 and N 2 O emissions from soils -collected by static closed chamber -analyzed by GC technique - Result in CO 2,CH 4 and N 2 O fluxes - estimated to C emissions in net C budget estimation (ton C ha -1 y -1 )
37 Crop and soil management C emissions from diesel fuel CO 2 emissions factor from production and combustion of diesel fuel = Kg C/GJ (west and Marland,2002) Energy value = 36.24*10 6 J/liter ( (21.95 *10-9 kg C/J) (36.24*10 6 J/liter) CO 2 emission factor from diesel fuel use = kg C/ liter Irrigation CI 855, CC 800 l/ha Machinery CI 173, CC 160 l/ha C emission =0.68, 0.64 ton C /ha/yr C emission 0.14, 0.13 ton C /ha/yr
38 C emissions from fertilizer inputs CO 2 emission factors for 1 kg fertilizer Factory production (Patyk, A (1996), IPCC (2002) KHS site Fertilizer inputs in year N-fertilizer =2404 g CO 2 CS Urea 1.5 t ha -1 CF Urea 0.9 t ha -1 P 2 O 5 -fertilizer =448 g CO 2 K 2 O-fertilizer =443 g CO t ha t ha -1 Compost 50 t ha t ha t ha -1 Compost 30 t ha -1