LAST TIME Population growth, distribution, and size in Latin America Urbanization Problems with urban growth continued The urban economy Migration
|
|
|
- Albert Wells
- 5 years ago
- Views:
Transcription
1 LAST TIME Population growth, distribution, and size in Latin America Urbanization Problems with urban growth continued The urban economy Migration
2 TODAY Agricultural and Rural Development Tropical Deforestation
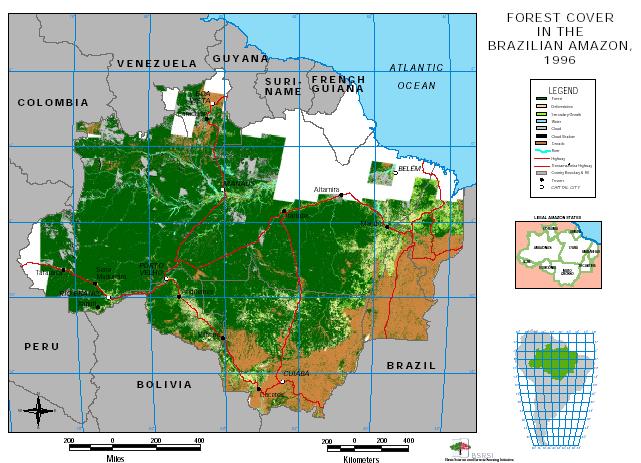
3 Agricultural and Rural Development: Internal Colonization of Tropical Lowlands An example from Amazonia > 600 million ha Amazonian environments Terra firme Várza Savanna
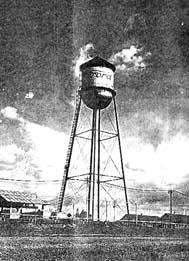
4 Development history in Amazonia Early extractive uses Rubber Forestry
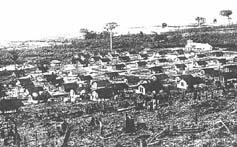
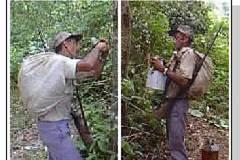
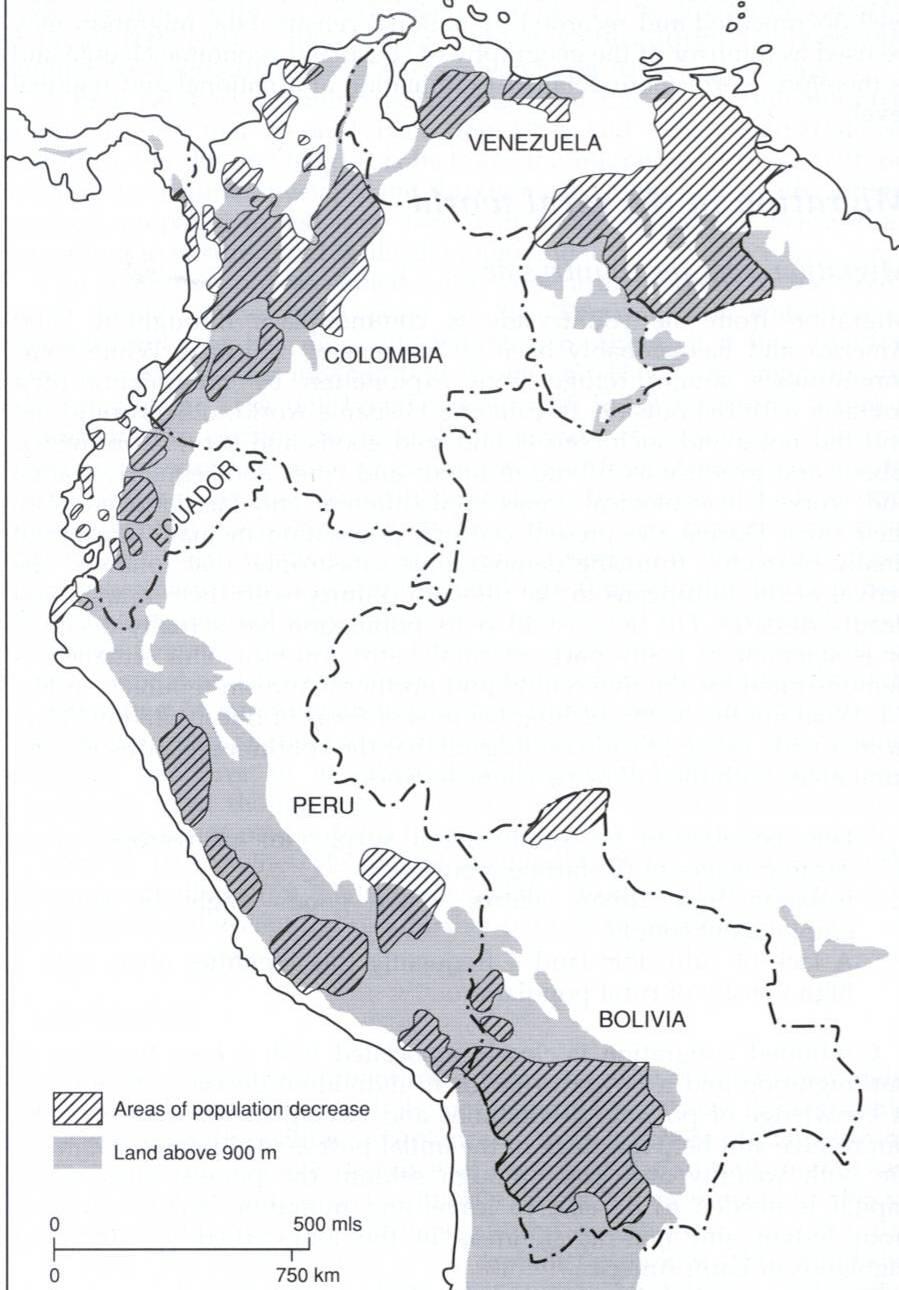
5 Development history in Amazonia Spontaneous peasant agricultural colonization Brazilian Andean
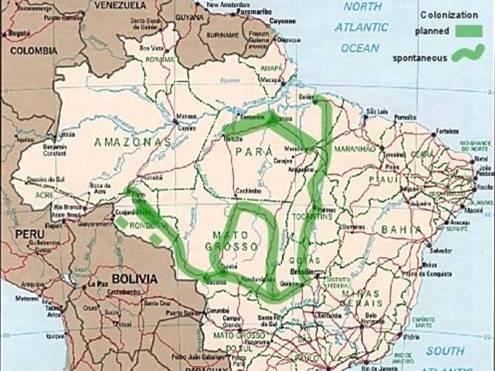
6 Development history in Amazonia Governmentally planned peasant colonization highways planning excessively centralized Highway location bad for soils geopolitical motives domestic political motives
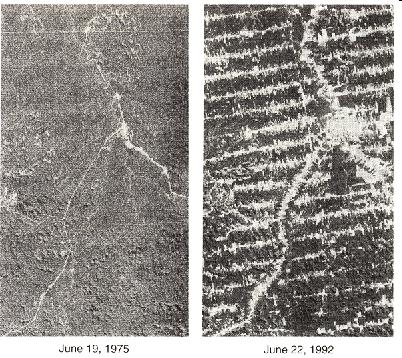
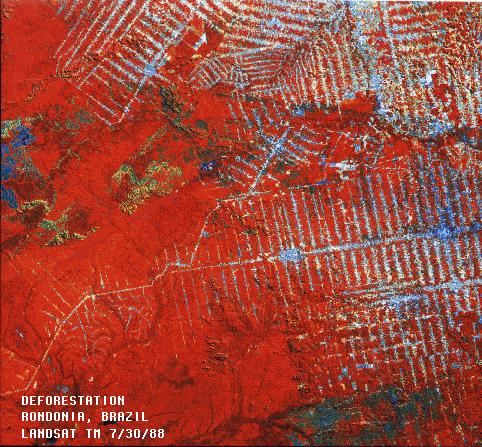
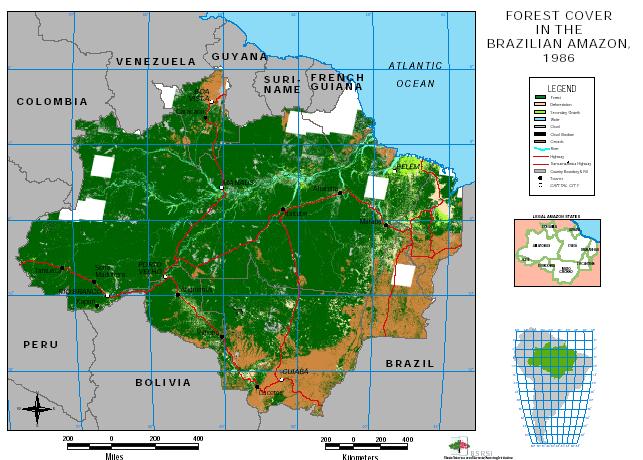
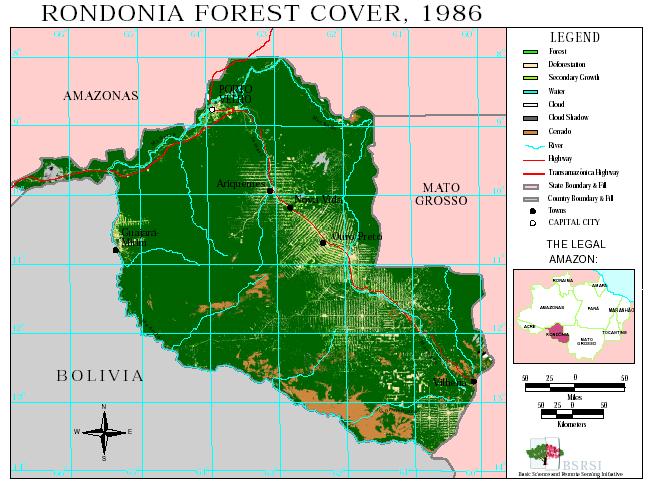
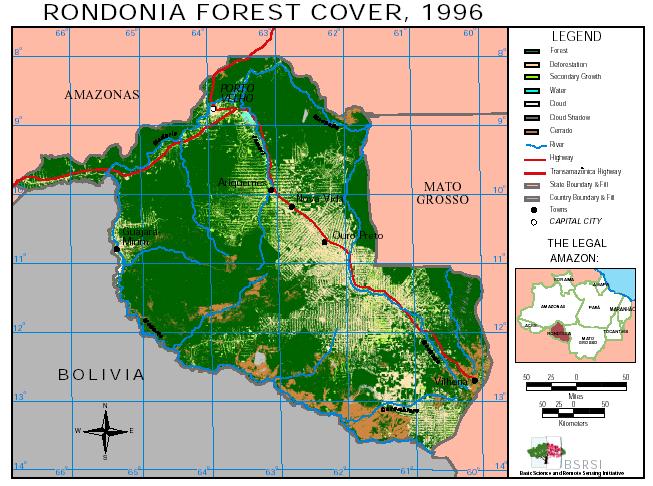
7 Development history in Amazonia Cattle ranching Fishbone patterns
8 Development history in Amazonia Scale & geography of change Soil degradation on already poor soils Poor rural health Poor government planning
9 Development history in Amazonia Consequences Farm abandonment Consolidation by cattle ranchers and large soy farmers urbanization
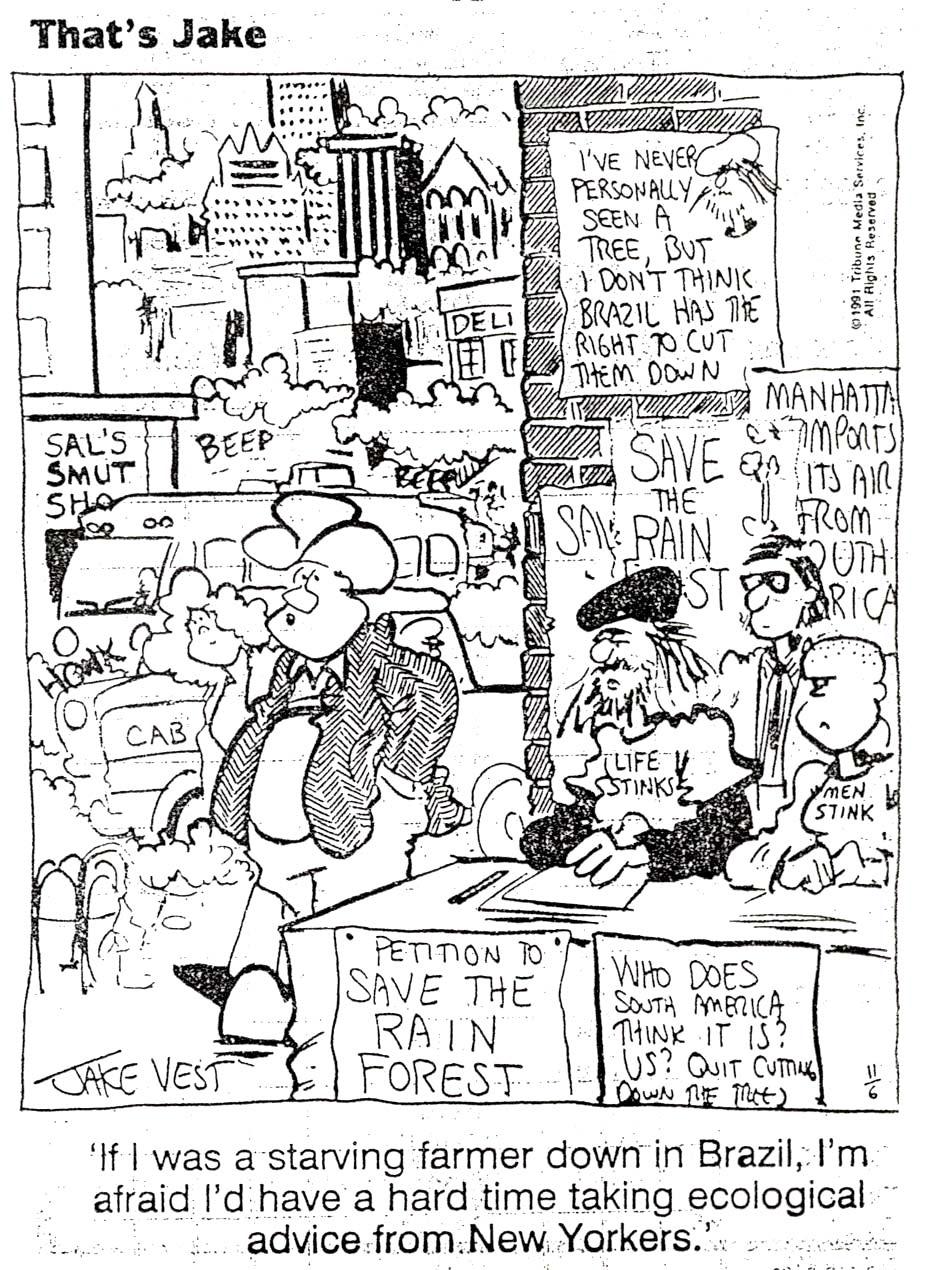
10 Amazonian deforestation Wider consequences in Brazil speculation and abandoned lands deforestation of rare tropical rain forest destruction of species destruction of Indigenous people s traditional livelihood consequences for global warming fails to solve land tenure problem Solutions?
11 Tropical Deforestation Deforestation rates
12 Tropical Deforestation Causes agricultural clearing pasture clearing timber harvesting oil exploration/extraction population growth? degradation of lands in source areas of migrants poor land tenure equity in source areas of migrants
13 Population and Environmental Change in Latin America 519 million people in 2000 (UN, 2001) 30 year doubling time, billion by 2100? Declining fertility, Rural out-migration (2% annually) and Urbanization, but Rapid forest clearing Major impact of rural-rural migrants and pasture expansion T. M. Whitmore
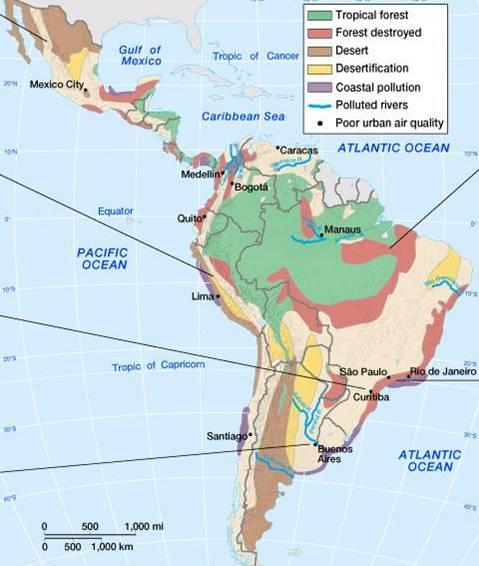
14 Significance Environmental Impacts The Amazon basin alone contains: 1) the greatest extent of closed tropical forests in the world 2) 45% of all the fresh water on the Earth 3) the planet s largest carbon sink 4) the planet s most bio-diverse forests Human development Impacts rural underdevelopment food production T. M. Whitmore
15 Central America: Forest Cover Source: FAO, 2003 T. M. Whitmore
16 South America: Forest Cover Source: FAO, 2003 T. M. Whitmore
17 Results Central America % rural population increase (19 million) 34%. rural population density increase. 15% deforestation (13 million ha.) Great temporal and geographic variation T. M. Whitmore
18 T. M. Whitmore -68% -47% -40% 87% 51% 1.20 Panama -79% -51% -51% 137% 29% 0.81 Nicaragua -32% 2% -6% 39% 21% 0.78 Mexico -56% 5% -11% 101% 109% 1.02 Honduras -70% -46% -51% 62% 71% 2.81 Haiti -80% -62% -49% 156% 106% 1.79 Guatemala -66% -17% -49% 51% 8% 2.51 El Salvador 59% 109% 100% 26% -22% 2.32 Dominican Republic -72% -24% -45% 98% 81% 1.76 Costa Rica Change Forest/Capita Deforesta tion Rural Population Change Rural Population Density CENTRAL AMERICA
19 Central America: Pasture and Arable & Permanently Cropped Land as a Percent of Total Land 60% 50% 40% 30% 20% 34.9% 36.7% 38.9% 10% 0% 12.9% 13.1% 15.2% T. M. Whitmore
20 Percent A&P Land Irrigated Fertilizer Use (1000 Kg/Ha. of Cropland) Central America Costa Rica Dominican Republic El Salvador Guatemala Haiti Honduras Mexico Nicaragua Panama Average T. M. 285 Whitmore
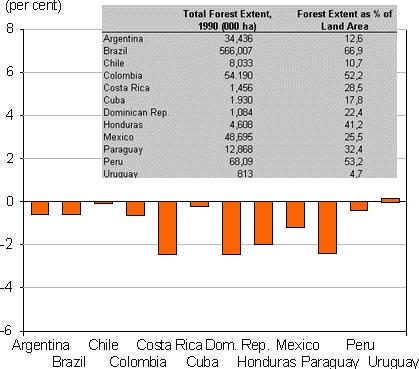
21 South America million decrease in rural population (-6%) rural population density nearly halved 6% deforestation (12% weighted). T. M. Whitmore
22 T. M. Whitmore 19% 38% 26% 6% -57% 2.15 Venezuela -46% -14% 8% 101% -48% 1.50 Paraguay -64% -35% -43% 59% 34% 1.18 Ecuador -30% -3% -16% 20% 40% 1.76 Colombia -7% -15% -18% -12% 46% 0.64 Chile 23% 20% -3% -21% -66% 1.41 Brazil -40% -13% -12% 47% -32% 1.49 Bolivia -18% -39% -34% -19% -34% 0.19 Argentina Change Forest/Capita Deforestation Rural Population Change Rural Population Density SOUTH AMERICA
23 South America: Pasture and Arable & Permanently Cropped Land as a Percent of Total Land 40% 35% 30% 25% 20% 15% 10% 5% 0% 26.3% 30.3% 23.9% 4.6% 8.4% 7.7% T. M. Whitmore
24 Percent A&P Land Irrigated Fertilizer Use (1000 Kg/Ha. of Cropland) South America Argentina Bolivia Brazil ,753 6,773 Chile Colombia Ecuador Paraguay Venezuela Average ,170 T. M. Whitmore
25 Revisiting hypotheses Population and Forest Clearing Positive relation between rural population and population density dynamics AND deforestation rates and deforestation rates per capita (rural). YES AND NO What are the land use drivers? Positive relation between rural population and population density dynamics AND cropland relative to pasture. YES and NO Negative relation between rural population and population density AND relative agricultural intensification. YES T. M. Whitmore
26 Conclusion Future food production: intensification and pasture expansion Migration Scale Data limitations Policy implications T. M. Whitmore

27 In-migration of Colonists

28 Area of high density of rubber trees Jarí Fordlândia
29
30
31
32
33 USGS
34
35
36
37
38

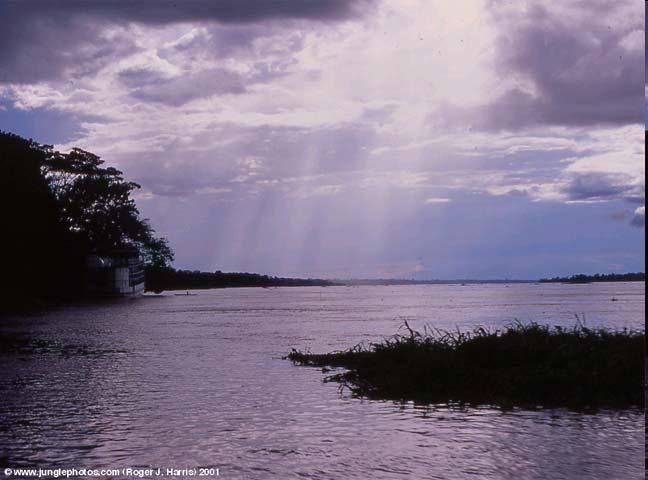
39 Roger J. Harris, 2001

40 Roger J. Harris, 2001

41 Roger J. Harris, 2001
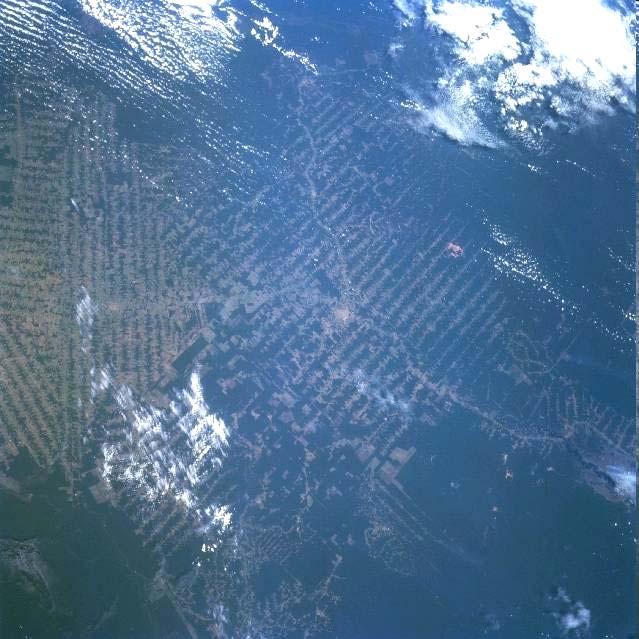
42 NASA
43
44
45
46