Forest Change Caused by Wind, Water, Ice, Fire, Insects/Disease & Harvesting
|
|
|
- Loreen Bradley
- 5 years ago
- Views:
Transcription
1 Forest Change Caused by Wind, Water, Ice, Fire, Insects/Disease & Harvesting Why use remote sensing for mapping forest changes? Synoptic view of damage on a forest landscape or regional level. Can stop the action and map the extent of forest damage at a point in time( e.g., high flood stage). Can use multi-temporal images to map before and after forest canopy conditions to assess and quantify the damage area. With some non-photographic sensors, one can get a fast turn-around or near real time damage assessment result, especially if automated, digital analysis techniques are used
 Damage Class H = Heavy crown damage (>50%) M = Moderate crown damage (20-50%) T = Trace crown damage (<20%) Damage Distribution 1 = Fairly uniform and continuous 2 =")
2 1998 Maine Ice Storm Damage Classification 1:9,000 Normal Color Stereo Aerial Photos with Ice Storm Damage Polygons (compliments of J.W. Sewall Co., Old Town, Maine) Damage Class H = Heavy crown damage (>50%) M = Moderate crown damage (20-50%) T = Trace crown damage (<20%) Damage Distribution 1 = Fairly uniform and continuous 2 = Scattered damage pockets 3 = Scattered diffuse damage

3 1998 Ice Storm Damage Map developed from 1:9,000 stereo aerial photo Interpretation

4 Remote Sensing of Mountain Pine Beetle - killed Lodgepole Pine beetle photos -- hand_of_death.jpg
5 Rationale for monitoring forest change and updating maps Research on spatial analysis of wildlife habitat modeling, inventory and biomass surveys, conservation monitoring, and sustainable forest management require accurate and updated maps Recent drivers of landscape change in Maine s working forest - Spruce budworm outbreak and salvage logging, 1970s s. Implementation of the Maine Forest Practices Act in 1991 Sale of industrial forestland to NGOs, developers, and various investment entities, 1990s - present
")
6 Landsat Time-Series Applied to Forest Disturbance (change detection) monitoring
7 Thematic Mapper bandwidths: Partial canopy removal Intact forest canopy Spectral response is a result of a decrease in green biomass / canopy cover, and an increase in visible soils, woody debris, understory vegetation, shadowing
 NIR(4) RED(2) RED(2) Normalized difference moisture index: NDMI NIR(4) NIR(4) MIR(5)")
8 Thematic Mapper bandwidths: Partial canopy removal Intact forest canopy Normalized difference vegetation index: NDVI NIR(4) NIR(4) RED(2) RED(2) Normalized difference moisture index: NDMI NIR(4) NIR(4) MIR(5) MIR(5)

9 Thematic Mapper bandwidths: Partial canopy removal Intact forest canopy Both NDVI and NDMI are correlated with leaf area, canopy cover, green biomass, canopy condition and vegetation health NDMI somewhat more sensitive to stand structure, canopy disturbance Harvest or canopy disturbance NDVI and NDMI values decrease
")


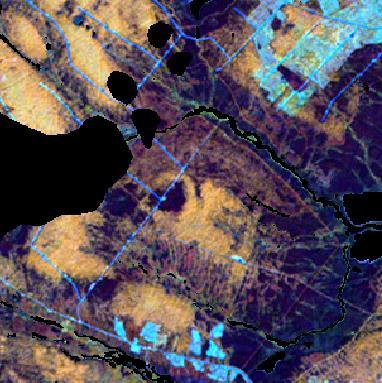
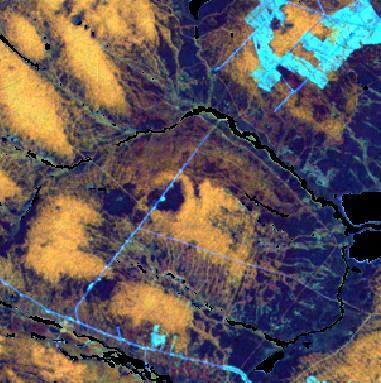
10 NIR(4) MIR(5) NDMI NIR(4) MIR(5) 1991 NDMI 1993 NDMI 1995 NDMI


11 Red = 1991 Green = date NDMI color composite Blue = 1995

12 NDMI color composite (R = 1991, G = 1993, B = 1995): Red / magenta: cut Yellow: cut Blue / cyan: regrowth, cut prior to 1991 Knowing which date of NDVI or NDMI is coupled with which color display function, and understanding additive color theory visual interpretation of date, direction, and magnitude of forest change


13 Maine Forest Disturbance and Regrowth Statewide product derived from 2000, 2004/2005, and 2007 Landsat Thematic Mapper images.
 between")

14 Percent of harvestable forest disturbed (by watershed) between Percent of harvestable forest disturbed (by township) between
15 Investment landowner types, Timber Investment Management Organizations and Real Estate Investment Trusts, were found to have the highest disturbance rates, significantly higher than public and conservation forest landowner groups. Forestlands that changed owners had similar disturbance rates to stable landowners. Disturbance rates on certified and easement forestlands, compared to non-certified and non-easement land, indicated no significant differences at the statewide scale. Public and conservation forestlands were found to have a higher proportion of coniferous forest and lower component of deciduous forest compared to privately owned forests in the state. Noone M.D.,S.A. Sader. And K.R. Legaard Are forest disturbances influenced by ownership change conservation easement status, and land certification? Forest Science 58: We quantify forest disturbance rates between 2000 and 2007 and forest cover type composition in 2007, as detected by Landsat Thematic Mapper (TM) satellite imagery, and relate these to possible influencing factors including landowner type, ownership stability, forest certification, and conservation easements. Between 2000 and 2007, four million acres of commercial forestland changed ownership.
16 Table 1. Forest change map error matrix Overall agreement (%) 84.8 Reference change Reference no change Total interpretations User's agreement (%) Mapped change Mapped no change Total interpretations Producer's agreement (%)
17 Table 5. Wilcoxon multiple comparisons tests between stable landowner groups with Dunn-Sidak probability values, red bold numbers represent significant differences (alpha = 0.05) between stable landowner groups. Conservation Industry Old-line non- industrial Public TIMO/REIT Conservation 0 Industry Old-line non-industrial Public TIMO/REIT
18 How is the US Forest Service using remote sensing for monitoring and mapping forest damage? 1. Fire Mapping with Landsat and MODIS 2. Aerial Sketch Mapping a traditional method as part of Detection Monitoring for Insect and Disease Surveys 3. MODIS/Landsat Research and Development for disturbance (natural hazards) monitoring to focus sketch mapping on high priority damage areas and reduce associated survey costs.

19 Rodeo Fire Landsat TM RGB742 False Color Composite
 and high tech (GPS, computer digital polygon entry).")
20 USFS Aerial Sketch Mapping (Detection Monitoring) Example of real time digital aerial sketch mapping of insect defoliation locations on a digital aerial sketch map linked to GPS in the aircraft. A combination of low tech (visual observation and mapping) and high tech (GPS, computer digital polygon entry).

21 Aerial Surveys US Forest Service and Maine Forest Service In Maine, 67,851 acres of damage were reported. The major type of tree damage observed from the air was 50,837 acres of discoloration caused by Anthracnose leaf disease and 9,280 acres of discoloration attributed to needlecast disease. Another significant type of damage was 3,587 acres of mortality and discoloration caused by flooding and high water. In December 2008, the severe ice storm resulted in 2,478 acres of trees with branch breakage or broken main stems.
 Mid-Appalachian Highlands Study Area 199 x 310 km PA MD W-VA VA Landsat Circa 2000 Mosaic is in")
22 Gypsy Moth Study Study Area Outlined in Yellow Below (Total ~15.5 Million Acres) Mid-Appalachian Highlands Study Area 199 x 310 km PA MD W-VA VA Landsat Circa 2000 Mosaic is in Foreground MODIS Terra 2001 Mosaic is in Background

23 High Oblique Aerial View of Gypsy Moth Defoliation Denuded, Partially Denuded, Chlorotic, and Green Forest Vegetation

24 0 4 km Gypsy Moth Defoliation Sketch Maps from US Forest Service Drape of Sketch Map Data onto Landsat Backdrop Here, the sketch maps indicate that the most extensive defoliation occurred in 2001 Although aerial sketch maps provide a close up view of the defoliation, the maps are known to have the following limitations: W-VA VA 2000 CYAN 2001 PURPLE 2002 YELLOW 2003 RED 2004 MAGENTA 2005 ORANGE 2006 BLUE 1. They are human subjective approximations - accuracy is unknown and variable. 2. The maps can contain considerable commission error 3. Aerial sketch mapping is very expensive (aircraft, fuel, crew) and dangerous.
25 US Forest Service Remote Sensing Research and Development Although aerial sketch mapping provides a useful product for the USFS Forest Health Monitoring Program, research with satellite sensors and digital analysis techniques are being tested to see if the low cost satellite products can provide near real time maps of annual insect defoliations and disease. These products from MODIS and Landsat may help improve the efficiency of aerial sketch mapping by focusing the effort on known high damage areas to reduce aerial flight time. Research Questions: Can MODIS time series data be used to detect and monitor hardwood forest defoliation caused by Gypsy Moth? What spatial resolution and data product (single day, 16 day mosaics) are most accurate?
 over targeted areas.")
26 Why MODIS instead of Landsat data? Landsat has been effective for monitoring gypsy moth defoliation, if cloud-free data is available slightly before and during peak defoliation. However, cloud frequency during defoliation periods in Spring/summer often prohibits timely Landsat data collection (1 chance every 16 days) over targeted areas. Multitemporal MODIS daily imagery can be advantageous in cloud-prone and large forest areas.


27 Views of Gypsy Moth Defoliation on Landsat 7 versus MODIS NDVI Landsat 6/10/2000 NDVI Loaded in Red; 7/15/2001 NDVI Loaded into Blue and Green MODIS Maximum NDVI Peak Defoliation All Years in Red; Same for 2001 in Blue in Green Landsat 7 2-Date NDVI RGB MODIS 2-Date NDVI RGB (MOD02) Defoliation Defoliation Red tones defoliation in 2001, except some deep red is clouds on the Landsat data Both Landsat and MODIS show defoliation, though the MODIS composite is cloud free
28 Assessment of MODIS NDVI Time Series Data Products for Detecting Forest Defoliation from Gypsy Moth Outbreaks Joseph P. Spruce, Steven Sader, Robert E. Ryan, James Smoot, Philip Kuper, Kenton Ross, Donald Prados, Jeffrey Russell, Gerald Gasser, Rodney McKellip, and William Hargrove Remote Sensing of Environment:115(2): This paper discusses an application of Moderate Resolution Imaging Spectroradiometer (MODIS) time-series data products for detecting forest defoliation from Eurasian gypsy moth (Lymantaria dispar). These results show the potential of MODIS data for contributing near real time defoliation products to a USDA Forest Service Forest Threat Early Warning System. MODIS data was successful in detecting large patches of defoliation. MODIS data misses small patches (e.g. less than approximately acres) and lighter intensity and patchy defoliation. Temporal composites of daily MOD02 data produced the best results. MODIS 250m daily images have potential as a near real-time defoliation alarm to prioritize aerial sketch mapping sampling.