Biao Zhong and Y. Jun Xu
|
|
|
- Brenda Bruce
- 5 years ago
- Views:
Transcription


1 Biao Zhong and Y. Jun Xu School of Renewable Natural Resources Louisiana State University Agricultural Center Baton Rouge, LA, USA 1
, mainly CO2.")
2 Global Climate Change The Earth's climate is changing as a result of increasing greenhouse gases (GHGs), mainly CO2. 2

3 Sea Level Rising Sea level was projected to rise by 18 to 59 cm in the next 100 years (IPCC, 2007). In 2009, Scientists believe that the ocean level is rising faster than previously expected. Over 1 meter or 3 feet by
4 Louisiana State Louisiana, rich with upland and coastal wetland ecosystems, has the third largest wetland areas in the United States following Alaska and Florida. Louisiana s low elevation coastal areas, consists mostly of marshes, puts cities like New Orleans at special risk under rising sea levels. 4
5 Soil Organic Carbon(SOC) Pool Soils are the third largest carbon pool in the earth after oceans and fossil fuels. The SOC pool, assuming an average content of 2,400 Pg to 2m depth, is 3.2 times the atmospheric pool and 4.4 times the biotic pool (Sparks, 2003).
")
6 Chicago Climate Exchange (CCX) 6
7 Research Objectives Quantify soil organic carbon (SOC) stocks across Louisiana s landscape using GIS. Analyze SOC spatial distribution and their relationships with environmental factors. Assess future SOC change using GIS and ROTHC model under 3 climate change scenarios. 7

8 Study Area 8
9 Data Sources USDA NRCS Soil Geographic Database: STATSGO (1:250,000) and SSURGO (1:20,000 ). USGS 1:24K Digital Elevation Model (DEM) data. U.S. Census Bureau TIGER/line water features. LDEQ Sub-watersheds. USGS National Land Cover Datasets (NLCD). Climate datasets provided by the Climate Research Unit (CRU), University of East Anglia, UK. 9
10 Methods Soil Organic Carbon (SOC) Analysis. Terrain / Watershed Characterization / Spatial Analyses (Slope, Elevation, and drainage density etc). Modeling: soil carbon dynamic model (RothC) 10
11 Soil Organic Carbon (SOC) Analysis The calculation was done as follows: Cs = [ (BDij*Dij*SOMij)*COMPi] /1.724 where Cs is soil organic carbon in metric tons, COMP is the area percent within each map unit, BD is the soil bulk density in kg m -3, D is the depth of a soil layer in meter, SOM is the soil organic matter content in percent. 11
12 Terrain / Spatial Analyses Terrain attributes (slope and elevation) were calculated using Spatial Analyst and 3D Analyst tools in ArcGIS from USGS 1:24 K DEM data. SOC were calculated using the Visual Basic for Application (VBA) in ESRI ARCGIS and the SQL in Microsoft Access SOC vector maps were converted to rasters. Then Zonal Statistics function of ArcGIS were use to aggregate the SOC to watershed and basin scale. 12
13 Results 13
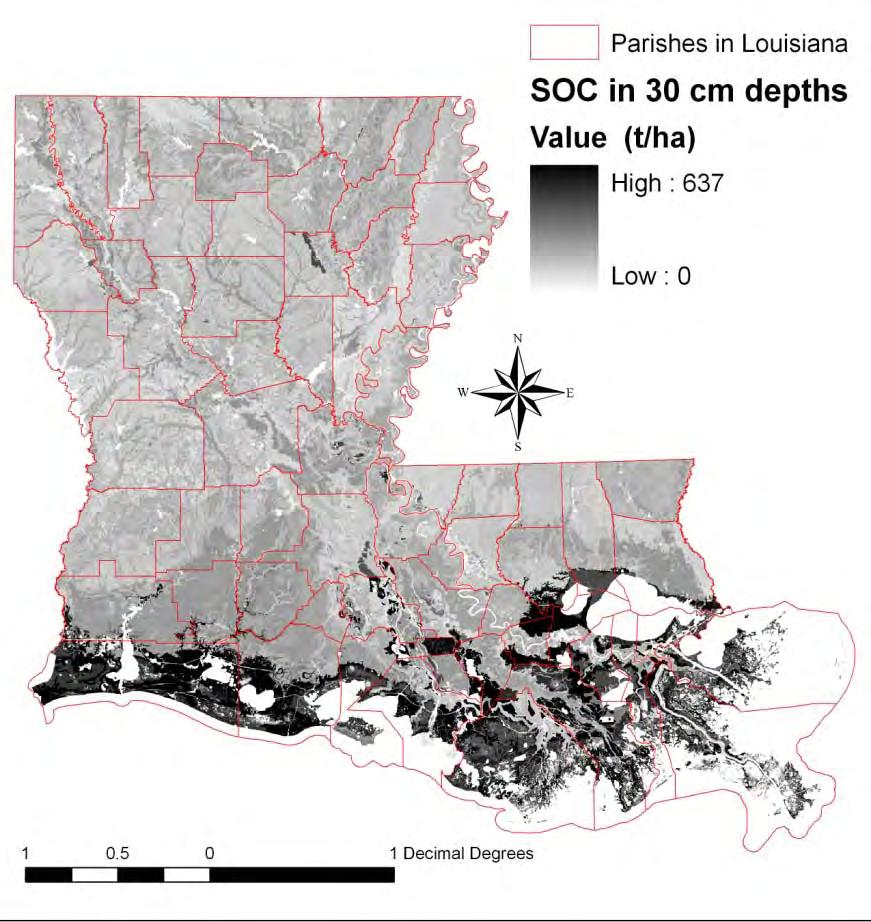
14 14
15 Con t The highest soil carbon density in backwater swamp (wetlands) areas. The historical and current Mississippi delta lobes in the southeast area of Louisiana, which were built during the last 5,000-10,000 years, had the highest soil carbon density. 15

16 Watershed SOC and Slope 16

17 Watershed SOC and Drainage density 17


18 Relationships of SOC vs. Drainage Density at Watershed Scale 18


19 Relationships of SOC vs. Slope and Elevation at Watershed Scale 19
20 Modeling: RothC Major data input - current SOC, soil clay content, Louisiana land cover at the sub-watershed scale Model parameterization - inert organic matter (IOM), decomposable plant material (DPM), resistant plant material (RPM), and DPM/RPM Model run for the upper 30-cm of soil on forest and crop lands across Louisiana 20
21 Main environmental factors of Modeling Temperature change Precipitation change Land use and land cover Modeling Soil carbon change Soil 21


22 Louisiana land cover types and SOC at watershed scale Spatial soil clay at map unit scale 22
23 Climate change scenarios Climate change scenarios based on UK Hadley Centre climate model (HadCM3): A1FI - fossil intensive, very rapid economic growth, global population, no alternative energy technology developments A2 - heterogeneous world, slow economic development and technological change, medium emissions B2 - economic, social and environmental sustainability, low emissions scenario 23
24 SOC changes from 2001 to 2100 in Louisiana s forest soils under three climate change scenarios SOC (ton/ha) A1FI A2 B2 24
25 SOC changes from 2001 to 2100 in Louisiana s cropland soils under three climate change scenarios. SOC (ton/ha) A1FI A2 B2 25

26 Temperature changes in Jan. between 2001 and 2100 in Louisiana under A1FI, A2, and B2 scenarios of HadCM3 climate model Climate datasets provided by the Climate Research Unit (CRU), University of East Anglia, UK. 26
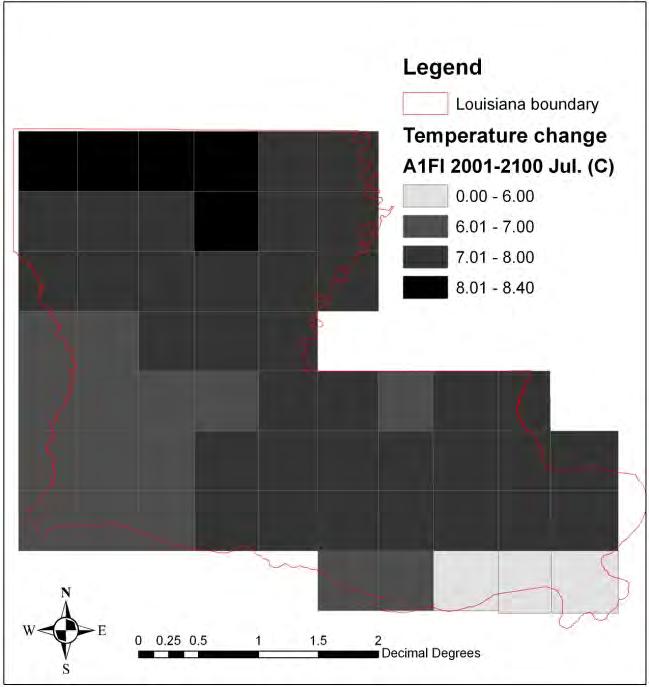

27 July 27

,")
28 Precipitation changes in Jan. between 2001 and 2100 in Louisiana under A1FI, A2, and B2 scenarios of HadCM3 climate model Climate datasets provided by the Climate Research Unit (CRU), University of East Anglia, UK. 28
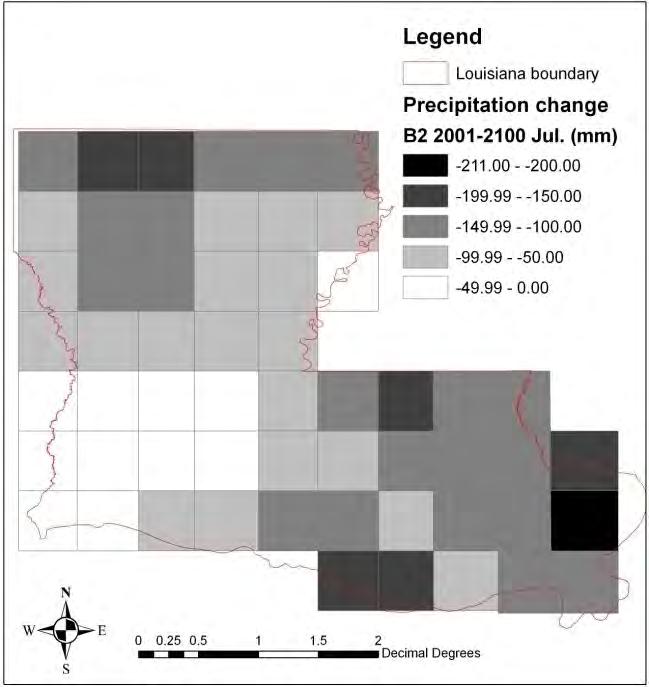
29 July 29

30 SOC spatial patterns between 2001 and 2100 in Louisiana s forests and croplands under three HadCM3 scenarios: A1FI, A2, and B2 30
31 SOC changes from 2001 to 2100 in Louisiana s soils in different land covers under three climate change scenarios. Percentage changes Total SOC reduction and areas Percent -25.0% -20.0% -15.0% -10.0% -5.0% 0.0% deciduous forest evergreen forest mixed forest pasture hay row crops Land cover category small grains A1FI A2 B2 SOC reduction (ton) Millions deciduous forest evergreen forest mixed forest pasture hay row crops small grains A1FI A2 B2 Area Land cover category 31
32 Several sources of uncertainty: Climate models and emission scenarios: HadCM3,, CGCM2, CSIRO, ECHAM4, NCAR-DOE etc.; SRES emission scenarios as A1, A2, B1 and B2 storylines and scenario families (IPCC, 2007). SOC models: RothC, CENTURY, CANDY, DNDC, and DAISY etc. Net primary production (NPP),was not estimated and applied in this research. Other sources of uncertainty are non-uniform subwatersheds, land use changes, increasing distribution of biofuel crops, and effect of Kyoto Protocol etc. 32
33 Summary This study estimated the SOC stocks from two national soil databases, STATSGO and SSURGO. SOC relationships with terrain parameters and watershed characteristics: SOC was positively correlated with drainage density, but negatively correlated with slope gradient and elevation. The mean SOC in forests and croplands in Louisiana at watershed scale is projected to decrease using ROTHC model assuming other factors were stable and only considering the climate change impacts from 2001 to

34 Questions 34
35 35
36 SOC Storage Soil Databases upper 30 cm Upper 100 cm maximum measured depths (up to 2.75 meter) SSURGO 0.61 Pg 1.3 Pg 1.9 Pg STATSGO 0.56 Pg 0.98 Pg 1.4 Pg Difference 9% 33% 36% (1 petagram = g=1 billion metric tons)

37 Sequester and trade carbon credit 37
38 Soil carbon sequestration: technological options (Lal, 2004) Traditional methods 1. Biomass burning and residue removal Recommended management practices Residue returned 2. Conventional tillage Conservation tillage, no till 3. Bare/idle fallow Growing cover crops during the off-season 4. Continuous monoculture Crop rotations with high diversity 5. Surface flood irrigation Drip, furrow or sub-irrigation 6. Intensive use of chemical fertilizers Integrated nutrient management with biosolids, nutrient cycling, and precision farming 38
39 The potential of world soils to sequester carbon (Lal, 2004) All other factors remaining the same, the potential of SOC sequestration is in the following order: Degraded soils and desertified ecosystems > cropland > grazing lands> forest lands and permanent crops Wetland? 39
40 ROTHC Model The Rothamsted Carbon is one of the most widely used soil organic carbon (SOC) models and has been evaluated in a wide variety of ecosystems including croplands, grasslands and forests. The model was adapted to run with large spatial datasets and to use potential evapotranspiration (PET) in place of open pan evaporation. RothC-26.3 is a model of the turnover of organic carbon in non-waterlogged soils that allows for the effects of soil type, temperature, moisture content and plant cover on the turnover process. 40
41 Rothamsted Research Center in UK RothC-26.3 computes the changes in organic carbon as it is partitioned into five basic compartments: inert organic matter (IOM), decomposable plant material (DPM), resistant plant material (RPM), microbial biomass (BIO) and humified organic matter (HUM). In an equilibrium mode, IOM is the only parameters needed 41