Using the Community Earth System Model in African Great Lakes Watersheds to inform Regional Stakeholders and Conservation Planners
|
|
|
- Charles Hodge
- 5 years ago
- Views:
Transcription


1 Using the Community Earth System Model in African Great Lakes Watersheds to inform Regional Stakeholders and Conservation Planners Anton Seimon, Appalachian State University, USA Deborah Lawrence, University of Virginia, USA Peter Lawrence, National Center for Atmospheric Research, USA Salvi Asefi-Najafabady, University of Virginia, USA 3 May 2017 African Great Lakes Conference
2 CONSERVATION STRATEGY FOR THE GREAT LAKES REGION OF EAST AND CENTRAL AFRICA BirdLife International & MacArthur Foundation (2012) Actions needed on climate change for biodiversity conservation and the services biodiversity provides to humanity across the Great Lakes Region. Integrate climate change in all forms of planning. Perform lake-basin scale climate change assessments. Understand the direct impacts climate change has on biodiversity and the biophysical environment Understand the indirect responses from human action. Understand the response of other threats to climate change. Integrate monitoring into planning and vulnerability assessments. Test different adaptation solutions. Undertake no regrets actions now. Ch. 5, Seimon et al.)

3 IPCC Multi-model Projections for East Africa How do we translate such information into environmental outcomes? What is the climate change information that stakeholders actually need?

4 Earth System processes & feedbacks that govern climatic conditions Source: NCAR CESM project
5 CESM Approach to Modeling Historical and Future Human and Earth Systems NCAR s Global Human and Earth System Modeling tools show how humans change the Earth System through emissions of greenhouse gases and aerosols, and from changes in surface processes through land use and land cover change. Great Lakes Project Interest: Can these global models be used regionally with higher spatial resolution and improved local understanding to evaluate how human activity and climate change are impacting the natural and human systems of the African Rift Valley? If so, how can they be best utilized to inform Conservation and Resource Management through the region? Slide 2 - Outline
 Historical or Future Climate")
")
 Climate (30 mins): Temp.")


 Land Surface (30")
6 NCAR Global Human and Earth System Modeling Community Earth System Model (CESM) Historical or Future Climate Scenarios (RCPs) Emissions: CO 2, CH 4, N 2 O, Aerosols Historical or Future Socio Economic Scenarios (SSPs) Population, GDP, Energy mix (Annual) Integrated Assessment Model (ipets / GCAM) Climate (30 mins): Temp. Precip. Sea Ice Modeled Impacts: Heating / Cooling, Carbon, Water, Wood, Food, Biofuel Analysis Tools for: Climate, Water, Crops, Ecosystems Land use: Crop, Forestry, Conservation, Carbon, Urban Historical Data/Downscale Models Community Land Model (CLM) Land Surface (30 mins): Hydrology, Carbon, Crops, Ecosystem Dynamics, Fire Slide 4 Land Cover Change


7 Improvements in Model Resolution Tanganyika basin annual rainfall Typical GCM grid cell size 10 years ago: 2.5 x 2.5 In specialized CESM runs for GLR region: 0.1 x 0.1 same region now contains 756 grid cells

8 MacArthur project partners workshop Gisenyi, Rwanda, Sept 2014

9 Partners Workshop Sept 2014
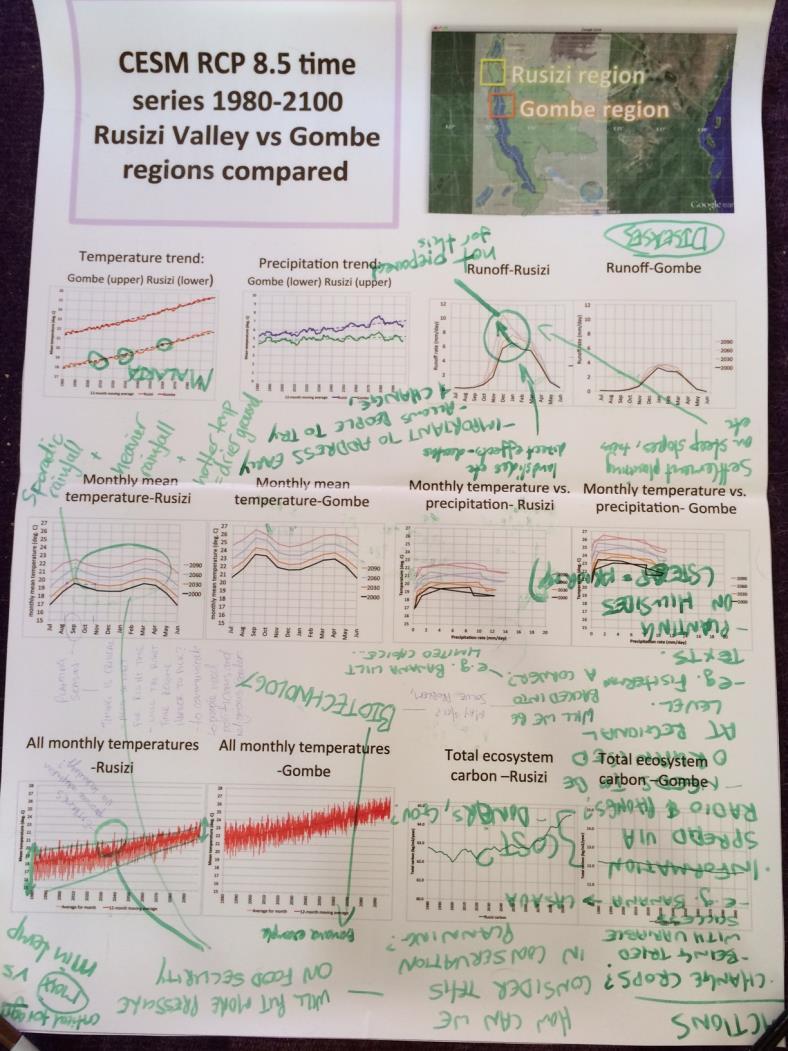
10 CESM RCP8.5: Hydrological Runoff changes in the Lake Kivu-Rusizi region 12 Runoff rate (mm/day) Seasonal runoff peak moves earlier & greatly increases in magnitude Jul Aug Sep Oct Nov Dec Jan Feb Mar Apr May Jun 2000
 with late-century prediction (2070-2099) RCP 8.")
11 Community Earth System Modeling of High-Stress Climatic Conditions High-resolution fully coupled simulations 0.25 Contrast recent past ( ) with late-century prediction ( ) RCP 8.5 (business as usual, high warming)
12 What is heat stress? Apparent Temperature - relative humidity (RH), Temp (T), wind speed (WS) (Garland et al., 2015)
, Temp (T),")
13 What is heat stress? Apparent Temperature - relative humidity (RH), Temp (T), wind speed (WS) (Garland et al., 2015)
14 Annual extreme heat stress (days AT > 39 C)
 1979-2012")
15 Annual extreme heat stress (days AT > 39 C)
 Lake Turkana Basin")
16 Annual extreme heat stress (days AT > 39 C) Lake Turkana Basin


17 Seasonal extreme heat stress (days AT>39 C) Dec-Feb March-May June-Aug Sept-Nov Recent past Late-century days


 expected over a 5-day period in a given year Le : typical year around 2005 Center: typical year around 2045 Right : typical year around 2085")
18 Poster on high stress climatic conditions Copies available for you to take home! Other CESM products to be placed online as they become available, can also be ed directly to stakeholders. W atersheds of the A frican G reat L ak es 21 st Century Changes in High-Stress Clima c Condi ons Overview Earth system models integrate physical, chemical and biological processes that determine past, present and future climate. We use the Community Earth System Model (CESM) to generate depictions of environmental futures under climate change for major African Great Lake watersheds. These predictions offer state-of the-science guidance for a multitude of environmental variables to serve stakeholder planning needs. Here we demonstrate predictive products that indicate the increasingly stressful climatic conditions likely to occur over coming decades across the lake watersheds, with potentially severe impacts upon natural systems, humanity, agriculture, lake ecology and ecosystem services. Heat Stress Number of days per year that Apparent Temperature reaches 39 C or higher; Apparent Temperature combines humidity, air temperature and wind. Values >39 C are extremely stressful to humans and most species Le : typical year around 2005 Center: typical year around 2045 Right : typical year around 2085 NOTES: All values increase over me: no areas expected to see fewer days of Heat Stress. Areas trending to red will become inhospitable to many forms of agriculture, and fire intensity is likely to increase. Intense Mul day Rainfall Maximum total rainfall (mm) expected over a 5-day period in a given year Le : typical year around 2005 Center: typical year around 2045 Right : typical year around 2085 NOTES: All values exhibit increases over me: there are no areas expected to experience lessintense rainfall. A major new hotspot of intense rainfall emerges in western Kenya and the Winam Gulf on Lake Victoria. The eastern DRC maximum is well represented, but an equally strong maximum over southwest Lake Victoria is not captured by the model Seasonal drought Number of consecu ve dry days in the longest dry season: Le : Dry season dura on in a typical year around 2005 Center: change in number of days in 2045 compared to 2005 Right : change in number of days in 2085 compared to 2005 Prepared by Anton Seimon PhD, Salvi Asefi-Najafabady PhD, Deborah Lawrence PhD & Peter Lawrence PhD for the African Great Lakes Conference, Entebbe, Uganda, 2-5 May 2017 How to use this information. We have used the high greenhouse gas and land-use change Representative Concentration Pathways (RCP) 8.5 to examine how climatic extremes and vegetation may develop over coming decades across the Great Lakes watersheds. The predictions shown here offer just one representation of possible environmental futures for the region, whereby it is important to recognize that other predictions by CESM and other earth system models may show very different results. 2005: Heat Stress days above 39 C 2045: Heat Stress days above 39 C 2085: Heat Stress days above 39 C Dem. Rep. Congo Zambia South Sudan Rwanda Burundi Uganda Tanzania Malawi Ethiopia Kenya Mozambique Somalia Dem. Rep. Congo Zambia South Sudan Rwanda Burundi Uganda Tanzania Malawi South Sudan 2005: 5-day rainfall maximum 2045: 5-day rainfall maximum 2085: 5-day rainfall maximum Dem. Rep. Congo Zambia South Sudan Rwanda Burundi Uganda Tanzania Malawi Ethiopia Kenya Mozambique Somalia Dem. Rep. Congo Zambia South Sudan Rwanda Burundi Uganda 2005: Seasonal Drought Dura on 2045: Seasonal Drought Dura on 2085: Seasonal Drought Dura on Dem. Rep. Congo South Sudan Rwanda Burundi Uganda Tanzania Ethiopia Kenya Somalia Dem. Rep. Congo South Sudan Rwanda Burundi Uganda Ethiopia Kenya Mozambique Tanzania Malawi Ethiopia Kenya Mozambique Tanzania Ethiopia Kenya Somalia Somalia Somalia Dem. Rep. Congo Zambia Dem. Rep. Congo Zambia Dem. Rep. Congo Rwanda Burundi Uganda South Sudan Rwanda Burundi Uganda South Sudan Rwanda Burundi Uganda Tanzania Malawi Ethiopia Kenya Mozambique Tanzania Malawi Ethiopia Kenya Mozambique Tanzania Ethiopia Kenya Somalia Somalia Somalia NOTES: Dry season shortens by up to one month in southeast Ethiopia and southern DR Congo, while it increases up to two months in dura on in Tanzania, Zambia and the Lake Malawi watershed Zambia Malawi Mozambique Zambia Malawi Mozambique Mozambique Zambia Malawi Heaviest 5-day rainfall Hydrological Runoff The amount of rainfall per year (mm) that flows into water bodies and is not taken up by vegeta on, groundwater recharge or evapora on. Le : Runoff amount in typical year around 2005 Center: Change in runoff by 2045 compared to 2005 Right: Change in runoff by 2085 compared to 2005 NOTES: Highland regions of the Alber ne Ri, western Kenya and southwest Ethiopia stand to increase their func on as water towers against a hea ng and drying climate 2005: Annual Runoff total (mm) 2045: Difference in Runoff from : Difference in Runoff from 2005 South Sudan South Sudan South Sudan Ethiopia Ethiopia Ethiopia Somalia Somalia Somalia Uganda Uganda Uganda Kenya Kenya Kenya Rwanda Rwanda Rwanda Dem. Dem. Dem. Burundi Burundi Burundi Rep. Rep. Rep. Congo Tanzania Congo Tanzania Congo Tanzania Mozambique Mozambique Mozambique Zambia Zambia Zambia Malawi Malawi Malawi mm/year mm/year mm/year For more informa on: h p://www2.cesm.ucar.edu For data and updates: h p:// valley.html

19 How to use this information The predictions shown on the poster offer just one representation of possible environmental futures for the region, whereby it is important to recognize that other predictions by CESM and other earth system models may show very different results.


20 CLM5 CMIP6 New Land Surface Descriptions Global Land Model (GLM): annual time series dynamics of agriculture and forests through changes in 12 land units at 27 km spatial resolution. - Primary Forest - Primary Non Forest - Secondary Forest - Secondary Non Forest - Crop C3 Annual - Crop C3 Perennial - Crop C3 Nitrogen Fixing - Crop C4 Annual - Crop C4 Perennial - Grazing Pasture - Grazing Rangeland - Urban Land management detailed for Crops and Forests through annual crop specific Nitrogen Fertilizer and Irrigation, and five Wood Harvest classes Slide 2 - Outline
21 Maize Coffee Rice Sorghum Percent coverage by crop types in 2005; can be predicted by CESM-CLM for each crop in the future 32 crop types currently considered Slide 4 Land Cover Change
22 Current work - CESM East Africa Rift Valley Modeling Strategy Understand how Natural and Human Systems have been, or potentially will be, impacted by: 1. Climate, through changes in: Temperature that impacts vegetation directly through photosynthesis responses, and agriculture through flowering and grain fill, as well as people through heat stress and disease. Precipitation that impacts surface hydrology and through that vegetation and agriculture through water availability, and streams and and lakes through changes in runoff. Relative humidity and wind speed that impact potential evaporation, the vapor pressure deficit response of vegetation, and fire ignition, intensity and spread. 2. Atmospheric CO 2 concentration through changes in: Photosynthesis through carbon availability, with higher CO 2 resulting in higher productivity. Water use efficiency, with less water loss for the same carbon uptake. Slide 2 - Outline
23 Current work - CESM East Africa Rift Valley Modeling Strategy 3. Land Cover Change: Deforestation for agricultural expansion of crops and pastures. Wood harvest for timber production along with other forest disturbance. Conservation and afforestation for carbon storage and biodiversity protection. Biofuel production from forests and crops. 4. Land Use Management: Changes in crop production resulting from cropping area, fertilizer application, irrigation use and crop selection. Changes in carbon storage in response to crop practices. Changes in water availability in streams and lakes through irrigation withdrawal and water management. Slide 2 - Outline
24 East African Rift Valley Shared Socioeconomic Selection Slide 4 Land Cover Change
25 East African Rift Valley Shared Socioeconomic Pathways (SSP) SSP1 Path to sustainability: optimistic SSP3 Business as usual pessimistic Slide 4 Land Cover Change
26 Slide 4 Land Cover Change SSP1 & SSP3 Tree cover change

27 Great Lakes Region SSP1 & SSP3 Tree cover change
28 Current work - Creating a diverse set of environmental predictions Compare how Natural and Managed systems respond: - under changing CO 2 and climate - with and without Land Use and Land Cover Change - for the Historical and two different Future Climate Scenarios Specific CESM model runs: spin up of carbon cycle at 0.1 degrees from global 1850 simulation. 2a. Historical simulation with ramping CO 2 and climate. 2b. Historical simulation with no Land Use Land Cover Change 3a. SSP1 Land Use with RCP4.5 atmospheric conditions b. SSP3 Land Use with RCP4.5 atmospheric conditions c. No Land Use (2015 vegetation distribution) with RCP4.5 atm a. SSP1 Land Use with RCP8.5 atmospheric conditions b. SSP3 Land Use with RCP8.5 atmospheric conditions c. No Land User (2015 veg no wood harvest) with RCP 8.5 atm These outputs will be available to all, can be used to inform decision making Slide 2 - Outline