Greenhouse gas balance of native forest management: a new approach Fabiano Ximenes and Stephen Roxburgh
|
|
|
- Emerald McCormick
- 5 years ago
- Views:
Transcription


1 Greenhouse gas balance of native forest management: a new approach Fabiano Ximenes and Stephen Roxburgh February 2016
 Justin Williams, Ken Boer (FCNSW) Michael Ryan (VicForests) Simon Murphy (University of")
2 Project Team Fabiano Ximenes, Michael Mclean, Rebecca Coburn, David Sargeant, Matt Mo, Nick Cameron, Huiquan Bi (NSW DPI) Stephen Roxburgh and Debbie Crawford (CSIRO) Justin Williams, Ken Boer (FCNSW) Michael Ryan (VicForests) Simon Murphy (University of Melbourne)
3 Project Steering Committee Martin Moroni (Chair, Private Forests Tasmania) Jaymie Norris and Simon Wong (DSE) Mick Stephens (AFPA) Andrew Lyons (FPC WA)
4 Talk Outline Carbon in native forests: context Description of approach Forest biomass determinations Carbon storage in HWPs Product substitution impact Fossil fuel displacement: bioenergy Cost-benefit Modelling approach Summary
5 Australian forests: snapshot Australia's Total Forest Area million hectares Native Forest M ha Leasehold- 49 Mha Private land (including indigenous) - 33 Mha Nature conservation reserves - 21 Mha Multiple-use public forest - 10 Mha Other Crown land - 9 Mha Plantation - 2 M ha Other M ha Net Public Harvestable Area Mha NF Harvested per year 0.1 M ha

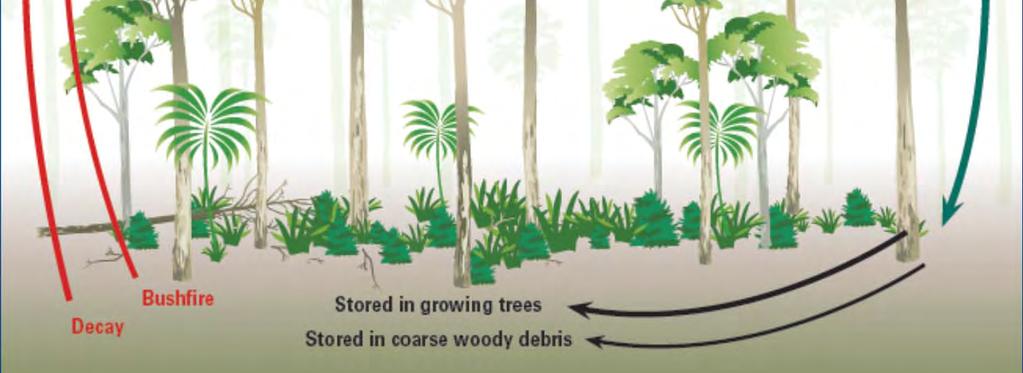
6 C Stocks and Flows Conservation Native Forests


7 C Stocks and Flows Production Native Forests Important to consider what the atmosphere sees.


8 Carbon in Native Forests
9 Case Study North Coast tc ha Net product substitution Fossil fuel emissions offset by bioenergy (30 % of available forest residues) Carbon storage in products Forest carbon (remaining in harvested forest) "Conservation" forest Years Ximenes et al 2012
10 Project Aim to provide a whole of life assessment of the implications of native forest management for carbon stocks and fluxes for three representative commercial native forestry areas in NSW and VIC. Project Period:
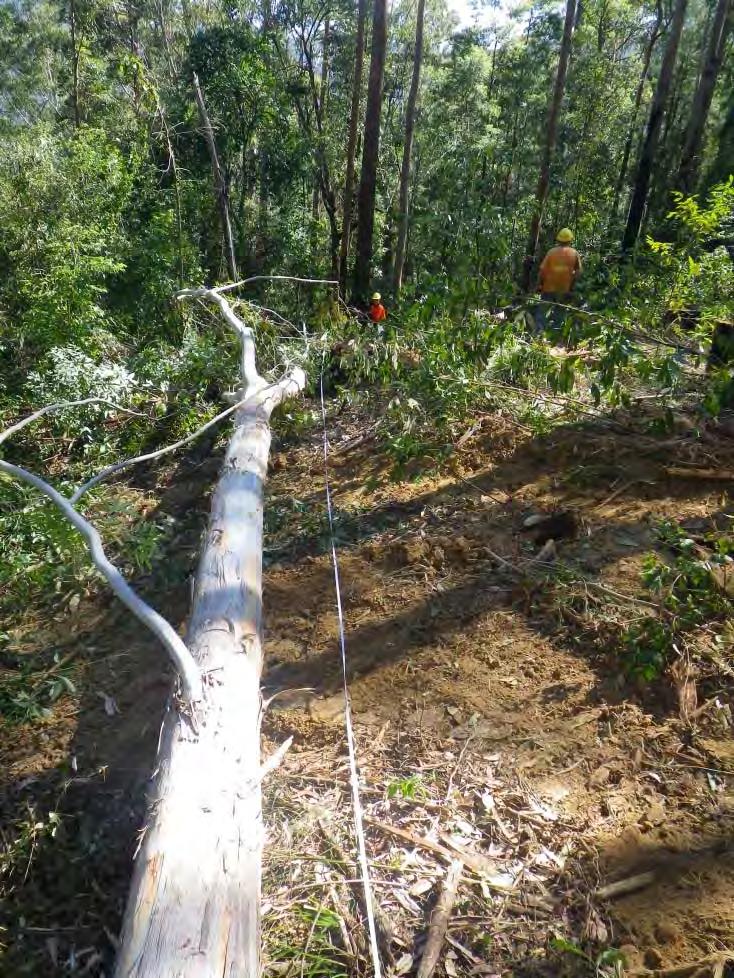
11 Approach Detailed site-specific measurements, with direct weighing of ABG biomass pools Detailed assessment of fate of logs and products at a regional level Check against regional averages Detailed market analysis at regional level to inform product substitution factors Integrated modelling: landscape level, gross production area, averages from longterm simulations (new model)

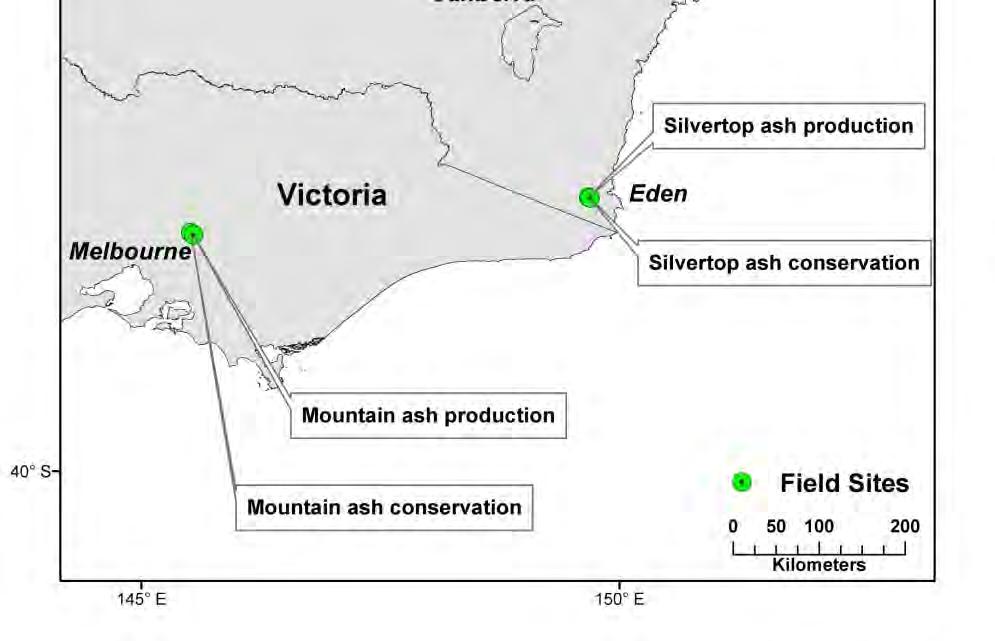
12 Study Areas

13 Stand info Site Stand Age (Circa) Plot Dimensions and Area Mean Annual Rainfall (mm) No. Trees in Plot Silvertop ash production Silvertop ash conservation Blackbutt production Blackbutt conservation Mountain ash production ; years* ; >200 years* m x 46.8m (0.47 ha) m x 47.5m (0.48 ha) m x 46.5m (0.5 ha) m x 60m (0.48 ha) m x 53m (0.53 ha) Mountain ash conservation ha * Multi aged species


14 SA Prod BBT Prod SA Cons BBT Cons
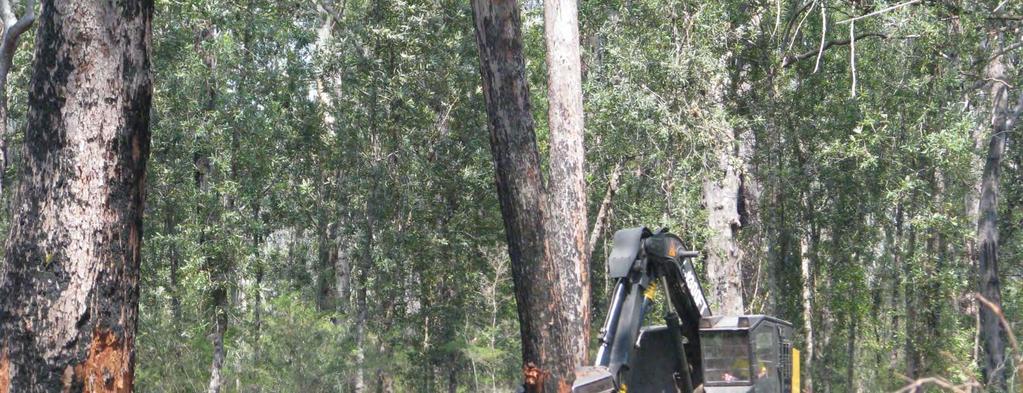

15


16

17 INCLUDE SELECTED BBUTT PICS

18


19

20


21
 160 140 120 100")


22 40-60 cm: 48% of biomass Silvertop ash Conservation Biomass (t/ha) >90 cm: 80% of biomass No.Trees Silver Top Ash Dead Messmate River Pepermint Acacia sp No.Trees 0 0 DBH_CLASS (cm)
23 Production and residue volumes Sites Silvertop ash production FCNSW average forecast Blackbutt production FCNSW average forecast Mountain ash production VicForests Toolangi average forecast Production volume (m 3 / ha) Production volume (%) Residue volume (m 3 / ha) Residue volume (%) Total Volume (m 3 / ha) (17) (10) (23) (15) (13) (21)
24 Total Biomass (0% MC) Dry Biomass (t / ha) Residues Production Site Bark % Crown % Stump % Other % Production log% Total Silvertop ash production Silvertop ash conservation Blackbutt production Blackbutt conservation Mountain ash production Mountain ash conservation NA NA NA NA NA Estimated using allometric relationships
25 Carbon storage in harvested wood products Majority of wood products used for residential construction Average service life of wood products in houses: 45 years Needs to consider both storage in service and post-service


")


26 5) Carbon storage in HWP in landfills Field excavations (6 in NSW and 3 in QLD) Lab-scale bioreactors (sawn timber, engineered wood products, paper) Only 1-2 % loss from EWPs and sawn timber Recycling / Landfill / Energy = Good GHG outcome
27 Biomass distribution - Blackbutt Residues for energy at the Mill 4.1% Residues for energy ex mill 4.1% Harvest Residues Left in the Forest 51.4% Short-lived residues 19.5% HWP 20% Landfill 0.5% Landfill 16.4% Residues used to Produce Energy 1.4% Short Lived Waste 2.6% Structural 6.5 Electricity Poles 4.6 Floor/Deck 4.1 Mining Timbers 2.2 Pack/Landscape 1.8 Fencing 1.3
28 Product Substitution Wood: renewable material Wood manufacture: low-energy intensity Processing residues used to generate energy Physical carbon storage Alternatives: non-wood and imported wood - Non-renewable - High emission intensity - No carbon storage


29 Product Substitution Native hardwoods

: SE Asia, China 5.5-7.")

30 Pulp: product substitution Pulp and paper often dismissed If no more pulp from VIC and Eden different feedstock for writing paper Most likely candidates (short to medium term): SE Asia, China t C emitted for each t of C in pulp logs not produced in study areas Product substitution impact: 218 t C/ha (SA) and 1200 t C/ha (MA)


31 Biomass Benefits for Bioenergy of Bioenergy Large volumes of biomass available BAU: decay or burn in the forest, burn to waste or short-lived (e.g. mulch) in sawmills Clear FF displacement benefits Benefits will depend on commercial/residential applications
32 Socio-economic implications Regional economic impact of transition (NSW) Cost-benefit Effect of Carbon price NPV and benefit-cost ratios were calculated for each scenario using a real discount rate of 7.5% Financial modelling over a 65 year period (average native forestry rotation length in NSW)
33 Key Results Cost of transition: For Eden: $64 M, and loss to economy is $308 M Socio-economic: Loss of 265 jobs in Eden and 2824 jobs on the NSW North Coast Carbon pricing: On the north coast the conservation scenario required a carbon price of $233/tCO 2 -e for it to break even with BAU. Recognising C abatement through production scenarios generated greatest economic returns and largest amount of C abatement.
34 Modelling approach Create a model/calculator to: Track the flow of C in the forest. Track the flow of carbon in HWPs & landfill. Track any HWP substitution and bioenergy offsets. Integrate the project results, and allow exploration of alternate management scenarios and their impacts on the net forest + HWP carbon balance.
35 Net Primary Productivity Living biomass Leaf Stem & Branch Fine Root Coarse Root Litter biomass Leaf Stem & Branch Standing dead stag Fine Root Coarse Root Humus Soil organic carbon (SOC ) Stable Legend Forest C Transfers Wildfire C Transfers Harvesting/HWP C Transfers Bioenergy C Transfers Time lag (standing dead trees; HWP service life) ForestHWP Forest C
36 Net Primary Productivity * * * * * Litter biomass Living biomass Leaf Leaf * * Stem & Branch Stem & Branch * Standing dead stag Fine Root Coarse Root Fine Root * * Coarse Root * * Humus Soil organic carbon (SOC ) Stable Legend Forest C Transfers Wildfire C Transfers Harvesting/HWP C Transfers Bioenergy C Transfers Time lag (standing dead trees; HWP service life) ForestHWP Forest C + Fire
37 Net Primary Productivity * * * To HWP + Bioenergy * * Litter biomass Living biomass Leaf Leaf * * Stem & Branch Stem & Branch * Standing dead stag Fine Root Coarse Root Fine Root * * Coarse Root * * Humus Soil organic carbon (SOC ) Stable Legend Forest C Transfers Wildfire C Transfers Harvesting/HWP C Transfers Bioenergy C Transfers Time lag (standing dead trees; HWP service life) ForestHWP Forest C + Fire + Harvest
38 Waste Waste Net Primary Productivity Waste Living biomass Leaf Stem & Branch Fine Root Coarse Root Harvested wood products (HWP) HWP I HWP II HWP III + Wood product substitution Litter biomass Leaf Stem & Branch Standing dead stag Fine Root Coarse Root - Transport / Energy emissions Humus Soil organic carbon (SOC ) Stable Legend Forest C Transfers Wildfire C Transfers Harvesting/HWP C Transfers Bioenergy C Transfers Bioenergy Biofuel I Biofuel II Waste Time lag (standing dead trees; HWP service life) + Fossil fuel offsets - Transport / Energy emissions ForestHWP Forest C + Fire + Harvest
39 Waste Waste Net Primary Productivity Waste Living biomass Leaf Stem & Branch Fine Root Coarse Root Harvested wood products (HWP) HWP I HWP II HWP III + Wood product substitution Litter biomass Leaf Stem & Branch Standing dead stag Fine Root Coarse Root - Transport / Energy emissions Waste Waste Waste HW P in Landfill HWP I HWP II HWP III Waste (Slow) Soil organic carbon (SOC ) Humus Stable Legend Forest C Transfers Wildfire C Transfers Harvesting/HWP C Transfers Bioenergy C Transfers - Transport / Energy emissions Bioenergy Biofuel I Biofuel II Waste (Medium) Waste (Fast) Waste Time lag (standing dead trees; HWP service life) + Fossil fuel offsets - Transport / Energy emissions ForestHWP Forest C + Fire + Harvest + Landfill

40
41 Overall procedure Translate the conceptual model diagram into maths, and verify the framework is capable of replicating forest and HWP carbon dynamics (not covered in this talk). For each of the three case studies: Calibrate ForestHWP to field data Simulate the forest carbon stocks and fluxes to predict changes in living and dead biomass carbon storage, and the impacts of wildfire ( conservation scenario). As above, but including current harvesting management ( BAU scenario). Explore a range of alternate management scenarios, and compare with BAU.
42 Scenarios VIC Mountain Ash NSW Silvertop Ash NSW Blackbutt 30% forest residue to bioenergy Conservation (forest) BaU Business as Usual (forest + HWP, current harvesting parameters) Processing waste and end of service life (EoL) products to bioenergy Maximise product recovery Maximise landfill Maximise bioenergy 30% forest residue to bioenergy 50% forest residue to bioenergy 50% pulp to bioenergy 50% pulp to bioenergy 50% forest residue to pulp 100% pulp to bioenergy 100% pulp to bioenergy Increase product to poles EoL pallets to landfill EoL pallets to bioenergy
43 Model outputs Historical calibration Long-term average (LTA) scenario outcomes tc / ha yrs Above ground biomass (AGB) Dead stags Obs AGB (Conservation) Obs CWD (Conservation) Coarse Woody Debris (CWD) Obs AGB (Production) Obs CWD (Production) ForestHWP calibrated to known site data (fieldwork, literature) and run until present (2014)
44 Model outputs Historical calibration Long-term average (LTA) scenario outcomes tc / ha yrs Above ground biomass (AGB) Dead stags Obs AGB (Conservation) Obs CWD (Conservation) Coarse Woody Debris (CWD) Obs AGB (Production) Obs CWD (Production) ForestHWP calibrated to known site data (fieldwork, literature) and run until present (2014)
45 Model outputs Historical calibration Long-term average (LTA) scenario outcomes tc / ha yrs Above ground biomass (AGB) Dead stags Obs AGB (Conservation) Obs CWD (Conservation) Coarse Woody Debris (CWD) Obs AGB (Production) Obs CWD (Production) ForestHWP calibrated to known site data (fieldwork, literature) and run until present (2014)
46 Model outputs Historical calibration Long-term average (LTA) scenario outcomes tc / ha yrs Above ground biomass (AGB) Dead stags Obs AGB (Conservation) Obs CWD (Conservation) Coarse Woody Debris (CWD) Obs AGB (Production) Obs CWD (Production) ForestHWP calibrated to known site data (fieldwork, literature) and run until present (2014) 2000 replicate runs of each scenarios; results averaged (50yr, 100yr, LTA)
47 Model outputs Area available for harvest (60%) C store under current harvest and wildfire regime = 100 tc/ha (Harvesting scenario) Area unavailable for harvest (40%) C store under current wildfire regime = 300 tc/ha (Conservation scenario) Total Landscape Carbon Store = (0.6 x 100 tc/ha) + (0.4 x 300 tc/ha) = 180 tc/ha Proportion of region available for harvest Proportion of region excluded from harvest Vic Mountain Ash NSW Silvertop Ash NSW Blackbutt
48 Example parameters Parameter VIC Mountain Ash NSW Silvertop Ash NSW Blackbutt Mean wildfire return interval (yrs) Harvest rotation length (yrs) Proportion of coupe affected by harvest Harvest destinations Proportion material left on site Proportion extracted as dry boards Proportion extracted as green boards Proportion extracted as poles 0.05 Proportion extracted as pulp Product substitution factors (Kg offset / Kg produced) Dry Board Green board Pulp (single rotation only) Bioenergy offset factors (Kg offset / Kg combusted) Residential Commercial
49 Results tc / ha Victoria Central Highlands Total AG dead C in forest Total AG live C in forest Landfill + In service HWP Energy substitution Non pulp HWP substitution Pulp HWP substitution 200 0
50 Results tc / ha NSW South Coast Silvertop Ash Total AG dead C in forest Total AG live C in forest Landfill + In service HWP Energy substitution Non pulp HWP substitution Pulp HWP substitution
51 Results tc / ha NSW North Coast Blackbutt Total AG dead C in forest Total AG live C in forest Landfill + In service HWP Energy substitution Non pulp HWP substitution Pulp HWP substitution
52 Results BAU vs. conservation % of conservation Vic Mountain Ash NSW Silvertop Ash NSW Blackbutt 40 Including product substitution Excluding product substitution
53 Results Scenarios vs. BAU 50 Vic Mountain Ash NSW Silvertop Ash 40 NSW Blackbutt % of Business as Usual All end of life products, and all processing waste to bioenergy Waste to product (Max product) Max product to landfill 40 Max product to bioenergy 30% of forest residue to bioenergy 50% pulp to bioenergy % pulp to bioenergy End of service life pallet mulch to landfill 40 End of service life pallet mulch to commercial bioenergy 50% of forest residue to bioenergy 50% of forest residue to pulp Alter product spread, to yield a greater proportion of poles
54 Summary Results Accrued GHG benefits for BAU were greater than conservation for Mountain Ash and Silvertop Ash, driven by the pulp substitution benefit. Accrued GHG benefits for BAU were less than conservation for Blackbutt, driven by the lack of a pulp/residue market. All scenarios (apart from those shifting from pulp to bioenergy) increased net C benefit compared to BAU. Overall C response to harvesting is context dependent. Different outcomes are possible depending on the forest characteristics, the harvesting regime, and the HWP mix (including substitution benefits, and the proportion entering landfill).
55 Summary ForestHWP A new model for quantifying the full forest HWP system has been designed, developed and tested (ForestHWP). Cohorts of HWPs are kept separate in the calculations, with defined service lives (c.f. the typical assumption of a single HWP bucket that declines exponentially) Lagged decay of standing dead stags Monte Carlo analysis to allowing averaging over asynchronous fire and harvesting events. Caveats: system complexity, uncertainties in most parameters, especially related to forest growth and decay processes, soil & roots. Next steps? Contact details: stephen.roxburgh@csiro.au, Ph
56 Key Messages When forest only is considered: conservation results in clearly greater GHG benefits not so when full GHG balance considered Region specific C storage and substitution essential for overall GHG balance Forest HWP ( what the atmosphere sees ) GHG balance / socio-economic factors / Carbon pricing do not warrant switch from production to conservation Great potential: e.g. better use of residues

57 Thank you!