Technical Memorandum. Hydraulic Analysis Smith House Flood Stages. 1.0 Introduction
|
|
|
- Marlene Short
- 5 years ago
- Views:
Transcription
1 Technical Memorandum Hydraulic Analysis Smith House Flood Stages 1.0 Introduction Pacific International Engineering (PIE) performed a hydraulic analysis to estimate the water surface elevations of the Skagit River at the Smith House, located in Hamilton, associated with the magnitude of the 1909, 1917, and 1921 floods as they were estimated by James E. Stewart. This Technical Memorandum was performed under a contract for professional services authorized in May 2007 by the City of Burlington, WA. Peak flow values of the Skagit River at River Mile (RM) near Concrete for the four unrecorded floods, which occurred in 1897, 1909, 1917, and 1921, were estimated by James E. Stewart in an unpublished report dated in 1923 and in 1961 published U.S. Geological Survey (USGS) Water Supply Paper 1527 (WSP 1527). Table 1 presents the peak flows estimated by Stewart for these four floods at RM Table 1 Stewart s estimated peak stages and discharges of Skagit River near Concrete for four unrecorded floods Flood Gage Height at Current Gage* as Published in 1961** (ft) Staff Gage Height*** Estimated by Stewart in 1923**** (ft) Discharge Estimated by Stewart in 1923**** (cfs) , , , ,000 * Current gage datum El (NGVD29) at RM ** These numbers are an extrapolation performed and published by USGS in WSP 1527 (USGS 1961), based on Stewart s 1923 estimated gage heights presented in column 3 of this table *** Prior to Dec. 10, 1924, a staff gage was located at RM 54.19, 200 feet upstream of the current gage location and at datum 12.7 feet higher than the current gage site (Flynn 1954) **** These unpublished 1923 estimates by James Stewart were documented in the 1961 U.S. Geological Survey Water Supply Paper (WSP) 1527 (USGS 1961). In his 1923 report, Stewart stated it seems likely that a few floods corresponding to 1917 and 1921 may occur within 5 or 6 years. In Stewart s view at that time, the magnitude of the 1917 and 1921 floods was not major events, but he categorized them as low frequency events with 5-year to 6-year return intervals. However, continuous operation of the USGS streamflow gage near Concrete began in December To date, none of the recorded Technical Memorandum Page 1
2 peak flow data (even unregulated to eliminate effects due to Ross and Baker dams flood control storage operation) has ever exceeded the smallest peak flow value (220,000 cfs for the 1917 flood) estimated by Stewart. During 1918, Stewart documented a lower set of estimates for the peak flow values associated with the unrecorded floods. These estimates were 205,000 cfs (1897), 185,000 cfs (1909), and 175,000 cfs (1917), (Kunzler 2006). Reasons for the differences between Stewart s 1918 and 1923 estimates are not documented and remain unknown. Lack of consistent supporting documentation and an inability to duplicate calculations of the peak flows estimated by Stewart in 1923 have stimulated numerous studies and reviews which examine the data, methodology, and calculations that Stewart used to generate his estimates. Some of these studies have included revised estimates for the peak flows of the four floods. Forensic analysis of the Smith House concludes that the 1909, 1917, and 1921 flood elevations could not have been above the floor boards in the Smith House because of the lack of water marks. The hydraulic model developed for this technical memorandum was calibrated to the flood marks of the 1995 and 2003 flood peaks. The maximum flood peak that could have occurred in the Skagit River at the Smith House in the time frame of the unrecorded floods would have been 188,000 cfs. This amount is substantially less than the USGS published flows, but corresponds well to the 1918 Stewart estimates. 2.0 Background The Smith House is located at 307 Maple Street in the City of Hamilton, or at RM 40.00, approximately 14 miles below the location of Stewart s flow estimates. According to research by Kunzler (2006), the Smith House was built in Therefore, the Smith House experienced three of the four unrecorded floods estimated by Stewart. Only one flood (the November 1995 flood) in the last 99 years, however, has left a water mark above the level of the main floor. The house is reported to have had no more than 2 inches of water above the main floor level during the November 1995 flood (peak discharge 160,000 cfs at Concrete). Also reported, the house had the water just reaching the main floor level during the October 2003 flood (peak discharge 166,000 cfs at Concrete). The main floor level as surveyed on May 18, 2007 by Skagit County for the City of Burlington is at El (NGVD- 29). Thus, the reported high water marks at the Smith House are at approximately El and El for the 1995 and the 2003 floods, respectively. Preliminary work has been undertaken by the City of Burlington (2007) to determine whether or not the Smith House was flooded prior to The work includes two separate inspections of the house that confirm the reported Technical Memorandum Page 2
3 1995 flood water mark on the exterior wall, verified by interior wall inspections at four locations. The conclusion from this preliminary work is that water from the 1995 event just barely covered the floor, and that water from the 2003 event came up into the crawl space just below the level of the sub-floor. There was no evidence of any higher water marks above the observed 1995 flood mark. Three of the four unrecorded floods estimated by Stewart occurred after the Smith House construction, in 1909, 1917, and Stewart s estimated peak flows for these three events are much greater than the 1995 and the 2003 flood peak discharges. If the Smith House was not flooded during these three earlier and much greater events, one possible explanation is that the hydraulic conveyance capacity of the Skagit River in the Hamilton vicinity was historically significantly greater than at present and was able to carry greater flows at lower water levels. This technical memorandum presents the use of the Smith House high water mark information to address this hydraulic conveyance possibility. 3.0 HEC-RAS Models The unsteady flow HEC-RAS model developed for Skagit County by PIE (2005) was used in this hydraulic analysis to estimate the potential 1909, 1917, and 1921 flood stages at the Smith House (RM 40.00) based on Stewart s estimated peak discharge values at Concrete (RM 54.15). This model was further calibrated for the 1995 and 2003 high water marks at the Smith House. Table 2 shows the calibration results. Further refinement of the model included adding two new cross sections (at RM and RM 40.50) recently surveyed by Skagit County and provided in January 2007 by the City of Burlington. Figure 1 shows locations of the Smith House and the model cross sections in the Hamilton vicinity. Table 2. HEC-RAS Calibration for November 1995 and October 2003 Floods Flood W.S. Elevation at Smith House (RM 40.00) Event computed observed difference (feet) (feet) (feet) Nov Oct Technical Memorandum Page 3

4 Figure 1. Location map Technical Memorandum Page 4
5 Also shown in Figure 1, are locations of low flow channels plotted from the 1911 and Corps surveys, and the 1937 and 2001 aerial photographs, overlaying on the USGS quad maps. As shown on the plots, the channel shift in the 2-mile reach downstream of Hamilton, particularly at RM 39.00, is significant between 1911 and The shift after 1975 appears to be minimal. The HEC-RAS model uses the 1975 Corps surveyed channel and cross section data with exception of the RM and 40.50, which were surveyed in 2007 by Skagit County as previously discussed. The 1911 Corps complete survey, including extreme low-water and high water lines overlaying the USGS quad maps, is shown on Figure 2. This 1911 survey is believed to closely represent the river alignment during the 1909, 1917, and 1921 floods. The USGS quad maps closely represent the river alignment encountered during the 1995 and the 2003 floods. Throughout the Hamilton Reach between RM and 41.10, the low flow channel width and depth in 1911 were about the same as those surveyed in The high flow channel width was about 1,200 feet wide at RM in 1911, versus 800 feet in 1975, and remained approximately unchanged at other cross section locations. Detailed topographic data for the channel and banks are available from the 1975 survey but not available from the 1911 survey. Technical Memorandum Page 5


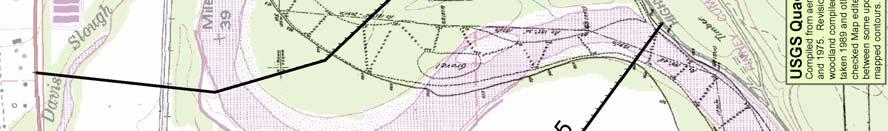


6 Figure Corps Survey on USGS Maps Technical Memorandum Page 6
7 The calibrated HEC-RAS model previously described was revised to approximately represent the river channel geometry in the Hamilton area for the three Stewart estimated floods. The revisions include the following: Delete the Cockreham Levee (approximately one mile long) as it did not exist prior to its construction in the 1950s. Shorten the channel length from 10,245 feet based on the 1975 Corps survey to 8,197 feet based on the 1911 Corps survey between RM and RM Increase the high flow channel width at RM from 800 feet surveyed in 1975 to 1,200 feet based on the 1911 survey map. This would increase the area in the high flow channel by approximately 50 percent. 4.0 Hydraulic Analysis A hydraulic analysis was conducted using the revised HEC-RAS model discussed above for approximating the 1911 channel geometry to determine the potential water surface levels at the Smith House for the Stewart estimated 1909, 1917, and 1921 floods. This HEC-RAS model routes flood hydrographs from Concrete (RM 54.15) to Skagit Bay (RM 0.00). Input data include hydrographs at Concrete and various locations downstream along the river reflecting flow contribution from the upstream watershed and the intermediate sub-drainage areas. The total drainage area above Concrete is 2,737 square miles. The incremental drainage area between Concrete (RM 54.15) and Hamilton (RM 40.00) is about 137 square mile, or 5 percent of the area above Concrete. There are no significant floodplain areas in this 14-mile reach of the river between Concrete and Hamilton that could reduce flood peaks significantly. Flow contribution from this incremental area would not greatly affect the flood peaks and was ignored in this analysis. A sensitivity analysis for use of three various flood hydrograph shapes including PIE modeled 1995, 2003, and synthetic 100-year flood hydrographs for the Stewart estimated 1921 flow was performed. Results of the sensitivity analysis indicate that the maximum difference in flood stages at the Smith House using these three hydrograph shapes is less than 0.1 feet. This difference is insignificant. The 2003 flood hydrograph shape that would produce the least flood volume (and potentially the lowest flood stage even though the difference is less than 0.1 feet, at the Smith House location) among the three hydrograph shapes analyzed was selected to simulate the Stewart estimated 1909, 1917, and 1921 floods. Another sensitivity analysis was performed relating to potential channel geometry and hydraulic conveyance capacity changes downstream of RM Technical Memorandum Page 7
8 37.34 in the Cockreham Island to Lyman area. Earlier maps and aerial photographs indicated significant channel shift in this area. The revised HEC-RAS model was further modified to achieve a flood stage reduction of 3.40, 3.05 and 3.23 feet at RM for the Stewart estimated 1909, 1917, and 1921 flows, respectively. Results of the model runs show that the much lower flood stages below RM had no impact (less than 0.05 feet) on flood stages at the Smith House (RM 40.00). This indicates that the backwater effects due to any potential channel changes and hydraulic conveyance capacity increases in the early 1900s in the Cockreham Island to Lyman area would not reach upstream to the Smith House location. Table 3 presents the maximum water surface elevations at the Smith House (RM 40.00) for three different HEC-RAS model scenarios with various river geometry, using the Stewart estimated peak discharge values for the 1909, 1917, and 1921 floods. These three model scenarios include the calibrated model for the 1995 flood mark observed at the Smith House, the same calibrated model with the Cockreham Island Levee deleted from the model geometry, and the revised model that approximates the 1911 Corps survey and also deletes the Cockreham Island Levee. As shown in the table, the absence of the Cockreham Island Levee would reduce the flood stages at the Smith House by about 0.3 feet for the Stewart estimated three flood peaks. The use of the shorter length and wider bank-to-bank width of the channel between RM and RM in the revised model (based on the 1911 Corps survey map) would reduce the flood stages from the calibrated model (based on the Corps 1975 survey data) by approximately 1.1 feet for these three floods estimated by Stewart. Table 3. Water surface elevations at Smith House (RM 40.00) for Stewart estimated 1909, 1917, and 1921 flood peaks Scenario Calibrated HEC-RAS model for 1995 high water mark at Smith House Calibrated HEC-RAS model with Cockreham Island Levee deleted Revised HEC-RAS model with Corps 1911 survey and Cockreham Island Levee deleted W.S. Elevations at Smith House (feet, NGVD-29) 1909 Flood 260,000 cfs 1917 Flood 220,000 cfs 1921 Flood 240,000 cfs Figure 3 plots the model run results. As shown in the figure, the flood stages (El , , and ) are 3.05, 1.51, and 2.31 feet higher than the observed 1995 flood mark (El ) at the Smith House for the Stewart estimated 1909, 1917, and 1921 flood peaks, respectively. Since no flood marks were higher than the observed 1995 flood mark at the Smith House, it is not possible to have the modeled historic flood stages to be higher than the Technical Memorandum Page 8
9 observed 1995 flood stage. The only possibility is that the peak values estimated by Stewart for these floods are unreasonably high. Based on the 1911 Corps channel survey in the Hamilton area, channel geometry reasonably reflecting the conditions of the river existing during the Stewart estimated flood events was incorporated in the revised HEC-RAS model. The maximum flood peak for the revised model that could possibly occur without exceeding the 1995 flood mark of El at the Smith House would be approximately 188,000 cfs. 106 Calibrated model for 1995 flood mark at Smith House Calibrated model without Cockreham Island Levee 105 Revised model without Cockreham Island Levee and with Corps 1911 surveyed channel and banklines Elevation (feet, NGVD29) Flood 1909 Flood Flood 1995 Flood Flow (cfs) Figure 3. Rating Curves at RM (Smith House) 5.0 Conclusions It is concluded from the hydraulic analysis discussed above that: Stewart estimated peak discharges of 260,000, 220,000, and 240,000 at Concrete for the 1909, 1917, and 1921 floods, respectively, are unreasonably high if the high water marks observed at the Smith House (built in 1908) were not higher than the observed 1995 flood mark at the house. If these Stewart estimated peak discharges were accurate, the flood stages based on the 1911 channel for the 1909, 1917, and 1921 floods at the Smith House would be 3.05, 1.51, and 2.31 feet, Technical Memorandum Page 9
10 6.0 References respectively, higher than the observed 1995 flood mark at El Based on the 1911 Corps survey river channel and banklines, the maximum peak flow for the 1909, 1917, and 1921 floods would be about 188,000 cfs without causing any flood mark higher than the observed 1995 flood mark at the Smith House. The 1918 Stewart estimated peak flows of 185,000 and 175,000 cfs for the 1909 and 1917 floods compare reasonably well with the modeled maximum flow of 188,000 cfs for these events. Burlington, City of, Preliminary Investigation into Historic Flood Marks in the Smith House, Hamilton, Washington. Undated report. Kunzler, L.J., James E. Stewart Skagit River Flood Reports and Assorted Documents. A Citizen Critical Review Whitepaper. Available at 11 July Pacific International Engineering, PLLC, Hydrology and Hydraulics. Skagit River Flood Basin Existing Conditions. Report prepared for Skagit County. Stewart, J.E., Stage and Volume of Past Floods in Skagit Valley and Advisable Protective Measures Prior to the Construction of Permanent Flood Controlling Works. Unpublished report. U.S. Geological Survey (USGS), Water Supply Paper Floods in the Skagit River Basin, Washington by James E. Stewart and G. Lawrence Bodhaine. Technical Memorandum Page 10