Technical Memorandum Groundwater Quality Sampling, First 2010 Semiannual Event
|
|
|
- Ernest Briggs
- 5 years ago
- Views:
Transcription
1 Kennedy/Jenks Consultants Technical Memorandum Groundwater Quality Sampling, First 2010 Semiannual Event Date: 30 July 2010 To: From: Subject: Amy Blain City of Longview Steve Misner Kennedy/Jenks Consultants City of Longview Groundwater Quality Sampling Results, First 2010 Semiannual Monitoring Event K/J *00 This memorandum summarizes the results of the first 2010 semiannual groundwater monitoring and sampling event conducted in May 2010 in the Mint Farm Industrial Park well field area (Mint Farm). The groundwater monitoring and sampling is conducted on a semiannual basis to establish background water quality in the well field area prior to initiation of full scale water production from the Mint Farm well field. Groundwater samples are collected from deep sentinel wells DW-1, DW-2, DW-5, DW-6, DW-7, and DW-9 during each pre-operating semiannual sampling event. Groundwater monitoring will likely continue during full scale water production. However, the frequency for post-operation monitoring has not yet been established. ACTIVITIES CONDUCTED DURING THE FIRST 2010 SEMIANNUAL MONITORING EVENT Activities completed during this groundwater monitoring event were conducted in general accordance with Technical Memorandum 2, Water Quality Sampling Protocol (Kennedy/Jenks, 28 April 2009). Activities conducted during the first 2010 semiannual sampling event included: Collecting groundwater samples from deep sentinel wells DW-1, DW-2, DW-5, DW-6, DW-7, and DW-9 on 19 and 20 May The groundwater samples were collected following purging and stabilization of ph, temperature, conductivity, and dissolved oxygen. A groundwater sample was also collected on 23 April 2010 from production well PW-1 during the water treatment pilot study. Submitting the groundwater samples for analysis of total metals using Environmental Protection Agency (EPA) Method E200.7 and E200.8, semi volatile organic compounds (SVOCs) using EPA Method 525.2, and volatile organic compounds (VOCs) using EPA Method Downloading water level data from the pressure transducers in all 17 sentinel wells, production well PW-1 and the Prudential Boulevard well. Processing the downloaded transducer data, developing shallow and deep groundwater elevation contour maps for April 2010 and generating hydrographs for the wells for Summer 2009 through Spring Preparing this summary technical memorandum.
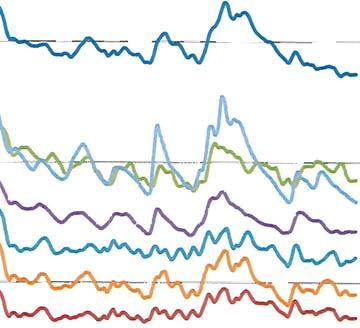
2 Technical Memorandum Groundwater Quality Sampling, First 2010 Semiannual Event 30 July 2010 Page 2 of 3 Kennedy/Jenks Consultants RESULTS OF GROUNDWATER MONITORING Groundwater Elevation Contour Maps and Hydrographs Figures 1 and 2 are shallow aquifer and deep aquifer groundwater elevation contour maps representing the month of April The methodology for deriving the groundwater elevations is described in detail in Preliminary Design Report (PDR Part 2) for the City of Longview (City) Mint Farm Regional Water Treatment Plant and Well Field, Part 2A: Hydrogeologic Characterization of the Mint Farm Area (Kennedy/Jenks, March 2010). As indicated on Figures 1 and 2, the groundwater system in the Mint Farm area is complex and strongly influenced by the relative stages of the Consolidated Diking Improvement District (CDID) drainage canals and the Columbia River. An evaluation of the groundwater elevation contours derived from measurements obtained in April 2010 shows that groundwater flow in the shallow system primarily flows radially toward the CDID drainage canals around the Mint Farm area. An evaluation of the deep aquifer groundwater elevation contours for the April period indicates that the gradient in the vicinity of the well field is relatively low, with a predominant flow direction toward the northeast. However, in the west-southwest portion of the Mint Farm area, a slight southwesterly component of flow is also observed. The groundwater hydrographs for all of the shallow sentinel wells are presented on Figure 3 and the hydrographs for all of the deep sentinel wells are presented on Figure 4. Groundwater Sampling Results The groundwater analytical results of detected constituents are summarized in Table 1. Potentially applicable screening standards are presented in Table 1 for comparison purposes. Copies of the laboratory analytical reports are included in Attachment A. No VOCs or SVOCs were detected in any of the samples collected during the first 2010 semiannual sampling event. None of the concentrations of the detected total metals exceeded the screening values. DATA QUALITY A duplicate groundwater sample was collected from sentinel well DW-5 (QCFD ) for analysis of VOCs. No VOCs were detected in either the primary or duplicate sample. The two trip blank samples submitted for analysis did not contain VOCs. Based on a review of the laboratory reports, it is our opinion that the analytical data are of acceptable quality for their intended use. A laboratory case narrative prepared by CAS is included as part of the lab report in Attachment A. FUTURE SAMPLING ACTIVITIES Groundwater monitoring will continue on a semiannual basis to establish background water quality in the well field area prior to initiation of full scale water production from the Mint Farm well field. The next groundwater monitoring event will be conducted in October Pressure transducer data will be downloaded on a quarterly basis.
3 Technical Memorandum Groundwater Quality Sampling, First 2010 Semiannual Event 30 July 2010 Page 3 of 3 Kennedy/Jenks Consultants REFERENCES Kennedy/Jenks Consultants, Technical Memorandum 2, Water Quality Sampling Protocol. Kennedy/Jenks Consultants, 28 April Kennedy/Jenks Consultants, Preliminary Design Report (PDR Part 2) for the City of Longview (City) Mint Farm Regional Water Treatment Plant and Well Field, Part 2A: Hydrogeologic Characterization of the Mint Farm Area. Kennedy/Jenks Consultants, March 2010.
4 Table
5 Table 1: Detected Constituents in Groundwater Detected Constituents in Groundwater in Micrograms per Liter Well Identification Sample Date Aluminum Antimony Arsenic Barium Beryllium Cadmium Calcium Chromium, Total Copper Iron Lead Magnesium Manganese Nickel Potassium Selenium Silicon Silver Sodium Thallium Uranium Zinc DW-1 06/09/ U (a) B (b) B 20, U 0.06 B 2, U 4, , U 23, B 8, U 0.02 U 1.8 B DW-1 11/11/ J (c) 0.05 U J 0.02 U 21, J 2, U 4, , U 24, U 8, J 0.02 U 2.0 U DW-1 05/19/ U U 0.02 U 20, U 0.2 2, U 5, , U 25, U 8, U 0.02 U 2.0 U DW-2 06/12/ , , , U 17, B 14, B B 1.3 B DW-2 05/19/ U U 0.02 U 30, U , , U 19, U 15, U 0.02 U 2.0 U DW-5 06/11/ U B B 26, B 0.04 B U 8, , U 20, U 12, U B 2.0 U DW-5 05/20/ U U 0.02 U 31, U 0.1 U U 10, , U 23, U 12, U 0.02 U 2.0 U DW-5 05/20/ U U 0.02 U 31, U 0.1 U U 9, , U 22, U 12, U 0.02 U 2.0 U DW-6 06/10/ B B B 24, B 0.05 B , , U 21, U 10, U B DW-6 05/20/ U U U 28, U U , , U 23, U 10, U U DW-7 06/10/ U U B 20, B 0.05 B 1, U 4, , U 23, B 8, U 0.02 U 1.7 B DW-7 11/12/ J 0.05 U J 0.02 U 21, J 0.05 J 1, U 4, , U 24, J 8, J 0.02 U 2.0 U DW-7 05/20/ U 0.05 U U 0.02 U 20, U 0.1 U 1, U 5, , U 25, U 8, U 0.02 U 2.0 U DW-9 08/13/ U,N (d) B B 26, , , , U 24, B 10, U B 3.6 DW-9 11/12/ U J 0.02 U 22, J 0.07 J U 5, , U 25, U 8, U 0.02 U 2.0 U DW-9 05/19/ U U , U 0.1 U , , U 25, U 9, U 0.02 U 2.0 U PW-1 04/23/ U 0.05 U U 0.02 U 22, U 0.1 U 2, U 5, , U 24, U 8, U 0.02 U 2.0 U Screening Level 37,000 (e) 6 (f) 10 (f) 2,000 (f) 4 (f) 5 (f) NE (g) 100 (f) 1,300 (f) 26,000 (e) 15 (f) NE 2,200 (h) 100 (f) NE 50 (f) NE 50 (i) NE 2 (f) 30 (f) 4,800 (h) Chemical Abstract Service Number SI U Notes: (a) U = The analyte was analyzed for, but was not detected ("Non-detect") at or above the Method Reporting Limit/Method Detection Limit. (b) B = The analyte was found in the associated method blank at a level that is significant relative to the sample result as defined by the DOD and NELAC standards. (c) J = The result is an estimated value that was detected outside the quantitation range. (d) N = The matrix spike sample recovery is not within control limits. Recoveries in the laboratory control sample were acceptable, which indicates the analytical batch was in control. (e) U.S. Environmental Protection Agency (EPA) Risk Screening Level (RSL) (f) EPA Maximum Contaminant Level (MCL) (g) NE = Not Established (h) Department of Ecology Model Toxics Control Act (MTCA) Method B (i) Washington Administrative Code (WAC) Table 1 Groundwater Quality Criteria U
6 Figures
7 SW-2 (2.61 ft) SW-5 (3.60 ft) SW-6 (3.06 ft) SW-7 (5.08 ft) SW-1 (7.10 ft) PW-1 SW-9 (9.21 ft) SW-4 (4.11 ft) SW-3 (4.94 ft) Kennedy/Jenks Consultants Mint Farm RWTP Design Longview, Washington Shallow Aquifer Groundwater Map April 2010 Mean Groundwater Elevations KJ *00 Figure 1 Columbia River Aerial Source: (c)2009 Microsoft Corporation Note: Contours shown on this map represent the mean water level elevations from 4/01/10 to 4/30/ ,200 Scale: Feet Contour Interval: 1.0 Foot Legend Monitoring Well (Groundwater Elevation) Groundwater Contours (Dashed Where Approximate) Path:Z:\Projects\Longview\Events\ _April_GW_Elev\ _GW_Elev_Shallow.mxd


8 7.0 DW-2 (6.75 ft) DW-5 (6.81 ft) DW-4 (3.96 ft N/A) Prudential (7.14 ft) DW-8 (6.52 ft) DW-6 (6.64 ft) PW-1 (7.51 ft N/A) DW-9 (6.89 ft) DW-7 (6.67 ft) DW-1 (6.81 ft) DW-3 (5.81 ft) ,200 Note: Contours shown on this map represent the mean water level elevations from 4/01/10 to 4/30/10. Scale: Feet N/A = Not Applicable Contour Interval: 0.1 Foot Kennedy/Jenks Consultants Mint Farm RWTP Design Longview, Washington Deep Aquifer Groundwater Map April 2010 Mean Groundwater Elevation KJ *00 Figure Columbia River Aerial Source: (c)2009 Microsoft Corporation Legend Monitoring Well (Groundwater Elevation) Groundwater Contours Inferred Groundwater Flow Direction Path: Z:\Projects\Longview\Events\ _April_GW_Elev\ _GW_Elev_Deep.mxd


9


10
11 Attachment A Laboratory Analytical Reports
12
13
14
15
16
17
18
19
20
21
22
23
24
25
26
27
28
29
30
31
32
33
34
35
36
37
38
39
40
41
42
43
44
45
46
47
48
49
50
51
52
53
54
55
56
57
58
59
60
61
62
63
64
65
66
67
68
69
70
71
72
73
74
75
76
77
78
79
80
81
82
83
84
85
86
87
88
89
90
91
92
93
94
95
96
97
98
99
100
101
102
103
104
105
106
107
108
109
110