Lower Rio Grande Water Users Organization Water Symposium June, 2007 Jorge A. Garcia, Ph.D., P.E. Utilities Director
|
|
|
- Clemence Shaw
- 5 years ago
- Views:
Transcription


1 Water Planning, Infrastructure Development and Conservation Lower Rio Grande Water Users Organization Water Symposium June, 2007 Jorge A. Garcia, Ph.D., P.E. Utilities Director


2 The census listed 12,325 residents in By 1960 we numbered 29,367 and 1965 saw our population hit in the neighborhood of 42,500. That is soaring growth The nation s attention was focused on Las Cruces because of the dynamic pattern being established. Leading financial experts predict this area will be among the fastest growing localities in the nation for the next 30 years was the year Las Cruces began to realize this potential 2
3 The water planning process Regional Water Plan 1994 Regional Plan New plan completed in August, 2004 Las Cruces 40- year Water Plan Water & Wastewater Master Plan 1995 Plan Update draft completed in January, 2006 Final draft in progress 1995 Master Plan Update currently under Development. To be Completed Fall of
4 Las Cruces 40-yr Water Plan Conjunctive use of surface and groundwater Water conservation Reclaimed water use Aquifer storage and recovery Importation Potential desalination options 4

5 Water supply.. 1. Jornada Bolson Jornada Bolson 3. Surface water 2. Mesilla Bolson West Mesa, valley Mesilla Bolson Current water rights: 21,869 AF Mesilla Bolson 10,200 AF Jornada Bolson 5
6 Conservation Water in 0.5 af Outdoor use 0.25 af Reclaimed water Wastewater out 0.25 af Irrigation of Parks, golf courses medians Water Reclamation Plant River Return flow WWTP 1 acre-foot (AF) = 325,851 gallons 1 MGD = 1,120 AFY 6
7 Water Plan Population Projections 300, , ,000 Population 200, , ,000 50, High Medium Low 7
8 Water Plan Customer Projections 120, , ,000 Customers 80,000 60,000 40,000 20, High Medium Low 8
9 Water Plan Demand Projections 60,000 53,891 50,000 Acre-feet 40,000 30,000 20,000 10, High Medium Low 9

10 Projected demand and water rights West Mesa 8,000 ac-ft Other 4,250 ac-ft Surface water supply Surface water supply 10
11 Water Plan Demand & Available Supply Sample Management Scenario 1 60,000 50,000 40,000 Acre-feet 30,000 20,000 10, LRG 430 East Mesa LRG 389&399 West Mesa S Water High 11
12 Water Plan Demand & Available Supply Sample Management Scenario 2 60,000 50,000 Acre-feet 40,000 30,000 20,000 10, LRG 430 East Mesa LRG 389&399 West Mesa S Water 5.00% Reclaimed High 12
13 Water Plan Demand & Available Supply Sample Management Scenario 3 60,000 50,000 Acre-feet 40,000 30,000 20,000 10, LRG 430+ East Mesa LRG 389&399 West Mesa S Water 10.00% Reclaimed High 13

14 Water Use by Sector in LRG 90.11% 6.81% 1.27% 0.76% 0.53% 0.49% Irrigated Agriculture Public Water Systems Commercial Livestock Domestic wells Power Industrial/Mining 0.03% 14
15 Perecent Use by Sector % 90.00% 80.00% 70.00% 60.00% 50.00% 40.00% 30.00% 20.00% 10.00% 0.00% 90.11% Change in Water Use by Sector Allocation of 500,000 AF 6.81% 86.51% 84.70% 82.90% 10.41% 12.22% 14.02% 0 20,000 30,000 40,000 Municipal Demand Agricultural use Municipal use 15
16 Ag to M&I Conversion 300, , , , ,000 50, % 2% 3% 4% 5% 6% 7% 8% 9% 10% Conversion percentage Acre-feet Households Population 16


17 2006 Surface Water Treatment Facility Study 17

18 2006 Surface Water Treatment Facility Study 20 mgd initial capacity 11,312 afy 18
19 2006 Surface Water Treatment Facility Study 19
20 Water Rights Ordinance. First enacted in 1985.Ord #623 Acreage based Payment due at time of annexation Modified in Ord #1670 Acreage based Increased payment amount Modified in 2000.Ord #1843 Conveyance or payment-in-lieu due at time of development Payment based on meter size, rather than acreage Added conveyance of Project water rights 20
21 Water Rights Ordinance 1843 Conveyance of Water Rights or Project Water Rights is a Prerequisite for Development of Land. Each landowner or developer shall convey surface or ground water rights or project water rights to the City at the time of development. Payment in Lieu of Conveyance for Non-Water Righted Land. The landowner or developer of non-water righted land may, in lieu of conveying water rights or project water rights to the City, pay to the City a sum of money which will enable the City to acquire water rights or project water rights. The amount of the payment in lieu of conveyance shall be based on the size of the City water meter or meters to be placed on the land. 21
22 Reclaimed water use City currently in the design phase of the East Mesa Water Reclamation Facility Will initially treat 0.5 million gallons per day (MGD) and later expanded to 1.0 MGD Tertiary treated water will be used for irrigation of landscapes, golf course, medians, etc Reclaimed water use offsets fresh water demands 22


23 2002 Aquifer Storage and Recovery Study 23
")
24 Aquifer storage and recovery (ASR) 24

25 Water & Wastewater Master Plan Provides guidance for infrastructure development Delineates specific water and wastewater projects to meet growth needs Defines the capital improvement plan as required by Development Fee Act 25


26 1988 Water & Wastewater Master Plan 26
27 1988 Water Master Plan 27


28 1989 Wastewater Master Plan 28
29 1989 Wastewater Master Plan 29


30 1995 Resources Management Plan 30


31 1995 Water & Wastewater Master Plan 31
32 1995 Water & Wastewater Master Plan 32
33 1995 Water & Wastewater Master Plan 33
34 Water Infrastructure Development Adrienne Widmer, P.E. Projects & Water Right Manager
35 East Mesa Well Field $1,030,500 $644,063 $136,026 35
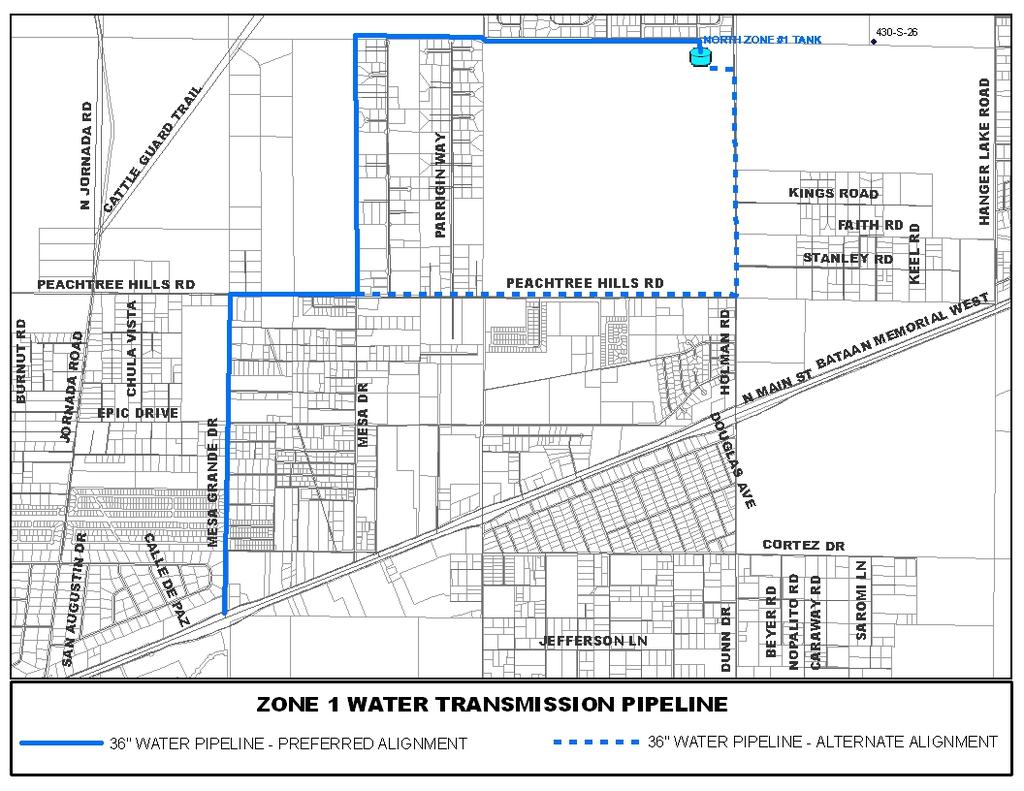
36 Zone 1 Water Supply Project- Phase I $1,673,865 36


37 Well 69 pump station construction 37

38 38

39 Tank connection 39


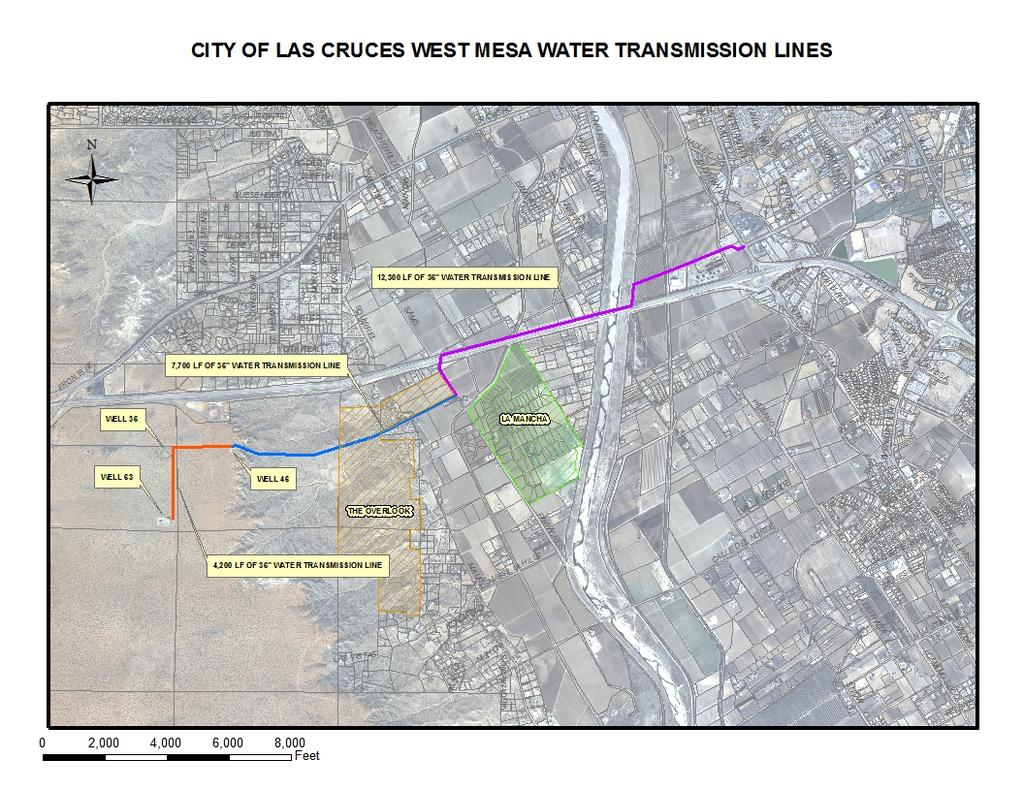
40 $1,932,188 Zone I Water Supply Phase II $3,781,322 40


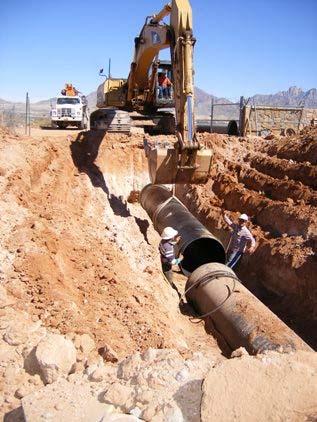
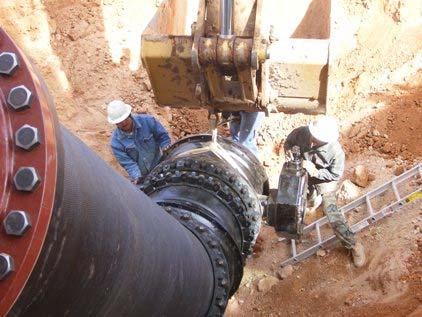
41 36-inch pipeline construction 41

42 $1,236,188 42

43 $6,337,088 43
44 $1,953,176 44
45 $ 12,414,424 EQ Basins 8.9 to 13.5 MGD Entrance Works 45


46 Wastewater Plant Expansion On-going entrance works construction $ 2,825,424 46


47 New entrance works Demolition of old entrance works 47


48 New belt press Sludge compost operation 48

49 Water Reclamation Plant 49
50 Water reclamation plant Biological Nutrient Removal (BNR) System - Aeromod Wastewater Influent Effluent - Reclaimed Water Primary Treatment Auger/Screens And Eutek Head Cell Tertiary Treatment Cloth Disk Filter Disinfection Ultra Violet (UV) To JAHWWTF $9.65M Demonstrates odor control treatment method 50

51 51
52 Water Conservation Joshua G. Rosenblatt Water Conservation Coordinator
53 Benefits of Water Conservation Increasing efficient use is the least expensive way to enhance water supplies Extend water and wastewater infrastructure lifespan and operating costs Conservation program maintains compliance with OSE & NMDFA Las Cruces is Proactive 53
54 2004 Winter VS Summer City Customer Water Consumption Gallons 400,000, ,000, ,000, ,000, ,000, ,000, ,000,000 50,000,000 0 Feb-04 Jun-04 Feb 2004 VS June 2004 Residential Multi Res Commercial CLC Parks Golf Course 54


55 PHASE 1 WATER CONSERVATION - MAIN COMPONENTS PUBLIC INFORMATION WEB PAGES MEDIA RELEASES MAILINGS INFORMATION STATIONS EDUCATION PUBLIC WORKSHOPS PRESENTATIONS SCHOOL DISTRICT K-12 NMSU ORDINANCE CONSERVATION ORDINANCE LANDSCAPE ORDINANCE CITY LEAD FACILITIES SPECIAL PROJECTS REGIONAL COLLABORATION MONITORING AND REPORTS DEMAND ANALYSIS TRENDING COST BENEFIT ANALYSIS 55


56 Creating a Water Wise Oasis LUSH & LEAN Initiative Two (2)Bureau of Reclamation Grants awarded in recognition of the City s Lush & Lean Initiative. 56
57 GATHERING HISTORY FOR MESURING PERFOMANCE Total Annual Single Family Water Demand City of Las Cruces Accounts 2002 to Gallons (000) Number of SFR Accounts , ,124 3,971 Increase 57
58 Summer Conservation ACTUAL Impact Gallons (000) Gallons (000) % Diff Total SFR 2,938,778 2,895, June 355, , July 428, , August 313, , Month Total 1,097,137 1,047, Per Cent of Total 37.3% 36.2% -1.1 Scenario 5% 54,857 49, Annual Reduction 1.9% 1.7% Actual 58
59 The Measure of Success - Production and Demand Analysis Single Family Residential Gallons per Capita per Day(GPCPD) Trend GPCPD Year 59

60 GIS Developments 60

61 Smart Data Points 61

62 Swimming Pools VS Lawns 62
63 It s the Year 2010 PHASE I ACCOMPLISHMENTS 5 YEAR Public Outreach K-12 Outreach City Lead By Example Enhanced Enforcement Demand Monitoring and Trending Methods Established 1% per year reduction The results of Phase I and measured community response will provide the framework for all subsequent conservation measures to achieve both short and long range goals 63
64 Beyond Phase 1 Proposed Future Initiatives Conservation Surcharge (Ex. >2x Avg) on utility bill Revised Landscape ordinance to include residential properties, lawn permits Heightened enforcement by Codes with assistance from utility staff and public reporting. Fines placed on utility bills. 64


65 Report Water Wasting

66 The Conservation Program is off to a great start We have exceeded the first years goal Strong public and administrative support Many simple cost effective steps are underway that will measurably contribute to demand reduction year after year. 66
67 End of Presentation Thank you
68 Historical Water Diversions 30,000 25,000 20,000 15,000 10,000 5, Water Customers Mesilla (ac-ft) Jornada (ac-ft) 68
69 Well TDS Data TDS (mg/l) Well Number TDS (mg/l) TDS limit Standard Average(2) 69
70 Well TDS Data TDS (mg/l) Well Number TDS (mg/l) TDS limit Average(2) WW(2) 70
71 Well Hardness Data Hardness (mg/l) Well Number Hardness Hardness Lim 71