Objectives of the Study
|
|
|
- Piers Armstrong
- 5 years ago
- Views:
Transcription
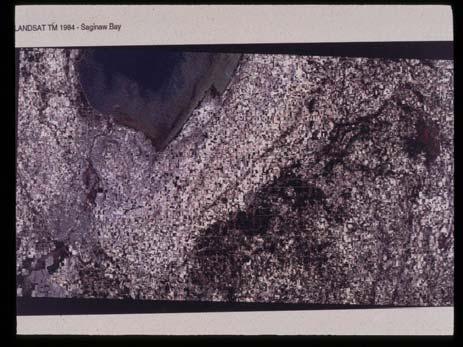
1 Integration of AGNPS, GIS, and Remote Sensing for Estimating Nonpoint Source Pollution in the Saginaw Bay, Michigan Chansheng He Department of Geograophy Western Michigan University Kalamazoo, MI Yung-Tsung Kang Institute of Water Research Michigan State University East Lansing, MI Environmental Impacts of Land Use 1. Energy Source Primary production; Secondary production 2. Water Quality ph, Temperature, Dissolved solids, Nutrients (N and P), Organic and inorganic chemicals, Heavy metals 3. Habitat Quality Water depth and current velocity; Spawning, nursery, and hiding places; Diversity (pools, riffles, and debris) 4. Flow Regime Water volume, Temporal and spatial distribution 5. Biotic Interactions Competition; Predation; Disease; and Parasitism Objectives of the Study This study integrates AGNPS (Agricultural Nonpoint Source Pollution Model), LANDSAT, and GIS to: (1) estimate the yields of sediment and nutrient loading into the receiving water, (2) evaluate the impact of land use change on water quality, (3) identify the critical erosion areas, and (4) develop management scenarios to minimize surface runoff and sediments at the watershed level. Agricultural Nonpoint Source Pollution Model (AGNPS) (Young et al. 1987) AGNPS is a single storm-event based simulation model for evaluating sediment and nutrient transport from agricultural watersheds (Young et al. 1987; USDA Agricultural Research Service 1995). The model includes three basic components: hydrology, erosion and sediment, and nutrients (N, P, and Chemical Oxygen Demand). Hydrology The hydrologic component calculates overland runoff (in inches) and peak flow rate (in cfs) based on the SCS curve number equation. Where storm rainfall represents total rainfall from a storm in inches, and retention factor is calculated by Eq. 2: Where the curve number is the SCS Curve Number. 2 (Storm Rainfall 0.2* Retention Factor ) Volume Runoff = (Storm Rainfall +0.8* Retention Factor ) (1) Peak Flow Rate The peak flow rate (in cfs) leaving the impoundment is calculated from Eq. 3: Peak Flow Leaving Impoundment = Pond depth0 * Coefficient of Pipe Diameter/3600 (3) Where diameter is 3 inches. AGNPS will default to this diameter, if it is smaller. Retention Factor = 00 Curve Number 1
 plus a factor for runoff from snowmelt or applied water; K=the inherent erodibility of a particular soil; L=the slope-length factor; S=the slope-steepness factor; C=the cover and management")
2 Estimating Water Erosion Y=R*K*L*S*C*P*Slope Shape (1) Y=the computed average soil loss per unit area, expressed in ton/acre; R=the rainfall and runoff factor, which is the rainfall erosion index (EI) plus a factor for runoff from snowmelt or applied water; K=the inherent erodibility of a particular soil; L=the slope-length factor; S=the slope-steepness factor; C=the cover and management factor; P=the support practice factor; and The slope shape factor represents the effect of slope shape on soil erosion(wischmeier and Smith 1978;Young et al. 1989). (1) cell number (2) cell division Model Input Variables (3) receiving cell number (4) receiving cell division (5) flow direction (6) SCS curve number (7) land slope (8) slope shape (9) field slope length () overland Manning's roughness coefficient (11) soil erodibility (K) factor (12) cropping management (C) factor (13) support practice (P) factor (14) surface condition constant (adjustments for the time it takes channelization of overland runoff) (15) chemical oxygen demand (16) soil texture (17) fertilizer indicator (18) pesticide indicator (19) point source indicator (20) additional erosion indicator (21) impoundment indicator (number of ponds in the impoundment terrace system) and (22) channel indicator (indication of the number of channels in the cell) (USDA ARS 1995). Model Output Output of AGNPS includes estimates of surface runoff volume (inches), peak flow rate (in cfs), sediment yield (tons), mass of sediment attached and soluble N in runoff (lbs/acre), mass of sediment attached and soluble P in runoff (lbs/acre), and soluble chemical oxygen demand (lbs/acre). These results can be viewed in either tabular or map format for examination of critical runoff, sediment, and nutrient loading areas. ArcView DLBRM Interface AVDLBRM is developed to operationalize data processing, extraction, analysis, and visualization. The interface consists of six modules: Soil Processor DLBRM Utility Parameter Generator Output visualizer Statistical Analyzer Land use Simulator. Databases Meteorology DEM Soil Land cover Hydrology Hydrography Meteorological Processor Flow Processor Soil Processor DLBRM Utility Parameter Generator DLBRM Statistical Analyzer Map Animator Output Visualizer Land Use Simulator Figure 2. The structure of ArcView Distributed Large Basin Runoff Model (AVDLBRM) interface 2


3 Flow network of Kalamazoo River Watershed 3


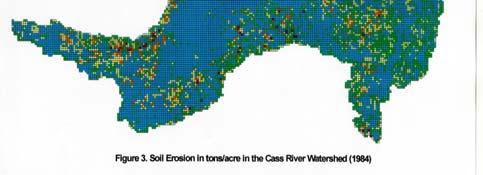
4 4


5 5
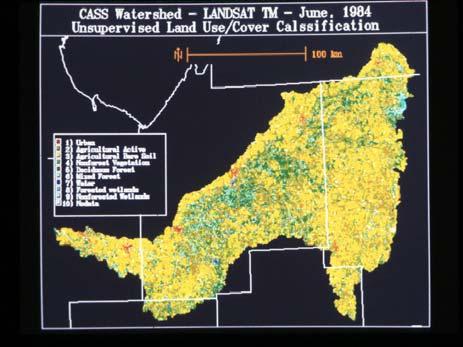
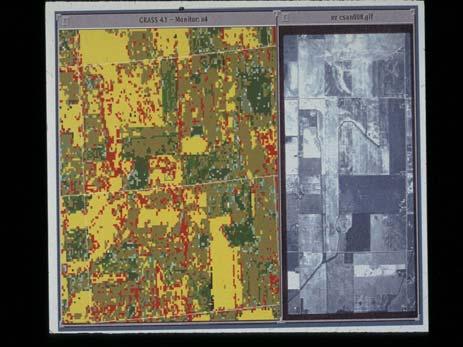
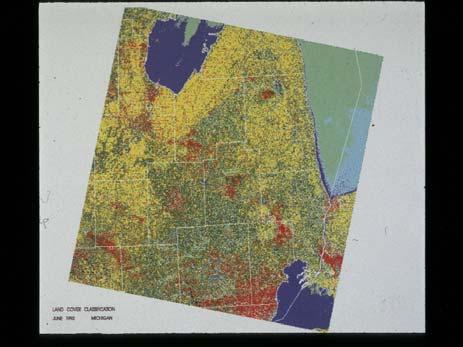
6 Table 6. ESTIMATED LAND USE CHANGE BETWEEN 1979 AND MIRIS LAND USE/COVER CLASSIFICATION Category Urban Agriculture Nonforested Vegetation Forested Land Wetlands Openland Water Total (581,063 acres) % JUNE 1, 1992 LANDSAT TM LAND USE/COVER CLASSIFICATION Category Urban Agriculture ( of which 14% with crop residue) Nonforested Vegetation Forested Land Wetlands Beach (Sands) Water Active Bare Soil Total (581,063 acres) % Table 7. Comparison of Simulated Results between 1979 and 1992 Land Use Classifications Cass Watershed Simulation Summary (Values at the watershed outlet) 25-year 24 hour precipitation (inches) Storm energy-intensity value Runoff volume (inches) Peak runoff rate (cfs) Total N in sediment (lbs at the outlet) Total soluble N in runoff (lbs at the outlet) Total P in sediment (lbs at the outlet) Total soluble P in runoff (lbs at the outlet) Total soluble COD (lbs at the outlet) Total sediment at the outlet (tons) 1979 MIRIS Land Use/Cover , ,021 38, LANDSAT TM Land Use , , ,780 18,162 Table 8. AGNPS Scenarios: Parameter Values for Cropland Scenario Manning's C Factor P Factor Surface Condition I. Fallow, Poor Practices, and No II. Fallow, Good Practices, and No III. Fallow, Poor Practices, and Disk IV. Fallow, Good Practices, and Disk V. Fallow, Poor Practices, Moldboard Plow VI. Fallow, Good Practices, Moldboard Plow VII. With Corn Crop, Poor Practices, No VIII. With Corn Crop, Good Practices, No.0. IX. With Corn Crop, Poor Practices, Disk X. With Corn Crop, Good Practices, Disk.0.15 Fertilizer Availability Estimating Wind Erosion The STATSGO was used to extract six wind erodibility indices for all the soil associations in the Cass River watershed. Group 1: 3 ton/acre/year; Group 2: 134 ton/acre/year; Group 3: 86 ton/acre/year; Group 4: 86 ton/acre/year; Group 5: 56 ton/acre/year; Group 6: 48 ton/acre/year (USDA Soil Conservation Service, 1993). XI. With Corn Crop, Poor Practices, Moldboard.0.05 XII. With Corn Crop, Good Practices, Moldboard.0 6


7 The LANDSAT 5 Thematic Mapper data of June 1, 1992 was used to derive the Normalized Differential Vegetation Indices (NDVI). These indices give a relative quantification of vegetation amount, with vegetated areas yielding high values, and nonvegetated areas yielding low or zero values. The formula for calculating the NDVI is: Table 1. Classification of Wind Erosion Potential based on the Soil Erodibility and NDVI Values. Wind Erosion Potential No Wind Erosion Subtle Wind Erosion NDVI > Classification Criteria Wind Erodibility Group Indices (tons/acre/year) Any Group Indices (1-6) TM Band 4 TM Band 3 NDVI = TM Band 4+ TM Band 3 Little Wind Erosion Medium Wind Erosion or or >300 or <140 >140 or <140 High Wind Erosion or <0. >140 or <0 Severe Wind Erosion <0. >0 Table 2: Distribution of Wind Erosion Potential in the Cass River Watershed Wind Erosion Potential Acres Percent No Wind Erosion Subtle Wind Erosion Little Wind Erosion Medium Wind Erosion Severe Wind Erosion Total 581,

 Nitrogen (N)(tons) Phosphate (P 2 O 5 )(tons) 9,632,000 25,700 21,180 Table 4.")
,164 4,932 11,713")
 426,888 207,144 491,946 912,618")
8 Table 3. Estimated Total Amounts of Animal Waste, Nitrogen, and Phosphate from Animal Waste in the Cass River Watershed based on the 1987 Census of Agriculture Data Animal Waste (tons) Nitrogen (N)(tons) Phosphate (P 2 O 5 )(tons) 9,632,000 25,700 21,180 Table 4. Estimated Agricultural Chemical Loading Potential in the Cass River Watershed County Huron Genesee Lapeer Saginaw Sanilac Tuscola Total Cropland (Acres),164 4,932 11,713 21, , , ,041 Nitrogen Amount (lbs) 579, , , ,076 6,669,586 6,182,505 15,220,000 Phosphate Amount (lbs) 426, , , ,618 5,716,788 5,770,338 13,526,000 Pesticides Amount (lbs) 8,284 3,290 7,567 15,428 83,030 88, ,000 8
9 SUMMARY AND CONCLUSIONS 1. Agricultural cropland is recognized as a major source of NPS pollution. The study demonstrate the integration of GIS, LANDSAT imagery and AGNPS model to: (1) determine approximate nutrient and sediment inputs into the Saginaw River and Bay during an intense storm, (2) evaluate the impact of land use change on water quality, (3) identify the critical erosion areas, and (4) simulate the effects of different management practices for minimizing surface runoff and sediments at the watershed level. 2. The results suggest that the Cass River watershed introduces large amounts of nutrients and sediment into the Saginaw River and Bay. Runoff volume and sedimentation had decreased during the period of due to increased conservation practices and greater nonforested vegetated acreage in the Cass River watershed. The incorporation of improved management practices, such as contour farming, and conservation and reduced tillage were shown to reduce certain types of agricultural runoff. Scenarios representing the institution of conservation tillage resulted in decreased soil loss, but increased nutrient runoff. On the other hand, improved management practices reduced both soil and nutrient runoff in all of the scenarios considered. 4. GIS, remote sensing, and agricultural watershed models are important analysis tools in planning water quality programs. By integrating GIS, remote sensing, and watershed models such as AGNPS, management agencies can identify critical erosion areas within a watershed and promote the most appropriate agricultural management practices in the targeted areas to control soil erosion and nutrient runoff. Consequently, resources could be used more effectively in managing agricultural NPS pollution. 5. Satellite imagery is an important source of data for deriving land use/cover related parameters to simulation models at the watershed scale. It, however, must be integrated with other large scale base maps in order to produce land use/cover map with better classification accuracy and to feed parameters with improved spatial resolution and classification confidence to the simulation models. 6. Field validation of model input parameters is a very important part of the effort when using GIS, remote sensing, and models in management activities. This study demonstrates the integration of GIS, LANDSAT imagery, and a water quality model for agricultural NPS pollution management. However, the 1992 land use/cover classification and crop residue cover derived from the LANDSAT TM scene, and the simulated results of AGNPS have not been verified in the field due to project constraints. If the results are to be used in decision making, field validation must be conducted. 7. Higher resolution GIS data may improve the accuracy of simulation in a targeted watershed; however, trade-offs exist between the size of the watershed and the resolution of the data due to hardware, software, and time limitations. Resource planners should realize these trade-offs when using models for comprehensive watershed planning and management. Agricultural statistics at the finer scale would reveal more useful information than would be the county level data in estimating the NPS loadings. Work is underway to develop a distributed water quality model for estimating pollutant transport in the entire Saginaw Bay basin. CURRENT DEVELOPMENT Add soil erosion and sedimentation and nutrient to the DLBRM; Include combined storm and sewage flow to the model; Incorporate fertilizer and animal manure application into the model; Integrate bacteria and virus and infectious diseases to the model; Utilize NEXRAD data for spatial coverage of precipitation; Explore effect of spatial variability of landscape on modeling hydrologic processes. ACKNOWLEDGMENT Partial support for Chansheng He from the National Research Council Research Associateship Program and Western Michigan University Department of Geography Lucia Harrison Endowment Fund is acknowledged while he was on his sabbatical leave at GLERL. 9