Alternative Energy: Solar, Wind, Geothermal
|
|
|
- Bertram McCormick
- 5 years ago
- Views:
Transcription

1 Alternative Energy: Solar, Wind, Geothermal Milken/Sandia Energy Workshop for Financial and Capital Market Leaders October 23, 2007 Dan E. Arvizu Director, National Renewable Energy Laboratory


2 Energy Solutions Are Enormously Challenging Energy Security Economic Secure supply Productivity Reliability Growth in demand Price volatility Vulnerability or Opportunity Environmental Impact Land and water use Carbon emissions Must address all three imperatives


3 Source: Arvizu, NREL How Big is the Challenge?


4 U.S. Energy Consumption and the Role of Renewable Energy Source: Energy Information Administration, Annual Energy Outlook 2006, Table D4


5 Thinking Differently: Account for Externalities Today s energy marketplace does not appropriately value certain public objectives or social goods, instead we have: Price volatility Serious environmental impacts Underinvestment in energy innovation

6 Mounting Evidence


7 Declining Energy R&D Investments U.S. R&D Spending in the Energy Sector Billions 2002$ Source: Daniel Kammen, Gregory Nemet Reversing the Incredible, Shrinking Energy R&D Budget Table 10.3, Edition 25, Transportation Energy Data Book


8 Declining Energy R&D Investments Reflect World Oil Price Movement U.S. R&D Spending in the Energy Sector Billions 2002$ Dollars per Barrel 2002$ Source: Daniel Kammen, Gregory Nemet Reversing the Incredible, Shrinking Energy R&D Budget Table 10.3, Edition 25, Transportation Energy Data Book


9 We Are Now Setting Aspirational Goals Setting the Bar Higher U.S. national goals Biofuels: reduce gasoline usage by 20% in ten years Wind: 20% of total provided energy by 2030 Solar: Be market competitive by 2015 for PV and 2020 for CSP

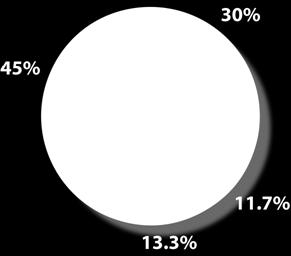
10 30% U.S. Renewable Energy Contributions Percent of Total Electric Generating Capacity 25% 20% Fossil fuel price assumptions for the forecast year range from: Oil: $21 - $100 per bbl Coal: $20 - $25 per ton Natural Gas: $4 $8.03 per mcf EPG 10% Renewables, Maintain Coal and Nuc EPG 10% Renewables, Maintain Coal and Nuc, High Corns EPG 10% RE Mod Gas Growth, High Cons PEW AOG w/policy PEW TTT w/policy PEW TTW w/policy 15% IEA WEO Alt Policy PEW TT IEA WEO Ref 10% High: Progressive policy change & rapid technological advancement EPG Current Trend EPG Inc Coal & Nuclear PEW TW 5% 0% AEO Base Medium: moderate policy & technological change Low: minimal policy, slow technological change, greater reliance on fossil fuels EIA AEO High Econ Growth EIA AEO Low En Price EIA AEO Ref EIA AEO Low Econ Growth EIA AEO En Price PEW AOG


11 Getting to Significance Involves Technologies Reducing Risk Mobilizing Capital Policies Markets Source: NREL


12 Global Markets are Growing Rapidly Global Growth of Wind Energy Capacity Global PV Shipments


13 Money Is Flowing Into the Sector 2006 Investment and M&A By Sector and Asset Class Annual VC Investment Volume Compared With Source: New Energy Finance 2007


14 Investment and M&A By Region and Asset Class 2006 Figures in brackets represent total number of deals figure is annualized. Source: New Energy Finance 2007


15 Total Estimated VC Investment by Region Figures in brackets represent deals (with disclosed value/total number of deals) figure is annualized. Source: New Energy Finance, January 2007


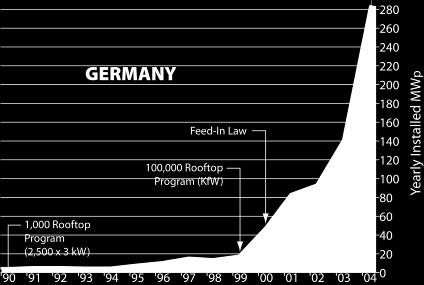
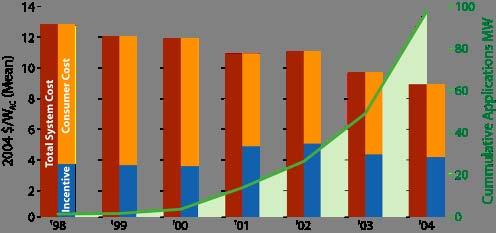
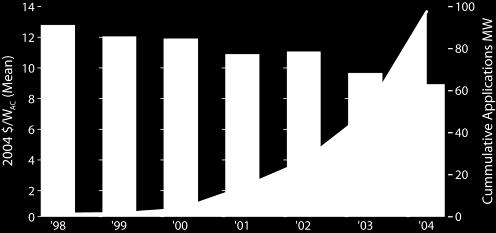
16 Worldwide Markets Have Driven Cost Reductions Solar PV Example CALIFORNIA


17 Source: DSIRE database, July 2007 State Policy Framework Renewable Electricity Standards


18 Energy Efficiency and Renewable Energy Technology Development Programs NREL R&D Portfolio Efficient Energy Use Vehicle Technologies Building Technologies Industrial Technologies Renewable Resources Wind Solar Biomass Geothermal Energy Delivery and Storage Electricity Transmission and Distribution Alternative Fuels Hydrogen Delivery and Storage Foundational Science and Strategic Analysis


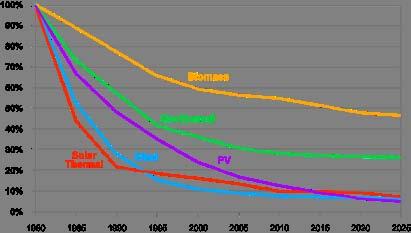
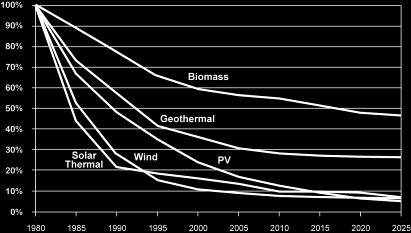
19 Past Investments Have Yielded Impressive Cost Reductions
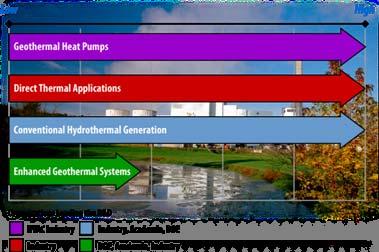
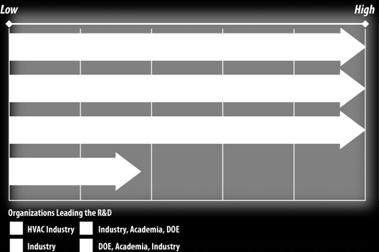
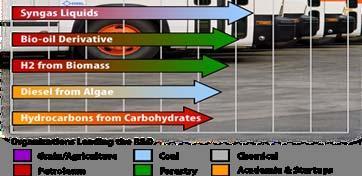

20 Technology Maturity Pathways Biofuels Wind Geothermal Solar


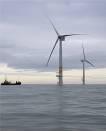
21 Today s Status in U.S. 11,603 MW installed at end of 2006 Cost 6-9 /kwh at good wind sites* Wind DOE Cost Goals 3.6 /kwh, onshore at low wind sites by /kwh, offshore in shallow water by 2014 Long Term Potential 20% of the nation s electricity supply NREL Research Thrusts Improved performance and reliability Distributed wind technology Advanced rotor development Utility grid integration * With no Production Tax Credit Updated 1/07, validated 7/07 Source: U.S. Department of Energy, American Wind Energy Association

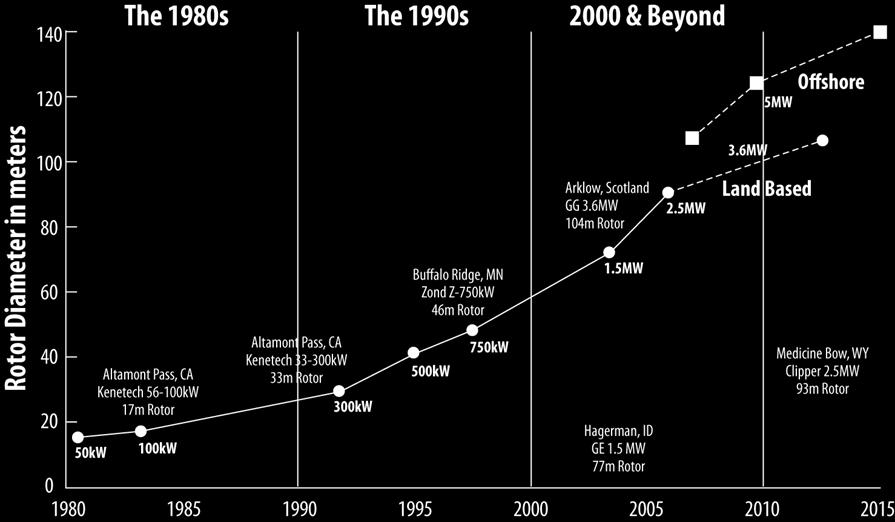
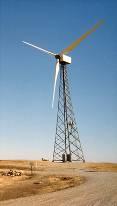
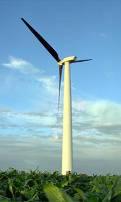
22 Evolution of U.S. Commercial Wind Energy

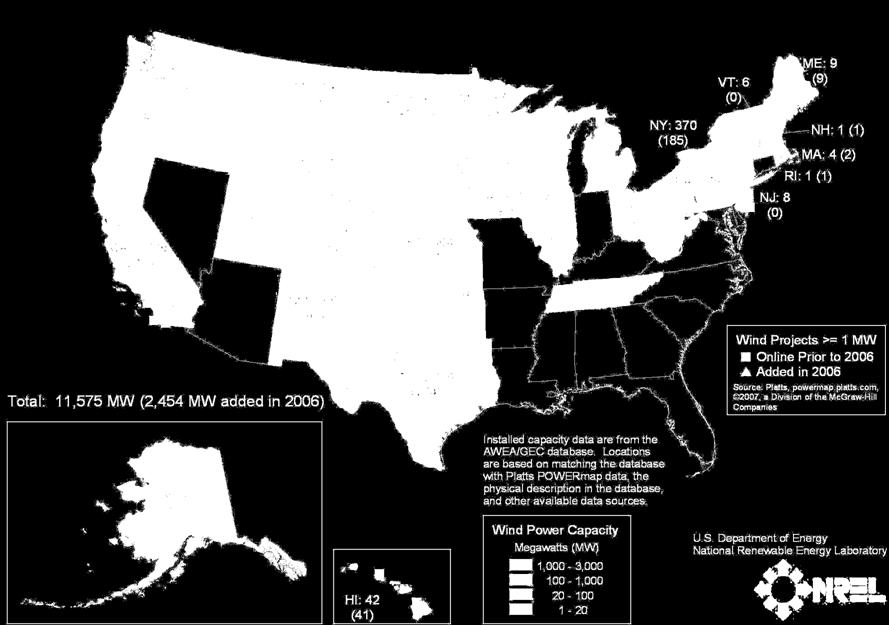
23 Installed Wind Capacity


24 Wind Power Prices Are Up in 2006 Cumulative Capacity-Weighted Average Wind Power Price Over Time


25 Project Cost Increases Are a Function of Turbine Prices Reported U.S. Wind-Turbine Transaction Prices Over Time

26 Integrating Wind Into Power Systems New studies find integrating wind into power systems is manageable, but not costless Key Results from Major Wind Integration Studies Completed
27 Some Additional Reserves May Need to be Committed Reserve Category Base 15% Wind 20% Wind 25% Wind MW % MW % MW % MW % Regulating % % % % Spinning % % % % Non-Spin % % % % Load Following % % % % Operating Reserve Margin Total Operating Reserves % % % % % % % % Source MN DOC Estimated Operating Reserve Requirement for MN BAs 2020 Load


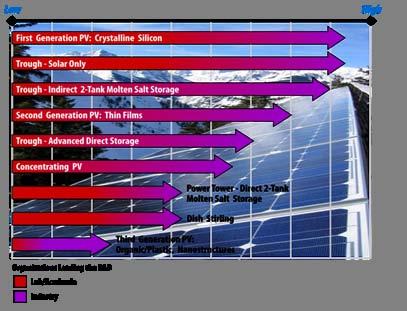
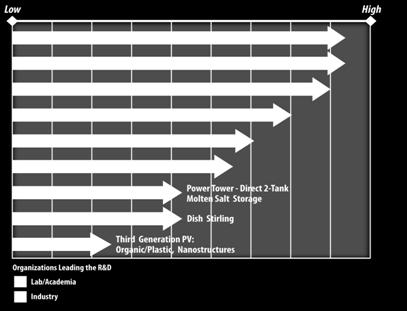
28 Solar Photovoltaics and Concentrating Solar Power Status in U.S. PV 565 MW Cost /kwh CSP 420 MW Cost 12 /kwh Potential: PV /kwh by /kwh by 2015 CSP 8.5 /kwh by /kwh by 2020 Source: U.S. Department of Energy, IEA, Solar Energy Technologies Program Multi-Year Plan 2007 Updated July 2007 NREL Research Thrusts: PV Partnering with industry Higher efficiency devices New nanomaterials applications Advanced manufacturing techniques CSP Next generation solar collectors High performance storage


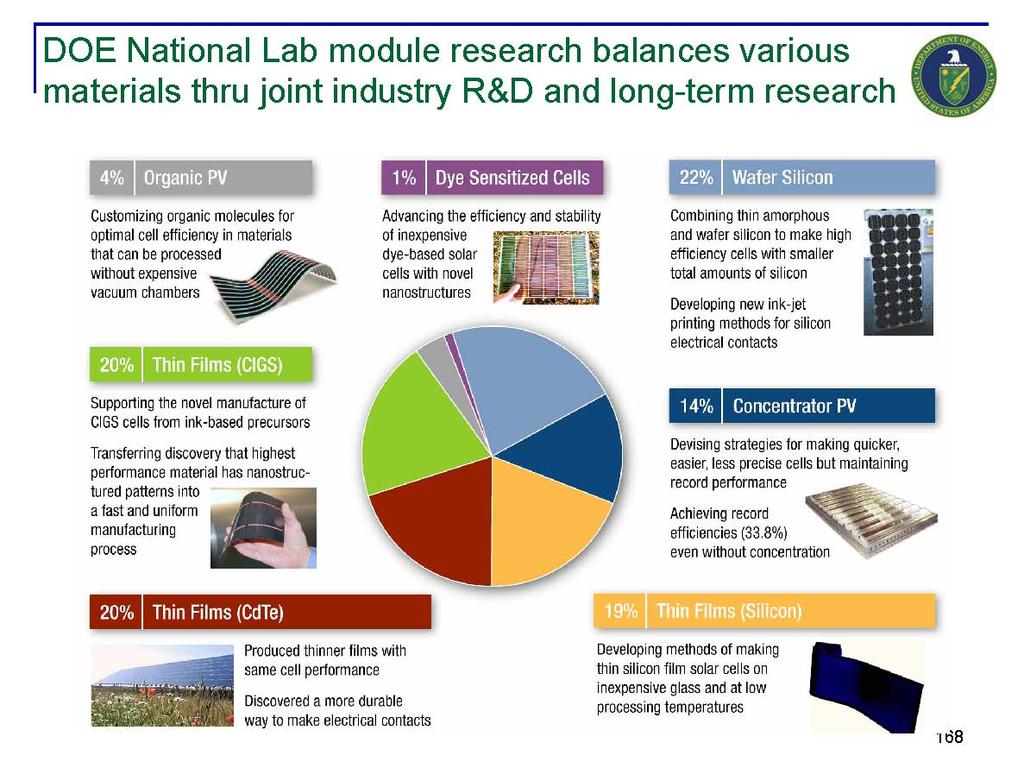
29 Focus on Module R&D... Module Inverter Mounting, Electrical Installation, Engineering


 Curve")
1")


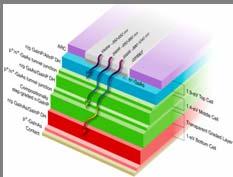
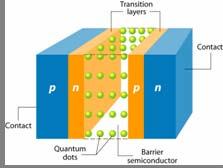
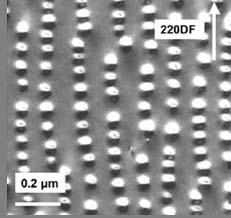
30 R&D Ensures technology ownership, enables growth, new markets DOE is the STEWARD PV Module Production Experience (or Learning ) Curve PV Module Price (2004$/Wp)1 Disruptive II 3rd Gen and beyond Quantum dots Nanotechnology Multi-multi-junctions Thermophotonics, voltaics Intermediate band... 60% Efficiencies beyond the Shockley-Queisser Limit (40% 50% beyond?) 70% 80% 80% SEIA 2020 EPIA % EPIA 2030
31
32


33 Ridge Vineyards PV Rooftop 65 kw, CA WorldWater & Power, Irrigation System 267 kw, Seley Ranches, CA Powerlight, Bavarian community MW, single-axis tracking Mühlhausen, Germany RWE Schott Stillwell Avenue Subway Station, PV Canopy Roof, 250,000 kwh/yr, Brooklyn, NY Moving Toward Our Destination Shell Solar at Semitropic Water Storage Dist. 980 kw, single-axis tracking, Wasco, CA WorldWater & Power and Alternity Power Atlantic County Wastewater Treatment Plant, 8 MW solar-wind hybrid, NJ Sun Power & Geothermal Energy Co. Solar-Wastewater Plant, 622 kw, Oroville,CA PowerLight PowerGuard Rooftop System, 536 kw, Toyota Motor Corp., Torrance, CA Shell Solar, Sunspot Bürstadt, rooftop system, Grid tied, 5MW, Bürstadt, Germany


34 Today s Status: 2,800 MWe installed, 500 MWe new contracts, 3000 MWe under development Cost 5-8 /kwh with no PTC Capacity factor typically > 90%, base load power DOE Cost Goals: <5 /kwh, for typical hydrothermal sites 5 /kwh, for enhanced geothermal systems with mature technology Geothermal Long Term Potential: Recent MIT Analysis shows potential for 100,000 MW installed Enhanced Geothermal Power systems by 2050, cost-competitive with coalpowered generation NREL Research Thrusts: Analysis to define the technology path to commercialization of Enhanced Geothermal Systems Low temperature conversion cycles Better performing, lower cost components Innovative materials Source: DOE, NREL, 9/07


35 Enhanced Geothermal Systems (EGS) for Electricity Generation Source: DOE, August 2007


36 Enhanced Geothermal Systems Have Significant Potential Source: DOE, August 2007


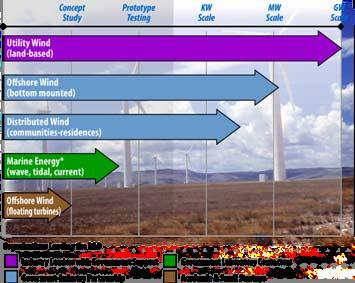
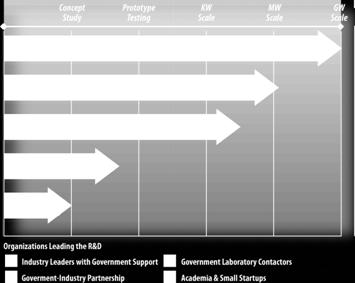
37 Source: NREL Technology Investment Pathways


38 Technology Innovation Challenges Remain The Next Generation Wind Turbines Improve energy capture by 30% Decrease costs by 25% Biofuels New feedstocks Integrated biorefineries Solar Systems Improved performance through, new materials, lower cost manufacturing processes, concentration Nanostructures Zero Energy Buildings Building systems integration Computerized building energy optimization tools


39 Promise of renewable energy is profound and can be realized if we Aggressively seek a global sustainable energy economy Accelerate investment in technology innovation Acknowledge and mitigate the carbon challenge with the necessary policies It is a matter of national will and leadership

40 The U.S. Department of Energy s National Renewable Energy Laboratory Golden, Colorado