Materials advances for ppb gas detection
|
|
|
- Dana McDonald
- 5 years ago
- Views:
Transcription


1 Materials advances for ppb gas detection John Saffell Technical Director Alphasense Ltd. Great Notley, Essex UK EuNetAir Crete October 2012

2
3 Who are we? Alphasense Limited A private UK limited company Started: January 1997 First product: O2-A1 Oxygen sensor September 1997 Markets: Industrial Safety and Air Quality gas sensors


4 Electrochemical

5 Not only industrial safety, but now also air quality sensors


6 New factory: finished solar panels installed 2012
7 USA and EU regulations are demanding more knowledge of urban air quality; this requires mapping in space and time Species Conc (µg m -3 ) Conc (ppb) Period Standard Date Hourly mean Dec 2005 NO Annual mean Dec 2005 CO 10 (mg m -3 ) 8.7 (ppm) Max daily running 8 hr mean (running 8 hr mean in Scotland) Dec 2003 O hr running or hourly mean (not to be exceeded 10 times a year ) Dec 2005
8 VOC and inorganic gas sensor advances and challenges What technologies are leading the race? Photo Ionisation Detector (PID) Field Asymmetric Ion Mobility Spectroscopy (FAIMS) Tunable Diode Laser Absorption Spectroscopy (TDLS) Detector Tubes Thermal desorption & GC/MS (laboratory analysis) Electrochemical cells Metal Oxide semiconductors
9 Photoionisation detector (PID) lower cost than IMS 1 ppb resolution for VOCs
10 Metal oxides respond to ppb but amperometric gas sensors do better H2S MMO 06/01/ ppb 400ppb 200 ppb ppb 200 ppb 120 ppb 40 ppb 80 ppb 1500 VSens A4 (mv) VSens A5 (mv) VSens A6 (mv) Output (mv) Data points
11 4- electrode amperometric electrochemical gas sensor T Gas diffusion barrier Working Electrode Wetting filters Reference Electrode Counter Electrode Auxiliary Electrode Electrolyte Reservoir


12 Catalysts have always been nanomaterials Pt/Ru Catalysts are complex alloys, in many cases.
13 20 ppb and better can now be achieved 400 H2S-B4 NO, NO 2, H 2 S, SO SO2-B Output (mv) Output (mv) WE1 WE WE1 WE time (s) time (s) 210 NO2-B4 340 NO-B Output (mv) Output (mv) WE1 WE2 180 WE1 WE time (s) time (s)
14 NO 2 up to 200 ppb NO2-B ppb ppb Output (mv) ppb 120 ppb ppb ppb 10 ppb 20 ppb 40 ppb 0 ppb t (s)
15 Indication of electrochemical sensor CO sensitivity (laboratory) 160 ppb 130 ppb 80 ppb 0 ppb 9.6 ppb 38.4 ppb 0 ppb 2.6 ppb 7.8 ppb 15.6 ppb 31.2 ppb Improvements in: Hardware, control electronics and analysis Viable tools for urban air quality monitoring. Need to carefully consider data processing
16 SO2-B4 What has advanced? Catalyst control, Electronics, 4-electrode designs Zero current changes with temperature, but the scale of the current is very different (x10) Output (na ) (reference to 20 C ) T (C) NO-B4 Working and Auxiliary Electrode O3-B4 Output (na) (reference to 20 C) Output (na) (reference to 20 C) T (C) -100 T (C)
17 CO-B4 Working and Auxiliary Electrode H2S-B4 Working and Auxiliary Electrode O u tp u t (n A ) (re fe re n c e to 2 0 C ) O u tp u t (n A ) (refere n c e to 20 C ) T (C) NO2-B4-300 T (C) O3-B Output (na) (reference to 20 C) O u tp u t (n A ) (re fe re n c e to 2 0 C ) T (C) -100 T (C) -100
18 Electrochemical sensor CO/NO/NO 2 sensitivity performance (laboratory) Noise characteristics: Typical sensor sensitivities/lod are < 5ppb (< 7µg/m 3 ) for CO, 1-2 ppb (~2-4 µg/m 3 ) for NO and NO 2. SO 2, O 3 have comparable performance to NO x. Typical sensor T 90 ~ 10-20s (determined by diffusion) Very low power consumption (µw)


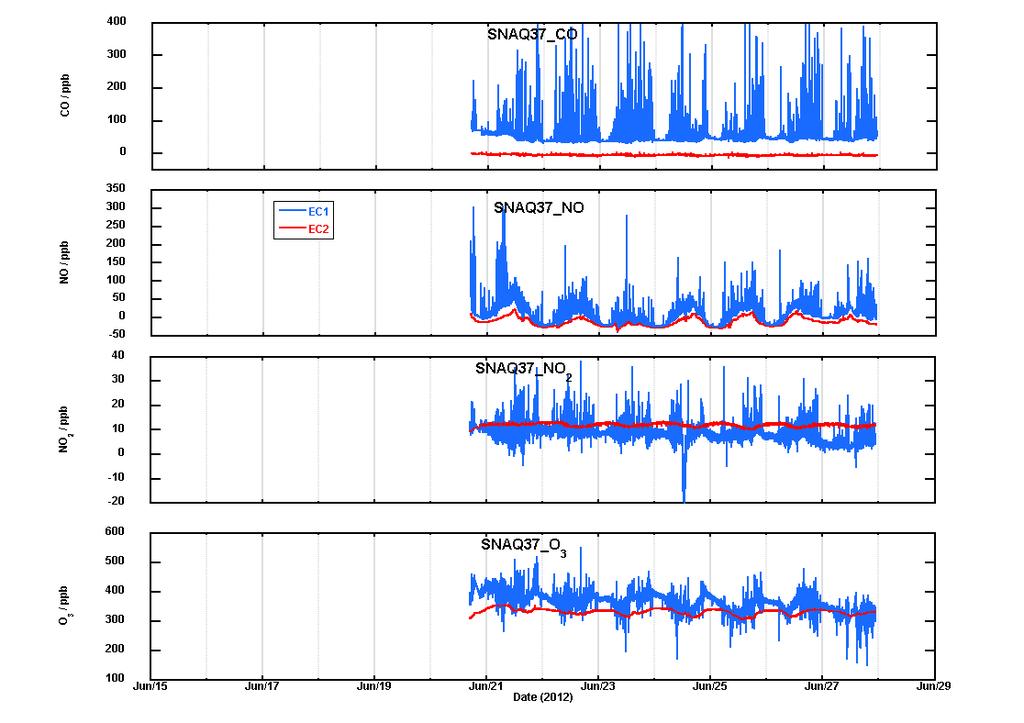
19 Real world comparison of NO 2 and NO with ratified AURN site * * * Corrected for O 3 interference Performance replicated in the field.
20 Wireless air quality networks seem to be simple- Sensor array Electronic platform: sensor interface A/D and power wireless comms Data analysis and interpretation
21 Wireless networks in the UK MESSAGE: NERC funded project (2008) Cambridge 50-boxes (25 million data points (2010) Low cost modules- Envirowatch (2011) Heathrow airport -50 boxes (2012) Urban air quality boxes (Universities-2012)
 Combine technologies to provide sensitive low cost sensor network mobile sensor network archive GPS (location) Real time data")
22 Other data (met, traffic.) Combine technologies to provide sensitive low cost sensor network mobile sensor network archive GPS (location) Real time data processing/ data assimilation GPRS (data transmission) PRODUCTS Environment.. Regulation Exposure.. Transport.. SENSORS
23 Co-located sensors (NO 2 ) real structure (Uncorrected for O 3 )
24 Pollution events Changes in air quality driven by both traffic and meteorology Multiple species measurement Sensor reproducibility [Stewart, Jobalja, Mead]
")
9")


25 PIC. 5 CB( SC) 15 BA 30 BG(S C)9 LA 3 R T1 AR4 7 GE 27 S P2 25


26 Each box is battery powered for 3 months, with sensors, electronics and dual purpose aerial
27 High-density mapping
28 Cambridge deployment September 2009: NOx 2012 Annual Review Meeting on Air Pollution, 3-4 May.

29 Visual determination of pollution hotspots not possible with static sites
30 Examine homogeneity in pollution (NO 2 ) Urban roadside vs rural (expected), but also urban roadside and nearby pedestrianised difference

31 Chemometrics Data Analysis: the mathematical approach for separating multiple measurements
32 Regional air quality (snapshots): Cambridge, Valencia, Lagos 20 ppm Dramatic differences. Flexible low cost way of characterising A/Q


33 Street canyon effects: wind direction and re-circulation Sensor Unit High concentrations when wind direction aligned to road Sensor Unit
34 Hourly average vs fast response near co-located instruments Structure present on all measured scales


35 UK Heathrow air quality network - 50 wiresless AQMs


36 Some initial data S11 S12 NERC Network S14 of Sensors QI3 metting, Reading 3-4 July S16
37 High density sensor network system for air quality studies at Heathrow airport Participants: Institution Input University of Cambridge (PI) a/q models Imperial College London traffic models, visualisation University of Hertfordshire aerosol measurements University of Manchester aerosol measurements CERC Ltd a/q modelling ADMS National Physical Lab. metrology, calibration Alphasense Ltd sensors and electronics
38 As Heathrow shuts down, air quality improves
 1 month Grid (46")

39 Static deployments (carbon monoxide) 1 month Grid (46 sites) 1 week 1 day vs 4 hours (individual pollution events)
40 Conclusions Wireless, better batteries, GPS/Google maps are ready for wireless networks- sensors are the key ppb is achievable and low cost for inorganic gases ppb for VOCs without selectivity is achievable ppt for VOCs is the difficult target Metal oxides and electrochemical cells are affordable Data analysis will become as important as the sensors
41 Acknowledgements Wah On Ho, Ronan Baron Alphasense Ltd. Michael Hitchman Innovative Coatings Ltd. Hugh Doyle Tyndall Research and CommonSense consortium Rod Jones, Iq Mead Cambridge University Chemistry Joe Stetter KWJ Engineering Inc. John Polak Imperial College Jeff Neasham Envirowatch Ltd. and Newcastle University Julian Gardner, James Covington Warwick University Engineering Bill Milne, Florin Udrea Cambridge University Engineering & CCS Roger Riley Geotech Instruments Ltd. Richard Compton Oxford Chemistry


42 Thank you for your attention. Any questions?