THE FINANCIAL FLOWS IN THE RECYCLING OF PACKAGING WASTE. Rui Cunha Marques Pedro Simões Nuno Cruz Sandra Ferreira Marta Cabral
|
|
|
- Verity Baker
- 5 years ago
- Views:
Transcription
1 THE FINANCIAL FLOWS IN THE RECYCLING OF PACKAGING WASTE Rui Cunha Marques Pedro Simões Nuno Cruz Sandra Ferreira Marta Cabral
 How have the distribution of costs been managed among the multiple stakeholders?")
2 EIMPack: Economic Impact of the Packaging and Packaging Waste Directive Objectives Ex-post evaluation of Directive 94/62/EC (challenging recovery and recycling rates) How have the distribution of costs been managed among the multiple stakeholders? What is the Economic Rate of Return of the enhanced environmental protection? 2

3 Case studies 3
4 Introduction There are undeniable advantages in recycling some types of packaging waste; Nevertheless, recycling does not have only advantages and benefits; According to the PPW Directive those involved in the production, use, import and distribution of packaging and packaged products must accept the responsibility for packaging waste; We compare the costs incurred by the waste management operators with the financial support coming from the industry; Is the shared responsibility principle is being interpreted correctly? 4
5 Objective Total cost of mixed waste management Total cost of urban waste management (collection & treatment) (collection & treatment) Total cost of packaging waste management (collection & treatment) Sale of recyclables Financial support from the industry Public subsidies? Local taxes? 5
6 FINANCIAL TRANSFERS

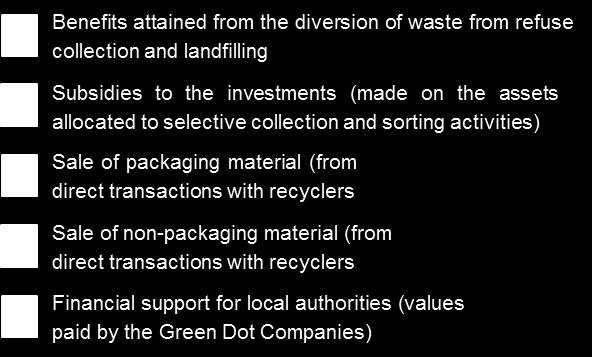
7 Portugal (2010) - Green dot fee Financial Supports 7
8 France (2010) - Green dot fee Fees by packaging material Based on Units + Based on Weight ( /kg) Glass 0,0045 Plastic 0,2222 Paper and cardboard 0,1526 Steel 0,0282 Aluminium 0,0566 Others 0,1526 Financial Supports Level Performance (P) in Kg/inh./year Financial Support (S) in /t 1 P Nb S = Sb (Nb Sb) + (P Nb) Si 2 Nb < P Nh S = P 3 Nh < P Np S = Nb Sb + Nh Nb Si + P Nh Sp P (P Np + Nb) Sb + Nh Nb Si + Np Nh Sp 4 P > Np S = P Where: S p plafond support; S i intermediary support; S b bottom support; N b lower level; N h high level; N p plafond Level. Cover 60 % of the net benchmark costs N b N h N p S b S i S p Steel ,5 80 Aluminium 0,1 0, Paper/Cardboard Plastic 1,6 3, Glass EMR
9 Germany (2010) - Green dot fee Economic operators pay a fee for using the trademark Material /ton Material /ton Glass 1,00 Paper / cardboard 3,00 Plastic 17,00 Composites 13,00 Tinplate 5,00 Aluminium 13,00 Glass 74 Paper / cardboard 175 Tinplate 272 Aluminium, other metals 733 Plastic Composites cartons (LPB) with special acceptance and recycling guarantee 752 Other composites Natural materials 102 a fee for the participation in a dual system 9
10 Romania (2010) - Green dot fee Packaging Material 2010 Glass 16,29 PET 21,47 Plastics 11,68 Paper / cardboard 13,27 Steel 10,27 Aluminium 10,27 Wood 10,53 Eco-Bonus for WMCs Packaging Material 2010 Glass 23,89 PET 32,40 Plastics 15,39 Paper / cardboard 13,67 Steel 13,88 Aluminium 13,89 Wood 10,60 10
11 DATA & METHODOLOGY

12 Cost-Benefit Analysis Economic analysis Environmental analysis Costs Benefits Life-cycle analysis Monetary valuation 12


13 Economic analysis 13
14 Economic analysis Variables Costs of refuse collection Costs of waste treatment and disposal Efficiency of sorting Net assets Cost of equity Equity on capital structure Cost of debt Corporate tax 14
15 THE EXTRA COST OF RECYCLING

16 Portugal 16

17 Cost per activity Portugal Cost per flow 17
18 Portugal Financial analysis 18
 Rural (< 250 inh/km 2 )")
19 Portugal Urban (> 250 inh/km 2 ) Rural (< 250 inh/km 2 ) 19
20 France 20
21 Cost per activity France Cost per flow Eco-Emballages identified for selective the collection service, a cost of 72 per tonne collected for glass, 167 per tonne collected for paper and cardboard and, finally, 788 per tonne collected for plastic and metals 21

22 France Financial analysis 22
 Rural (< 250 inh/km 2 ) 23")
23 France Urban (> 250 inh/km 2 ) Rural (< 250 inh/km 2 ) 23
24 Germany 1996 ( /ton) 2007 ( /ton) Collection 360 1) Sorting 150 Treatment and Recycling Subtotal DSD s fees ) Costs of disposal of plastic packaging by DSD Unknown system costs, overhead ) Value based on the LWP collection (including plastics). 2) Average value for LWP collection (including plastics): in 2007, in Bavaria, for example, about 56% of the population was served with a kerbside collection and the remainder by a bring system. For kerbside collection the costs are approximately 300 /t for the bring system around 200 /t. 3) According to DSD, the fees for plastic packaging were around /t in The average charge is certainly far less than this amount, because some licensees might have been granted with quantity or other discounts (such as discount for service packs). Collection and transportation costs Scenarios Status Quo NRB HW + LWP Residual household waste ( /ton) Bag in container Minimal value Maximum value Average Dry recyclables kerbside collection system ( /ton) Minimal value included in costs of Maximum value household Average waste Drop-off centres ( /inh.year) Cost 4,8 4,8 included in costs of household waste 24
25 Germany Urban local authorities Rural local authorities 25

26 Romania 26


27 Cost per activity Romania Cost per flow 27

28 Romania 28
29 CONCLUDING REMARKS
30 Strictly financial cost coverage Vs. an economic approach The weight of the industry on recycling cost recovery widely diverges among the Case Studies; In, Germany the recycling service is entirely supported by the industry, but how much does it costs? Difficult Generally, the recycling services are balanced in an economic perspective; Unexpectedly, rural operators reveal lower unit costs. 30
31 FURTHER STEPS

32 Further steps Economic analysis Environmental analysis Costs Benefits Life-cycle analysis Monetary valuation Thorough comparative analysis of costs and benefits 32
33 Thank you! 33