The National and International Impacts of Coal-to-Gas Switching in the Chinese Power Sector
|
|
|
- Oswald Nathaniel Burke
- 5 years ago
- Views:
Transcription


1 The National and International Impacts of Coal-to-Gas Switching in the Chinese Power Sector Yiyong Cai CSIRO Oceans & Atmosphere Flagship FEEM, Venice, June 2015 INTEGRATED GLOBAL MODELLING AND ANALYSIS
2 Outline of the talk 1. Policy Background 2. Methodology 3. Scenarios 4. Results 5. Implications 2 Presentation title Presenter name


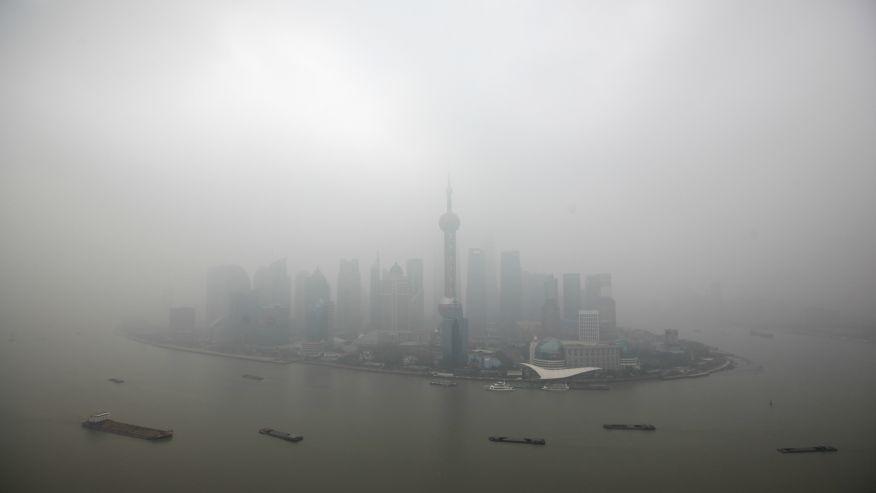
3 China sees more and more hazy days 3 Presentation title Presenter name
4 How many hazy days? Source: 4 Presentation title Presenter name

5 How is it measured? Source: 5 Presentation title Presenter name


6 The Chinese people are getting concerned A report by Peking Univ. and Greenpeace (2015) warns that a quarter million of Chinese people could die of pre-mature death in the next decade, if smog is left uncontrolled. Source: 6 Presentation title Presenter name

7 The concerns are escalating Documentary by former CCTV host and reporter Jing Chai was released on 28 Feb 2015, the day after the appointment of China s new environment minister. It attracted 200+ million hits in the first week, before it disappeared 7 Presentation title Presenter name
8 The Chinese government is getting serious about it The Action Plan for Air Pollution Prevention and Control was announced on 10 September The Plan mandates reduction in PM2.5 in three regions: Beijing-Tianjin-Hebei 25%, the Yangtze River Delta 2, and the Pearl River Delta 15%. It bans the construction of new coal-fired power plants in these regions (roughly 3 of national total). Source: 8 Presentation title Presenter name
9 The role of coal power in Chinese air pollution kt / year % 38% 0 7% SO2 NOX PM10 PM2.5 Power Plants Industrial Combustion Industrial Process Domestic Sources Transportation Others geothermal nuclear 2% waste Biofuels 1% Gas 2% Oil Power Generation solar PV hydro 17% solar thermal wind 2% tide Coal 76% Source: Wang et al., Atmospheric Environment, 2011, 45: Source: US EIA. 9 Presentation title Presenter name
10 What are the consequences of reducing coal power? The government plans to stimulate the development of coal power in the inner West. But this takes time to build. There are ongoing concerns about water shortage in West China. Therefore, the government s action plan is anticipated to contain the growth of China s coal power generation. The energy gap needs to be filled up by something else. 10 Presentation title Presenter name

11 What can replace Chinese coal power? Source: US EIA. 11 Presentation title Presenter name


12 The role of coal in national energy markets China s Primary Energy Consumption, 2012 China s Coal Consumption, 2012 Source: US EIA. Source: 12 Presentation title Presenter name
13 So the questions to ask What would be the environmental impacts of coal-to-gas switching? What would be the co-benefit of carbon mitigation? What does it mean for the Chinese energy markets and economy? What does it mean for other countries? 13 Presentation title Presenter name
14 The role of coal in global energy markets And coal provides 3 of global primary energy needs. 14 Presentation title Presenter name


15 Modelling Approach GTEM-C is a global-scale multi-sector dynamic CGE model designed to analyze economic tradeoffs associated with production and use of fossil fuels and GHG emissions. GTEM-C features careful representation of major geographic regions and economic activities that are most relevant to climate change, carbon mitigation and energy transformation. GTEM-C has detailed accounting of commodityembedded energy flows and carbon emissions from various sources. Source: Cai et al. (2015).

16 Theoretical structure of GTEM-C GTEM-C Biophysical Models Policy Households: Demand goods & services Supply factor inputs Carbon and pollutant emissions Atmosphere GTEM-C is a global-scale multi-sector dynamic CGE model Government designed to analyze Final goods & economic tradeoffs services associated with production and use of fossil fuels and GHG emissions. Policy Factor inputs Firms: Demand factor inputs Supply (final) goods & services Intermediate goods & services Socioeconomic system GTEM-C features careful representation of major geographic regions and Agricultural economic activities that are endowment & most relevant to working climate change, carbon environment mitigation and energy transformation. Heating, power, mobility GTEM-C has detailed Climate accounting of commodityembedded energy flows and carbon emissions from various Land sources. & amenities Fossil fuels & alternative energy sources Biophysical system


17 GTEM-C Electricity Technologies Coal Nuclear Wind Waste Coal with Carbon Capture and Storage Oil Hydro & Geothermal Solar Other Renewable Oil with Carbon Capture and Storage Gas Biomass Gas with Carbon Capture and Storage Source: Cai and Arora (2015).
18 Accounting for air pollutants from industrial combustion Coal emission factors Kt / Mtoe Electricity Transportation Other Industries Coking Household SO b a a NOx 9.6 a 11.0 c 11.0 c 1.0 c 4.0 c PM e e 3.8 e PM b e 3.4 Gas emission factors Kt / Mtoe Electricity Transportation Other Industries Conversion Household SO d NOx 2.0 a 22.0 c 3.0 c 0.3 c 1.0 c PM e e e e e PM e e e e e Oil emission factors Kt / Mtoe Electricity Transportation Other Industries Refining Household SO a 1.1 a 11.0 a a NOx 10.0 a 23.0 c 4.0 a 0.3 c 17.0 a PM e 2.5 e 0.05 e 1.0 e 0.04 e PM e 2.10 e 0.01 e 1.0 e 0.04 a Source: a. Klimont et al. (2009); b. Zhang et al. (2009); c. Wang et al. (2011); d. de Gouw et al. (2013); e. IIASA, Note: Household includes private transportation. 18 Presentation title Presenter name

19 Baseline assumptions Variable Benchmark Population Growth IEO 2013 GDP IEO 2013 Fossil Fuel Supply IEO 2013 Energy Efficiency Improvement Carbon/Environment Policy Coal: 0.5-1% Oil: 2.5-3% in transport, 0.5% in others Gas: 0.5-1% Electricity: 1% Business as usual
20 Counter-factual experiment TWH Baseline Linear Peak and Decline Baseline: Chinese coal power generation increases by 2.5% per annum on average. Policy: Chinese government has recently announced a cap on the growth of coal use by 18% between 2013 and 2020, which implies an annual growth rate of 2% over the period.
21 A two-by-two matrix scenarios Catalyst Gas Only Gas and Renewable Pathways Linear LG LR Peak-and-Decline PG PR
22 Power generation under alternative scenarios terawatt-hours Coal Power Generation terawatt-hours Gas Power Generation terawatt-hours 3000 BS Renewable Power Generation 2,000 1,800 1,600 1,400 1,200 1, BS terawatt-hours 0 BS Total Power Generation 17,000 15,000 13,000 11,000 9,000 7,000 5,000 3,000 BS Share of coal power falls down to 63%, i.e., by 10 percent points.
23 Pollutant emissions under alternative scenarios million tonnes Economy-Wide SO2 million tonnes Economy-Wide NOx 30 BS 15 BS million tonnes Economy-Wide PM10 million tonnes Economy-Wide PM BS 3.0 BS Cumulative emissions of SO2, NOx, PM10, and PM2.5 in China are projected to drop by 160 MT (9.5%), 60 MT (6.), 15 MT (8.5%) and 14 MT (9.).
24 Carbon footprints under alternative scenarios million tonnes million tonnes Power Sector CO BS CO2 Intensity of Electricity BS million tonnes million tonnes Economy-Wide CO BS CO2 Intensity of GDP 12 th 5-Year Plan for 2015 (17% reduction) Copenhagen Commitment for 2020 (4 reduction) 0.5 BS The LR scenario is superior, because cumulative CO2 emissions between 2015 and 2040 are projected to be MT, or 5% lower than under the baseline scenario, and China is closer to achieving the Copenhagen Commitment.
25 Impacts on energy markets under alternative scenarios -2% -4% -6% -8% -1-12% -14% Coal Consumption Gas Consumption -16% -1% -2% -3% -4% -5% -6% -7% -8% Coal Production 35% 3 25% 2 15% 1 5% Gas Production -9% Chinese gas production will not be able to keep up with the increased demand for gas power generation. The gap needs to be filled up by more imports.
26 Impacts on prices under alternative scenarios -5% -1-15% -2-25% -3-35% Coal Price Gas Price % % % % % Electricity Price Consumers' Price Index (CPI) Having more renewable has the potential to reduce the increase in gas price, by half. Electricity price could be lower in the early stage of switching due to lower coal price. Learning by doing of the renewable technologies is most significant under LR.
27 Impacts on macro-economy under alternative scenarios 0,5 GDP 0,4 0,3 0,2 0,1 0,0-0,1-0,2
28 Which could be a better scenario for China? Net Present Value of China s GDP Change under Alternative Scenarios (Unit = billion 2007 US$) Scenario Discount Rate 1% 2% 3% 4% 5% 6% 7% 8% 9% 1 LG LR PG PR With a discount rate of 3-5%, the Linear pathway with development of renewable energies (LR) can result in net GDP gains, or at least reasonably low (although not necessarily the lowest) GDP loss. And we haven t accounted from the potential benefit on environment and human health by mitigation air pollutants from coal combustion. So the LR scenario could be the way ahead.
29 But what would be the impacts on global production? Global gas production 8% 7% 6% 5% 4% 3% 2% 1% Asia 14% 12% 1 8% 6% 4% 2% Russia 0.3% 0.2% 0.1% % -0.2% -0.3% -0.4% -0.5% North America Middle East 1.2% % 0.6% 0.4% 0.2% % -0.4% Oceania 1% 1% 1% 1% 1% -0.6% World 3.5% % % % 0.
30 And global consumption? Global gas consumption 3 25% 2 15% 1 5% Asia -1% -2% -3% -4% -5% -6% -7% -8% Russia % % % North America Middle East 0.5% % % % % % -9% Oceania -1% -2% -3% -4% -5% -6% -3. World 3.5% % % % 0.
31 What about GDP? USA % 0.01% 0.01% 0.0 Rest of North America % -0.03% -0.05% -0.08% South America % -0.01% -0.01% 0.0 Europe % -0.01% China % -0.08% Northeast Asia % 0.05% 0.07% 0.09% 0.08% India % 0.05% 0.06% Rest of Asia % -0.11% -0.21% -0.34% -0.4 Russia 0.01% 0.04% -0.09% -0.03% 0.17% 0.36% Oceania % 0.07% 0.13% 0.22% 0.27% Middle East % -0.15% % -0.8 Africa % % -0.31% -0.42% world % -0.02% -0.04% -0.07%
32 Implications To tackle air pollution, China will need to reduce its coal power generation in the near future. This environmental policy can have co-benefit of CO2 reduction. This will potentially push up the demand for natural gas, but allowing the development of more renewable could reduce the impacts. Due to the sheer size of the China, the national environmental policy can have far reaching impacts on the rest of the world. Russia and Oceania (gas exporters), and Japan and India (coal importers) could become the winners of the increased gas demand from China, but at the cost of higher global gas price, which could lead to lower global GDP. 32 Presentation title Presenter name
33 Future directions To develop a global model that has regional details of China (collaborating with Gabriele at FEEM and Yingying at Shanghai University). To further investigate the interaction between China s environmental and carbon policies. 33 Presentation title Presenter name
34 Thank you Yiyong Cai E: T: INTEGRATED GLOBAL MODELLING AND ANALYSIS