Bracebridge Wastewater Treatment 2017 Summary Report
|
|
|
- Osborne Hodges
- 5 years ago
- Views:
Transcription


1 Bracebridge Wastewater Treatment 2017 Summary Report Environmental Compliance Approval: 6222-AFGSNY (Dec )
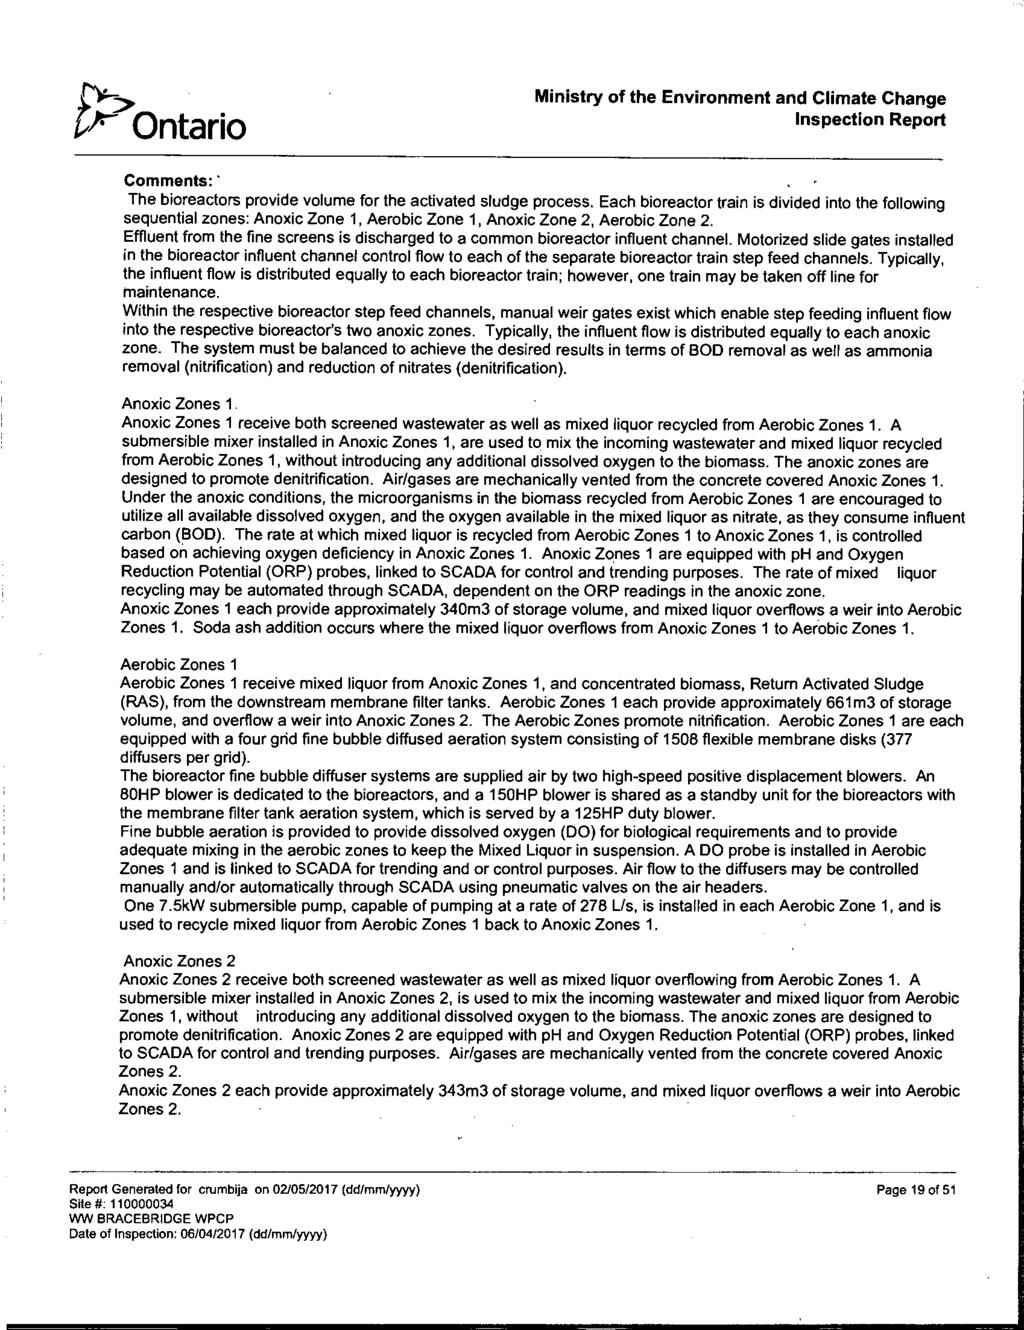
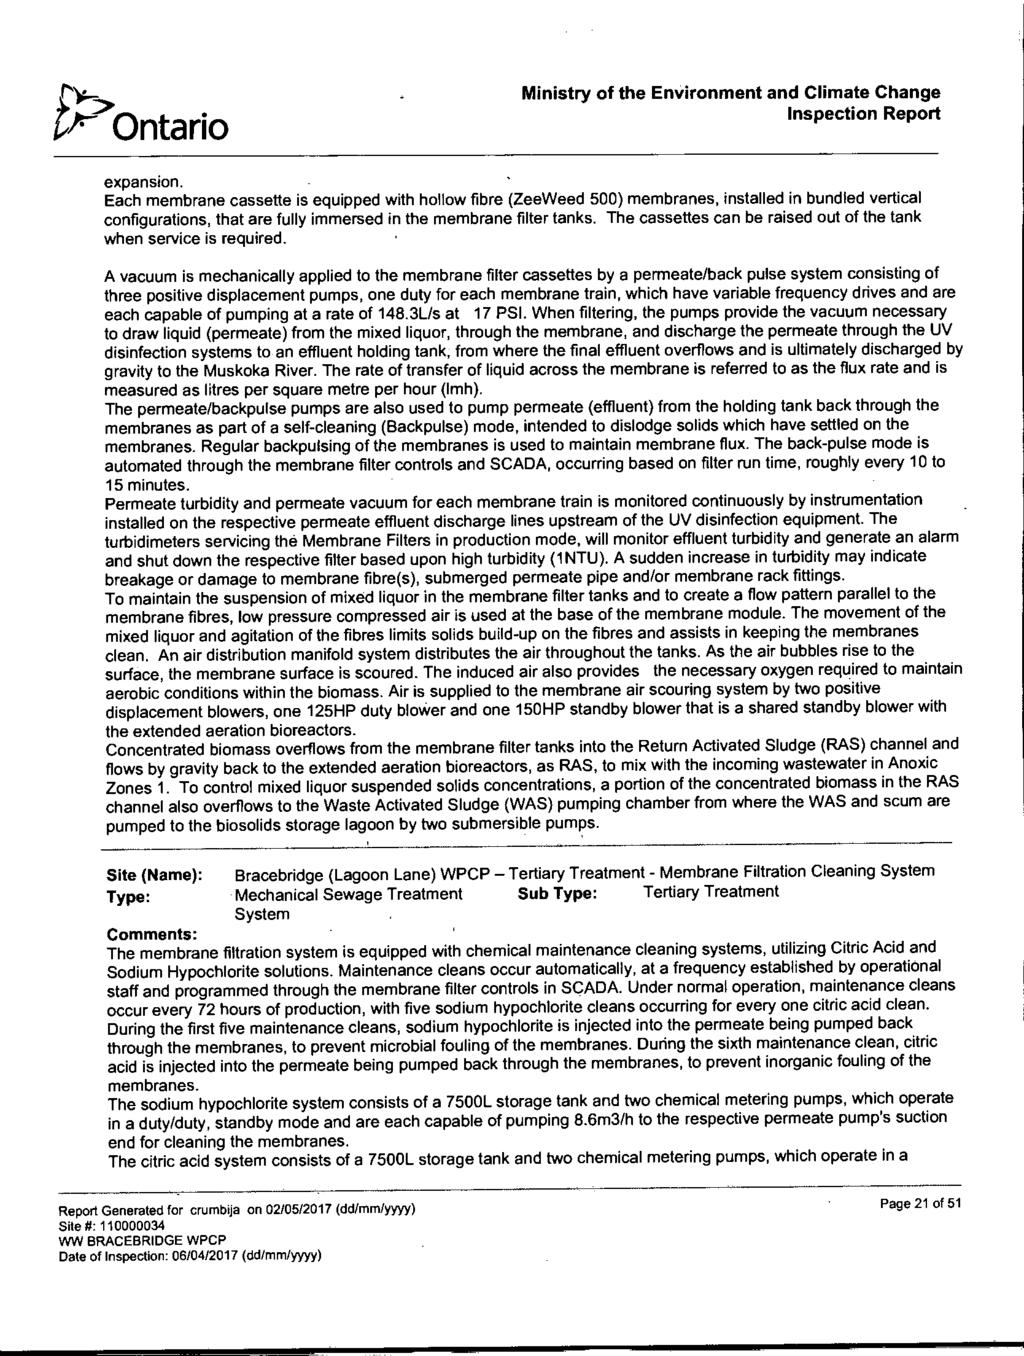
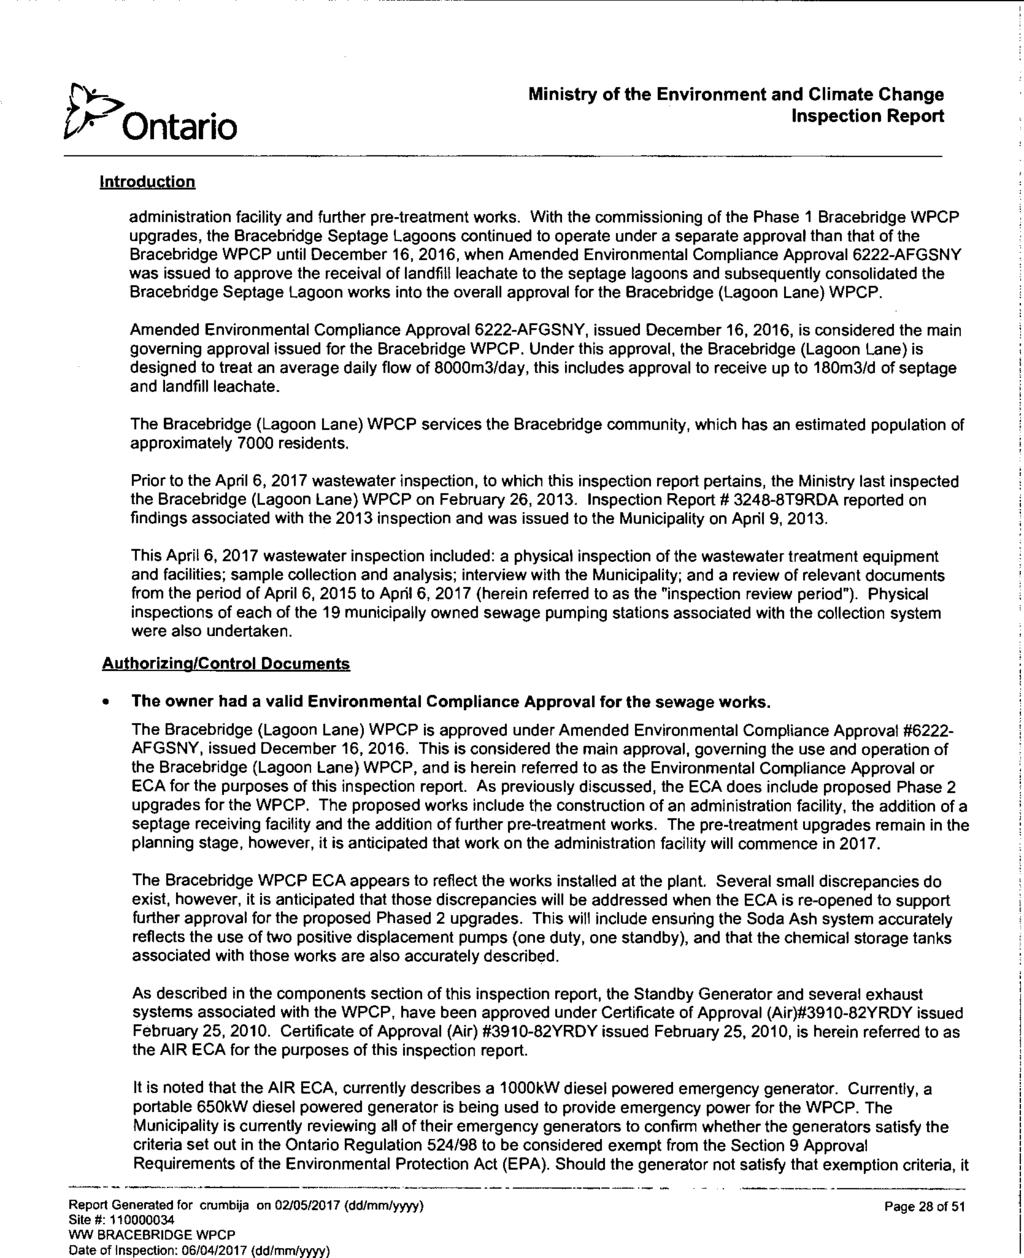
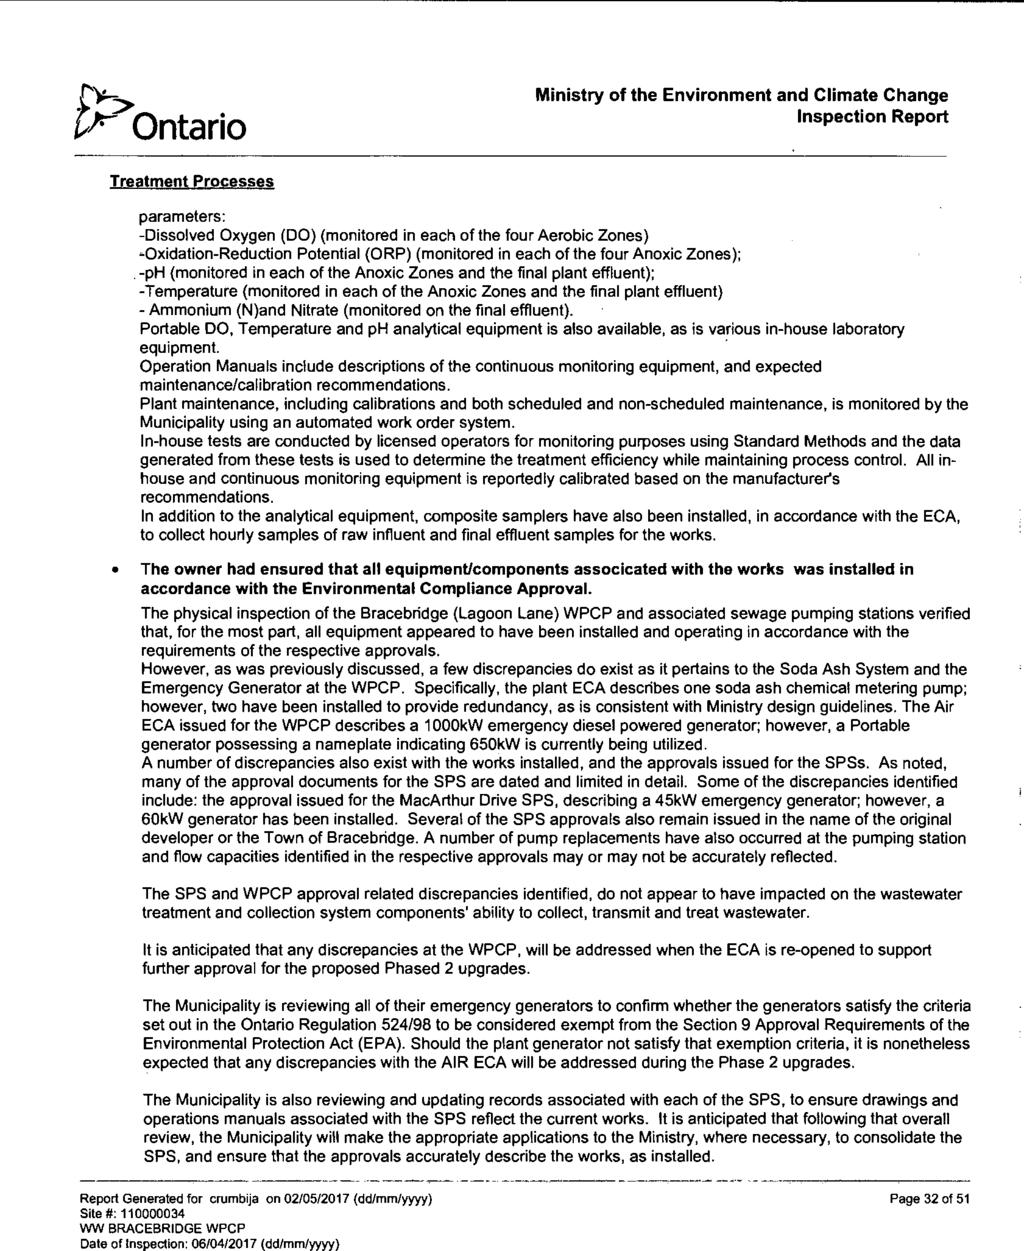
2 INTRODUCTION The Lagoon Lane Wastewater Treatment Plant is owned and operated by the District Municipality of Muskoka. The plant is located at 1000 Lagoon Lane in the Muskoka Township, Lot 8, Concession 13, now in the Town of Bracebridge serving a population of approximately 7,000 people. The treatment facility consists of 60 acres of facultative lagoons and a membrane filtration treatment plant. The first two lagoons were constructed in They were 23 acres in size. By 1976, additional capacity was required to meet the needs of the town. At that time, an additional 37 acres of lagoons were constructed bringing the total to 60 acres. In 1983, an extended aeration treatment plant was commissioned to provide additional capacity for the growing town. In 2011 a new membrane filtration (MBR) plant was constructed to replace the extended aeration facility. Alum is used as the coagulant and disinfection is by ultra-violet lights. The final effluent is discharged to the Muskoka River by way of a diffuser. The new plant was commissioned in November The new MBR plant has a treatment capacity of 8,000 cubic meters per day. Limit criteria for the MBR facility are as follows: Effluent Parameter CBOD Total Suspended Solids Total Phosphorous Total Ammonia Nitrogen Summer (May 15 to September 30) Winter (October 01 to May 14) E. coli Concentration 10 mg/l 10 mg/l 0.4 mg/l 5.0 mg/l 10.0 mg/l 80 counts/100ml (Monthly Geometric Mean Density) Executive Summary A review of the District of Muskoka s infrastructure needs is conducted annually by the Director of Water and Sewer Services, Area Manager and Chief Operator and recommendations for maintenance, rehabilitation and renewal programs are considered Efforts to eliminate the discharge of untreated or partially treated wastewater to receiving waters are being accomplished by a long term financial commitment to correct excessive infiltration into the wastewater collection system by means of sewer main
3 rehabilitation / replacement, manhole rehabilitation and pumping station rehabilitation programs. The treatment facility is capable of effective operation during emergencies, maintenance shut downs, and power failures. This is achieved through such measures as preventive maintenance of duty / standby units, the duplication of major treatment components, the provision of standby power sources and extensive use of the SCADA systems. All operators are qualified to operate the systems efficiently and effectively in order to achieve the highest level of treatment at all times; a commitment to provide Operator training and certification is being sustained. Regulatory sampling is carried out to meet the requirements outlined in the ECA. Additional in house operational sampling beyond these regulatory requirements is being performed on a routine basis, These efforts have resulted in an effective treatment process which ensures that effluent discharges consistently meet effluent objectives and are environmentally safe. The treatment facilities currently operated under Certificate of Approval #6222-AFGSNY All final effluent sample results for the MBR facilities met their effluent limits. All data in this report is a compilation of test results received from accredited laboratory, Lakefield Research, and all in-plant testing used Standard Methods testing protocols, or equivalent. A. Interpretation of Monitoring Data The information reported in the Final Effluent sample results summary table #7 consists of test results of analysis conducted on final effluent composite samples. Bacteriological samples, however, consisted of grab samples. Weekly analysis has been performed and reported as specified under the terms outlined in the ECA. Minimum 4 Week Average Maximum Annual Average Average Loading kg/day CBOD5 (mg/l) Suspended Solids (mg/l) Total Phosphorous (mg/l) Ammonia (mg/l) E. Coli (#/100 ml) Not Applicable ph Min 6.33 Max Not Applicable
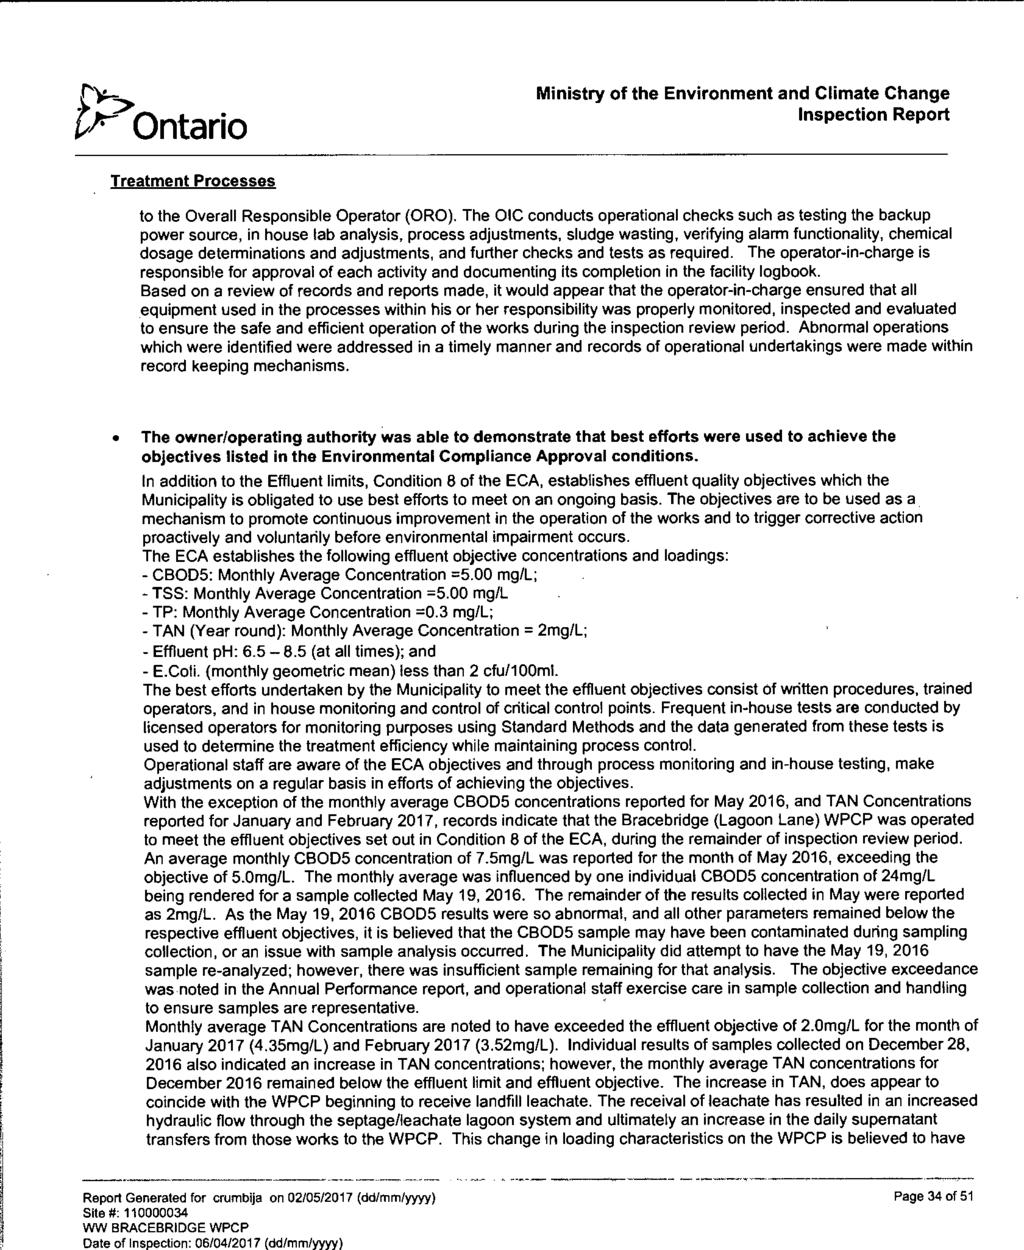
4 Carbonaceous Biochemical Oxygen Demand (BOD5) The Lagoon Lane Wastewater Treatment Plant (WWTP) effectively removed 99% of influent CBOD5 throughout the reporting period. The Effluent Carbonaceous Biochemical Oxygen Demand (CBOD5) was consistently measured below the allowable Limit throughout the reporting period. In addition the Effluent CBOD5 also consistently measured below the objective levels for the reporting period. Total Suspended Solids (TSS) Throughout the reporting period, approximately 99% of Influent TSS was removed in the facility. The Effluent concentrations were maintained within the allowable limits. The facility effectively removed and treated TSS, even when influent TSS was higher than normal. In addition the Effluent Total Suspended Solids also consistently measured below the objective levels for the reporting period. Total Phosphorus (TP) The Bracebridge WWTP successfully removed 99% of incoming TP throughout the reporting period. The Effluent Total Phosphorous was consistently measured below the allowable Limit throughout the reporting period. In addition the Effluent Total Phosphorous also consistently measured below the objective levels for the reporting period. Total Ammonia Nitrogen Total Kjeldahl Nitrogen (TKN) is made up of Organic Nitrogen and Ammonia + Ammonium. The ECA stipulates that TKN shall be monitored in the Influent, and Total Ammonia Nitrogen be monitored in the Effluent. The yearly average Influent TKN concentration was 29.4 mg/l, and the yearly average Total Ammonia Nitrogen concentration in the Effluent was 1.21 mg/l. The facility continuously operated within the Effluent Limits. The facility is also required to calculate the Unionized Ammonia concentration, which is the toxic form of Ammonia to fish, on a weekly basis. The annual average un-ionized ammonia concentration was mg/l, with the highest average measured at 0.07 mg/l in December Geometric Mean Density of E. Coli The yearly average Geometric Mean Density of E. Coli was 0 #/100 ml. The monthly average was also 0. From these figures, it is evident the facility is consistently able to disinfect the effluent such that the values do not exceed the allowable limit of 80 #/100 ml. In addition the Geometric Mean Density of E. Coli also consistently measured below the objective levels for the reporting period. ph The Lagoon Lane Wastewater Treatment Plant WWTP requires the Effluent ph remain within the range of inclusive at all times. This was achieved by maintaining the ph between 6.33 and 7.48.
5 It should be noted that ph measurements to determine compliance with the ECA are tested In-House In 2017, the soda ash system was used periodically to increase ph and alkalinity levels when receiving larger volumes of septage/lechate supernatant from the onsite receival. Average Daily Flow The Lagoon Lane WWTP rated capacity is 8,000 m 3 /day with a peak flow rating of 18,000 m 3 /day. The Average Daily Flow did not exceed the rated capacity throughout the reporting period. The Average Daily Flow was 4187 m 3 /day. The 3 year average is 3,826 m 3 /day which represents 48% of the new facilities capacity. The Max daily flow was 8,707 m 3 /day which was well below the 18,000 m 3 /day peak day flow rating. B. Summary of Operating Problems throughout the reporting period Minor process control issues were experienced in early 2017 as higher volumes of septage and leachate supernatants were introduced to the process. These were overcome by increased frequency of process testing and by the addition of Soda Ash periodically to manage ph and alkalinity reductions incurred. C. Summary of Maintenance carried out on the Works The staff performed routine preventative maintenance from work orders that were generated by the Antero maintenance software.. D. Summary of Effluent Quality Assurance or Control The Lagoon Lane Wastewater Treatment Plant operators collect Raw Influent, Aerobic Zone, and Final Effluent samples on a regular basis and analyze these samples inhouse for various parameters. These results are used for process control purposes, and plant adjustments are made to optimize plant performance. On a weekly basis, Operators collect more samples than are required by the ECA, and these samples are sent to SGS Analytical Services Inc. for analysis to determine compliance with the ECA Effluent Limits. E. Summary of calibration and maintenance carried out on Effluent Monitoring equipment The Lagoon Lane WWTP Operators receive routine Work Orders throughout the year to maintain the effluent composite sampler and associated appurtenances. The plant flow meters were calibrated in F. Summary of efforts made and results achieved in meeting effluent objectives.
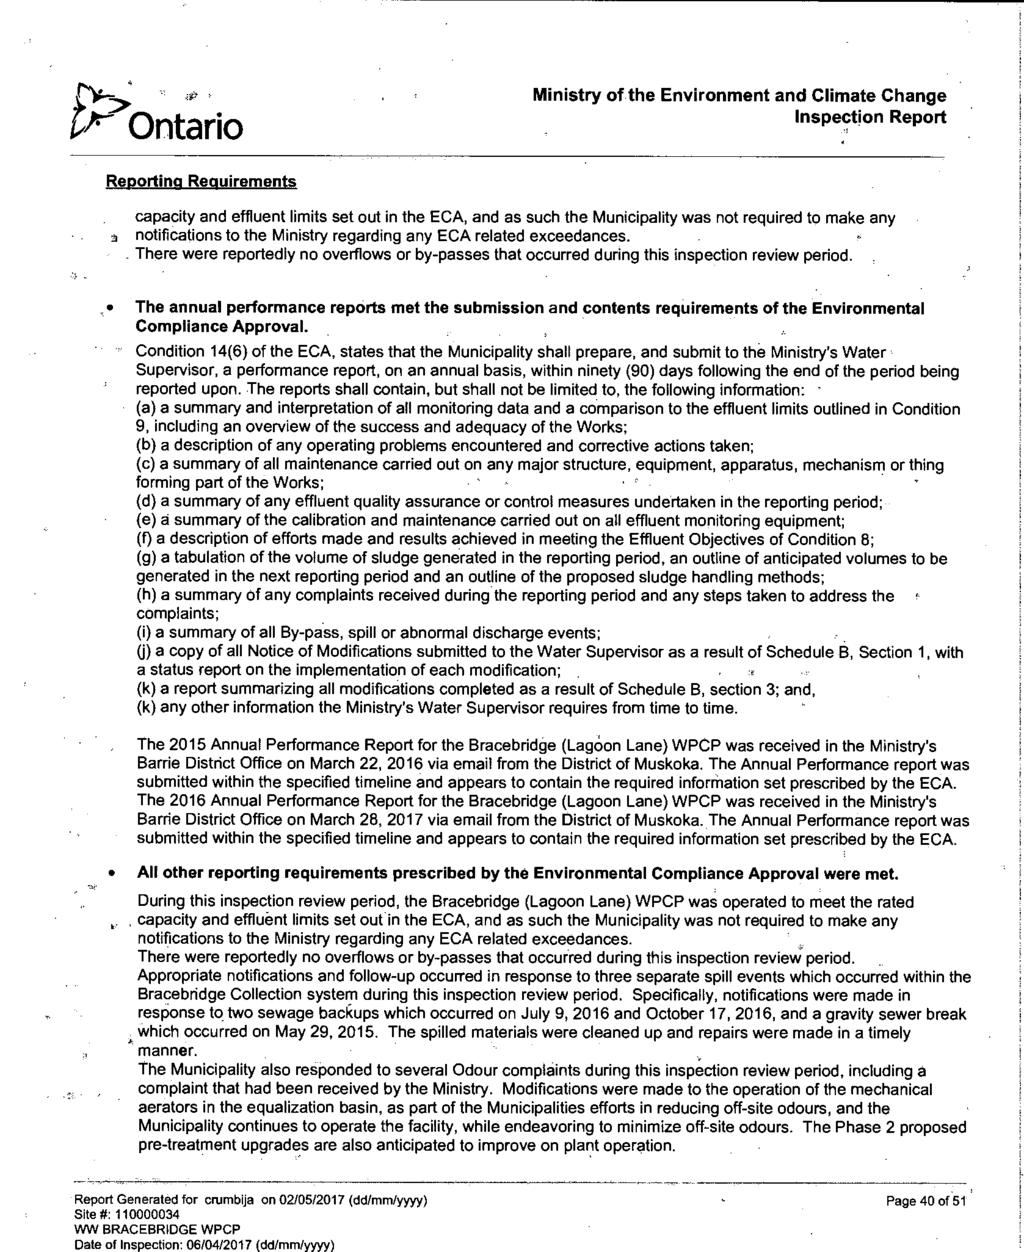
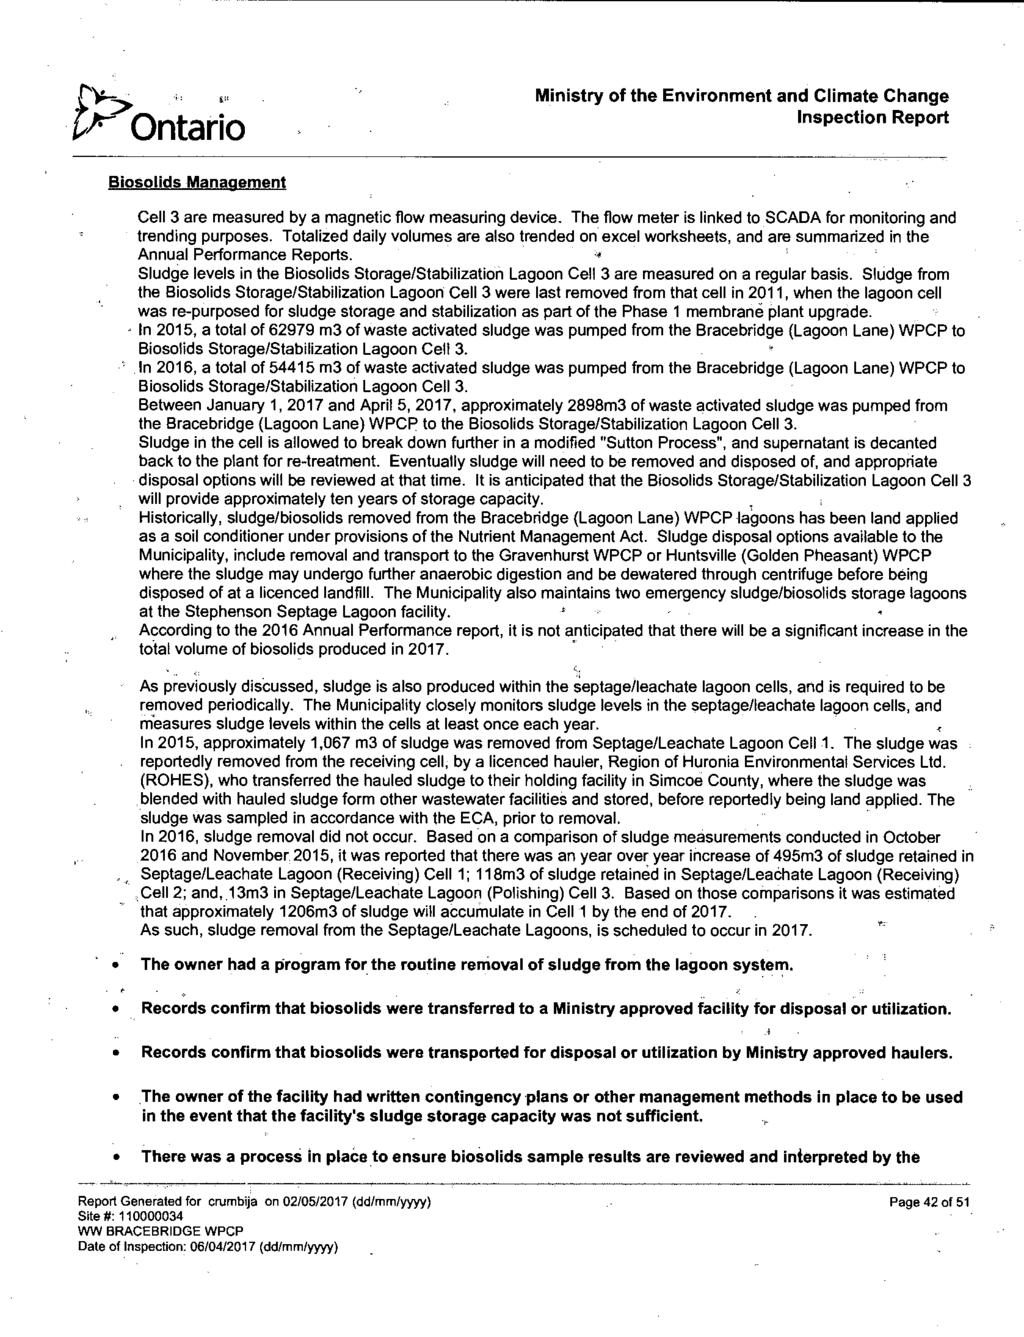
6 The new Lagoon Lane Wastewater Treatment Plant was able to meet the objectives for the facility. The staff monitored and adjusted processes in order to meet the objectives G. Tabulation of Sludge generation throughout the reporting period A total of 42,948 m 3 of sludge was pumped from the Lagoon Lane WWTP to the Lagoon Cell #3. Sludge in the cell is allowed to break down further in a modified Sutton Process m3 of sludge was removed from Cell # 3 in It is anticipated that further sludge removals will occur in It is not anticipated that there will be a significant increase in the total volume of biosolids produced in H. Summary of Complaints received throughout the reporting period There were no complaints received in the reporting period. I. Summary of Bypasses or Spills throughout the reporting period In the reporting period there were a number of short lived events of membrane permeate bypassing UV disinfection reported as listed below. Date Time Duration in Minutes Bypass Amount (mᵌ) Friday April 7, : Saturday April 8, : Sunday April 9, : Sunday April 9, : Monday April 10, : Monday April 10, : Wednesday April 12, : These were caused by a faulty permeate valve s failure to close completely while the train was not in production and in absence of an active UV reactor. This condition was reported to the Ministry and was remedied by the replacement of the valve, the actuator, and control pilot solenoid. As well, an upgrade to the UV system programming was made so a UV reactor will start at any time there is flow (production or not) and will continue to run until flow has ceased for 30 minutes. Operators were also trained to maintain and test valve failure to close alarms. These repairs have eliminated recurrence of this condition and no other bypass events were experienced overall in this reporting year. These events were reported to the Ministry of Environment and Climate Change (MOECC) under incident report 2251-ALTGGU.
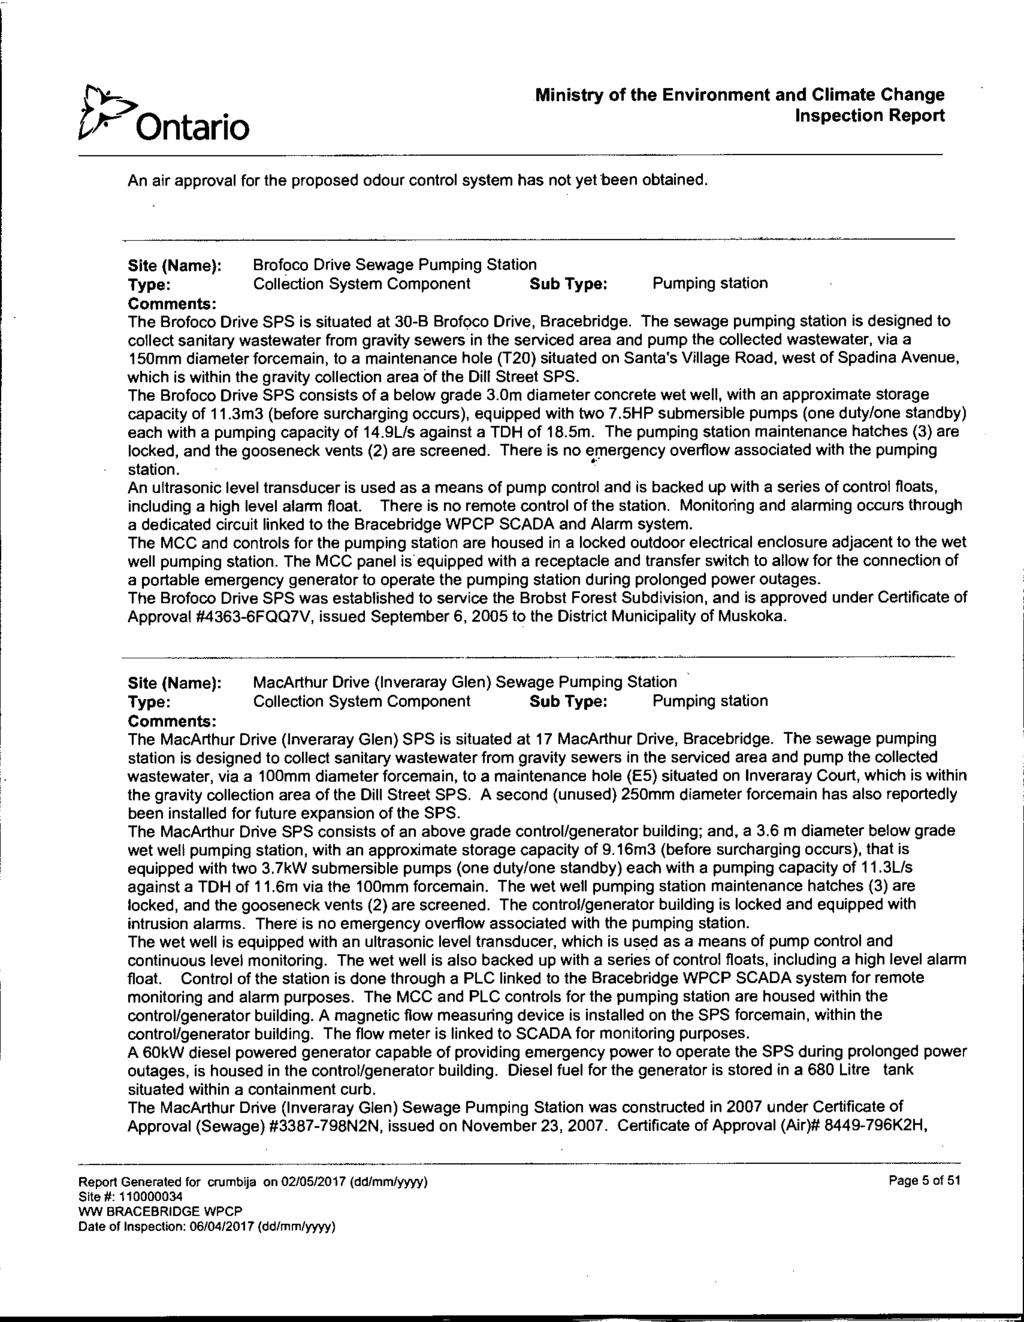
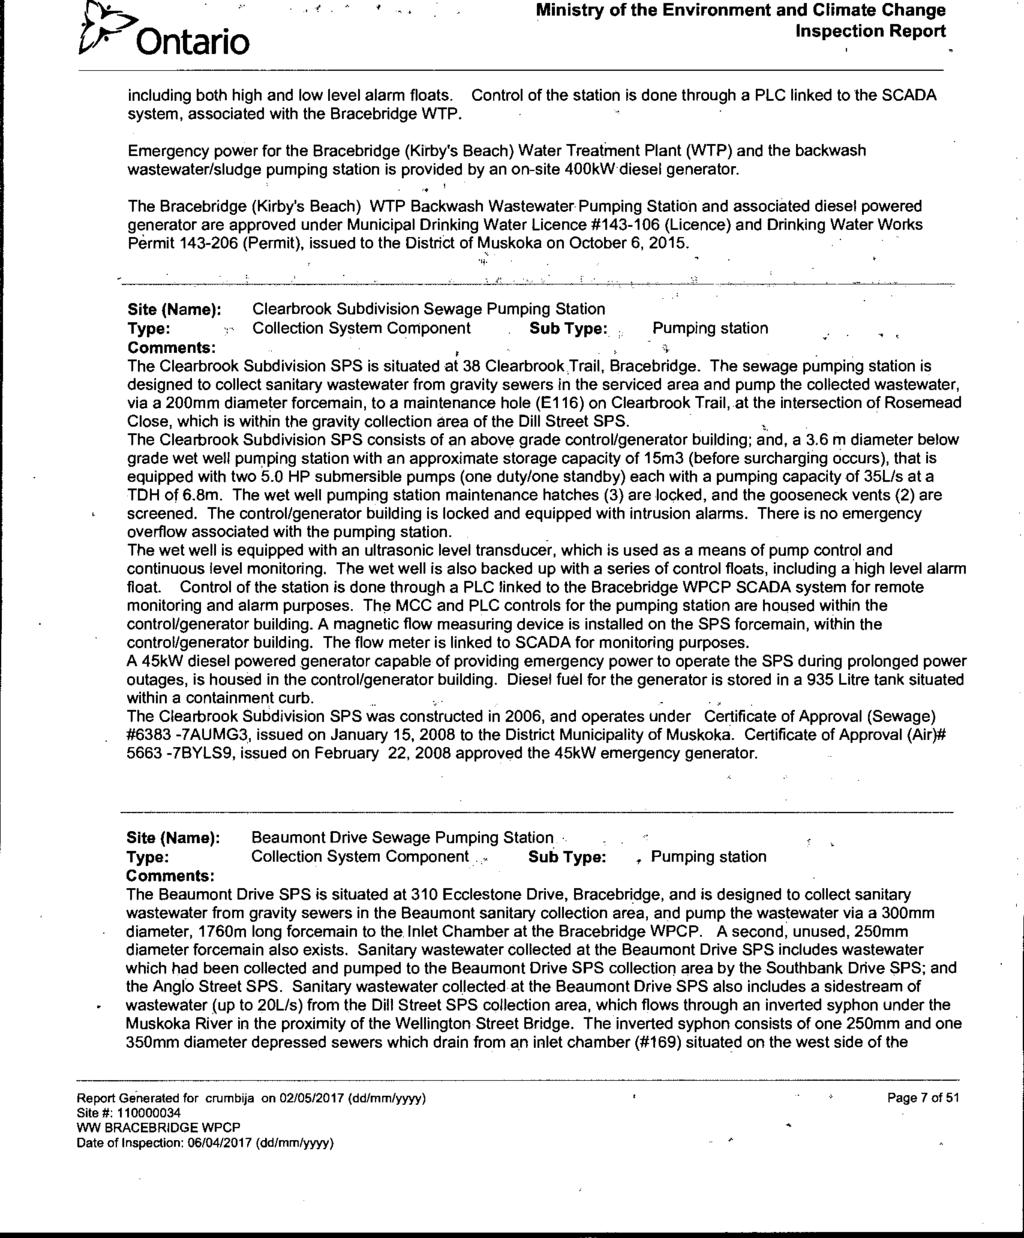
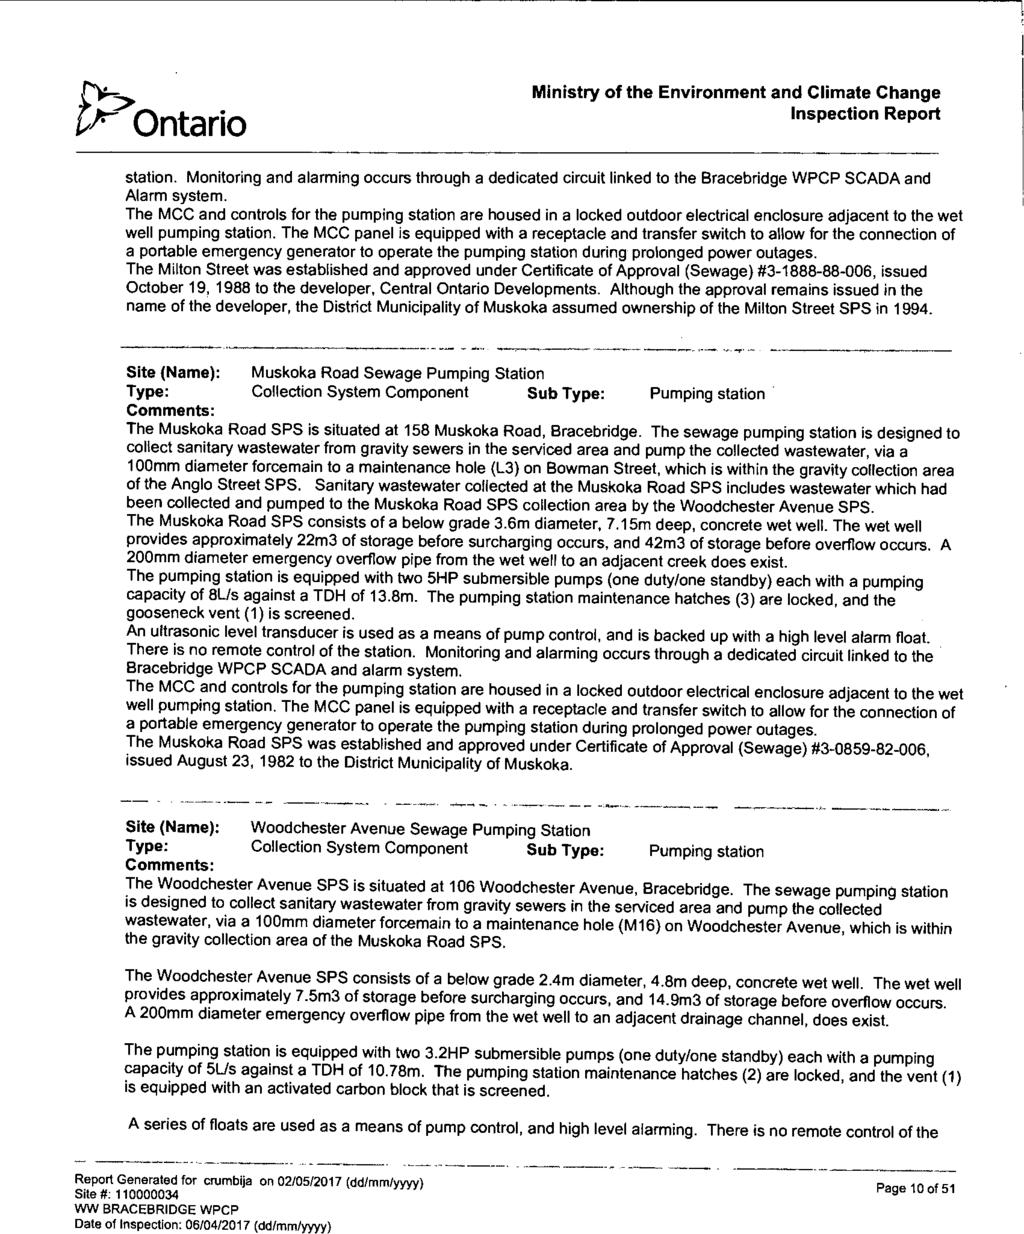
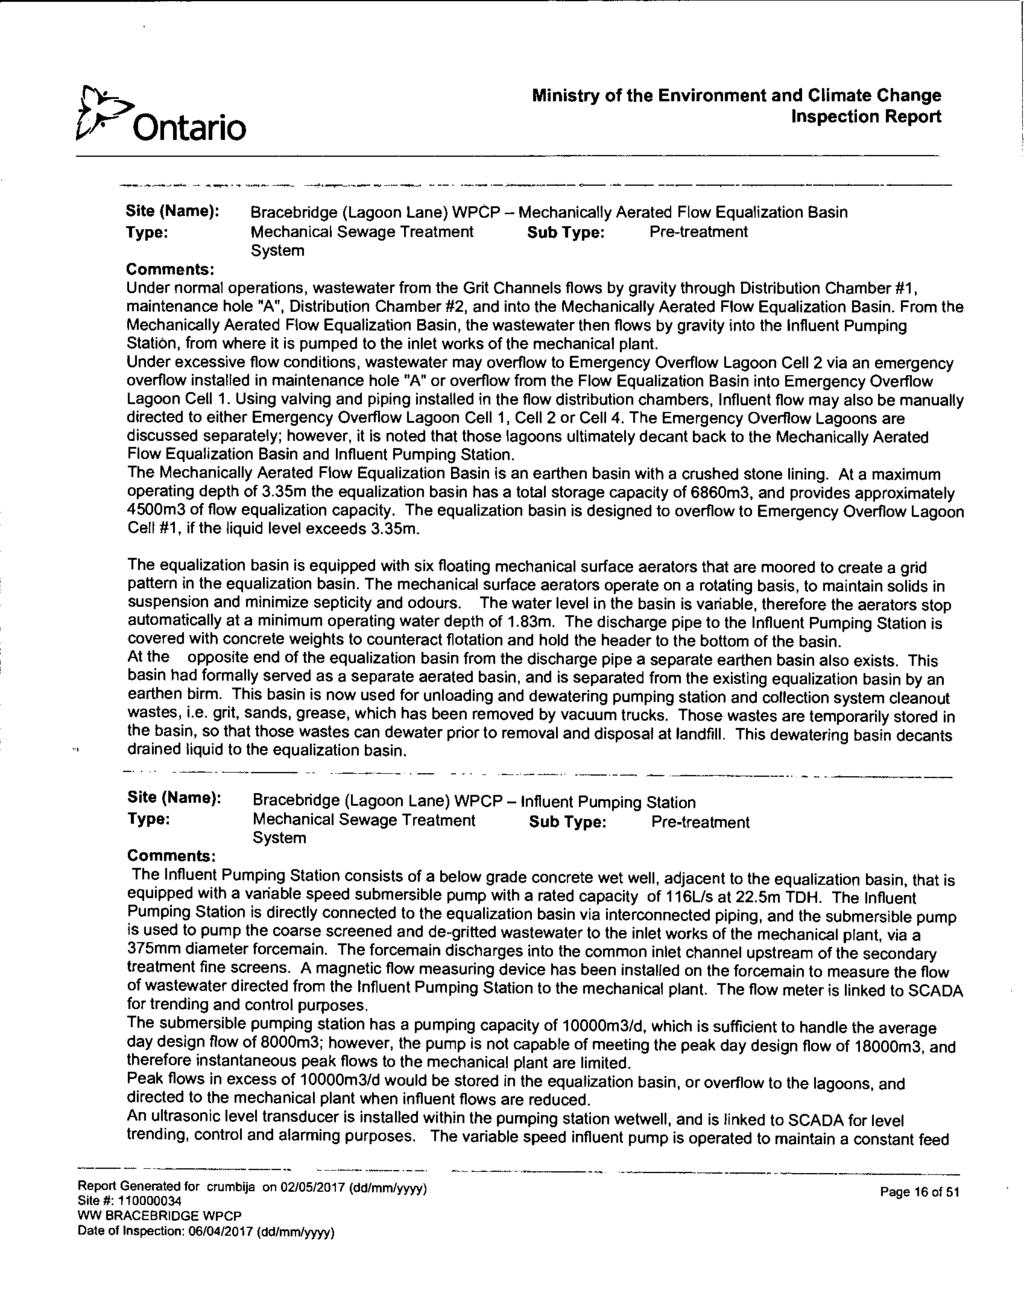
7 External Audits The Bracebridge Wastewater Treatment Plant and associated sewage pumping stations were inspected by the Ministry of Environment and Climate Change during 2017, the final inspection report is included with this report. Closing Remarks In general, the Lagoon Lane WWTP operated well throughout the reporting period. The Operators strive to maintain and operate the facility such that the Effluent Objectives are not exceeded to ensure superior effluent quality. Certification of Reports I certify that the information in this document and all attachments are correct, accurate and complete to the best of my knowledge. Marcus Firman, C.E.T. Director of Water and Wastewater Services Mike Mitchell Manager of Water and Wastewater Operations
8 New Sewer Mains 2017 BRACEBRIDGE WASTEWATER COLLECTION SUMMARY During 2017 approximately 335 m of sewer main were installed including an additional 2 manholes. New Services In 2017, 24 new sanitary permits were issued. Sanitary Lateral Blockages District staff was called to deal with 2 sanitary lateral blockages that required excavation and repairs by District staff as well as sub-contractors at a cost of approximately $ each Sewer Pump Stations In 2017 we had of our residential low pressure pumps stations completely replaced at a cost of approximately. Main Line Sewer Blockages We had one main line sewer blockage in 2017 with the cost of repair approximately $8, Sewer Force Mains We had no sewer force main issues in Sewer Flushing & Video Inspection In 2017 the District had 6000 Meters of sanitary pipe flushed with high pressure equipment then CCTV inspected at an approximate cost of $ 30, This information is invaluable when it comes to discovering infiltration or exfiltration issues within our system. Man Hole Rehabilitation We had no manholes rehabilitated in Air Release Valves All of our Sewer Air Release Valves were inspected operated and cleaned in 2017 with 3 being replaced with new.
9 TABLE 1: EFFLUENT FLOW SUMMARY District of Muskoka - Lagoon Lane WPCP - Bracebridge Mechanical Plant Month Plant Total Monthly Flow (m 3 ) Average Day Flow (m 3 /d) Maximum Day Flow (m 3 /d) Minimum Day Flow (m 3 /d) Lagoons Monthly Flow (m 3 ) Facility Total Monthly Flow (m 3 ) Comments January 115,453 3,724 5,256 2, ,453 February 110,825 3,958 7,280 1, ,825 March 179,592 5,793 8,707 3, ,592 April 206,332 6,878 8,673 5, ,332 May 176,691 5,700 8,375 3, ,691 June 114,704 3,823 5,517 2, ,704 July 116,047 3,743 5,605 3, ,047 August 104,300 3,365 4,153 2, ,300 September 105,742 3,525 4,711 2, ,742 October 91,861 2,963 4,057 1, ,861 November 113,976 3,799 4,763 3, ,976 December 92,817 2,994 3,691 2, ,817 Mechanical Plant Only Total 1,528,341 Average Day 4,187 Maximum Day 8,707 Minimum Day 1,313
10 TABLE 3: INFLUENT QUARTERLY ANALYSIS SUMMARY District of Muskoka - Lagoon Lane WPCP - Bracebridge Sample Date Weekly 24 Hour Composite Sample Alkalinity (Total as BOD5 CaCO3) ph Phosphate Sample Identification Number Total Phosphorus mg/l mg/l mg/l mg/l mg/l Feb 15/ 17 CA May 03/ 17 CA Aug 15/ 17 CA Nov 8/ 17 CA Yearly Average Maximum Minimum Suspended Solids Sample Date 4 Hour Composite Sample Conductivity Total Kjeldahl Nitrogen Nitrate Nitrogen Nitrite Nitrogen Total Ammonia Nitrogen CBOD5 mg/l mg/l mg/l mg/l mg/l mg/l Feb 15/ 17 CA May 03/ 17 CA Aug 15/ 17 CA Nov 8/ 17 CA Yearly Average Maximum Minimum
11 TABLE 4: CHEMICAL USAGE SUMMARY District of Muskoka - Lagoon Lane WPCP - Bracebridge ALUM SODA ASH SODIUM HYPOCHLORITE CITRIC ACID Average Total kg Estimated Average Total kg Estimated Average Total Estimated Average Total Estimated Month Dosage (Dry) Monthly Cost Dosage (Dry) Monthly Dosage Litres Monthly Cost Dosage Litres Monthly Cost January , $0 na 236 na 79 February ,394.8 na 289 na 79 March ,935.7 na 736 na 263 April ,422.0 na 893 na 263 May ,531.8 na 762 na 210 June ,690.1 na 5,175 na 131 July ,613.7 na 26 na 184 August ,154.6 na 447 na 131 September ,312.9 na 499 na 184 October ,853.8 na 525 na 184 November ,236.5 na 1,997 na 447 December ,236.5 na 1,918 na 919 Average Monthly $ $ $ $0 Unit Cost (see note 1) per kg per kg per MT per MT Total Yearly 78,701 $0 0 $0 13,503 $0 3,074 $0 TOTAL YEARLY COST OF CHEMICALS = $0
12 TABLE 6: EFFLUENT QUARTERLY ANALYSIS SUMMARY District of Muskoka - Lagoon Lane WPCP - Bracebridge Sample Identification Number Alkalinity (Total as CaCO3) ph Phosphate Sample Date Total CBOD5 Phosphorus mg/l mg/l mg/l mg/l mg/l Feb 15/ 17 CA May 03/ 17 CA Aug 15/ 17 CA Nov 8/ 17 CA Yearly Average Maximum Minimum Suspended Solids Sample Date Total Kjeldahl Nitrate Nitrite Total Ammonia Conductivity Nitrogen Nitrogen Nitrogen Nitrogen Chloride mg/l mg/l mg/l mg/l mg/l mg/l Feb 15/ May 03/ Aug 15/ Nov 8/ Yearly Average Maximum Minimum
13 TABLE 7: EFFLUENT LOADING and CONCENTRATION SUMMARY District of Muskoka - Lagoon Lane WPCP - Bracebridge MONTH CBOD 5 SUSPENDED SOLIDS TOTAL AMMONIA NITROGEN TKN FECAL COLIFORMTOTAL PHOSPHOROUS Summer (May to Oct) Winter (Nov to Apr) Maximum Maximum Maximum Maximum Maximum Average Average Average Average Average Average Maximum Maximum Average Daily Daily Daily Daily Daily Daily Daily mg/l kg/d kg/d mg/l kg/d kg/d mg/l kg/d kg/d mg/l kg/d kg/d mg/l kg/d kg/d #/100 ml #/100 ml mg/l kg/d kg/d January February March April May June July August September October November December Average Monthly Average Yearly Effluent Objective (mg/l) Non- Compliance < >10.0 >10.0 >5.00 >10.00 >80/100 > Note: Bracketed and Bolded Values indicate non-compliance ( )
14 TABLE 9: LIQUID SLUDGE PRODUCTION SUMMARY District of Muskoka - Lagoon Lane WPCP - Bracebridge Hauler Shipped To Received From No. Date Comments Location Volume Location Volume 1 January Pumped agoon Cell # February Pumped agoon Cell # March Pumped agoon Cell # April Pumped agoon Cell # May Pumped agoon Cell # June Pumped agoon Cell # July Pumped agoon Cell # August Pumped agoon Cell # September Pumped agoon Cell # October Pumped agoon Cell # November Pumped agoon Cell # December Pumped agoon Cell # Yearly Total 42,948 Yearly Total 0 Yearly Average 3,579 rly Average 0 Maximum 4,898 Maximum 0 Minimum 2,512 Minimum 0
15 TABLE 10: SLUDGE QUALITY ANALYSIS District of Muskoka - Lagoon Lane WPCP - Bracebridge Quaterly Analysis Parameter Sampled 1st Quarter 2nd Quarter 3rd Quarter 4th Quarter Average Comments Date Feb 15/17 May 03/17 Aug 15/17 Nov 8/17 Sample ID CA13467 CA12234 CA12534 CA13175 Nitrate mg/l Mercury mg/l < Chromium mg/l Cobalt mg/l Copper mg/l Lead mg/l < Molybdenum mg/l < Nickel mg/l < Selenium mg/l < Arsenic mg/l < Zinc mg/l Cadmium mg/l < Ammonia+Ammonium mg/l Total Kjeldahl Nitrogen mg/l Total Phosphorus mg/l Total Solids mg/l Volitile Solids mg/l Nitrite mg/l Potassium mg/l TSS mg/l
16
17
18
19

20
21
22
23

24

25
26

27

28

29

30

31
32
33

34
35

36
37

38
39

40

41
42
43
44
45

46
47
48

49
50
51
52
53
54
55
56
57
58
59
60
61

62
63
64

65
66
67
68
69
70
71
72