Direct Potable Reuse. Drivers, Regs, and Economics. RMWEA/RMSAWWA JTAC Luncheon. John Rehring, P.E. Denver, CO March 19, 2015
|
|
|
- Sharon Robertson
- 5 years ago
- Views:
Transcription


1 Direct Potable Reuse Drivers, Regs, and Economics RMWEA/RMSAWWA JTAC Luncheon Denver, CO March 19, 2015 John Rehring, P.E.


2 Potable Reuse Indirect Potable Reuse Environmental Buffer DPR mmwd1013i1.pptx/2

3 Drivers for DPR Regulatory Approaches DPR Economics mmwd1013i1.pptx/3


4 DPR is Getting Closer to Home Cloudcroft mmwd1013i1.pptx/4 Big Spring Wichita Falls Brownwood

5 mmwd1013i1.pptx/5 The U.S. Drought Monitor is jointly produced by the National Drought Mitigation Center at the University of Nebraska-Lincoln, the United States Department of Agriculture, and the National Oceanic and Atmospheric Administration. Map courtesy of NDMC-UNL.


6 Texas Reservoir Levels as of March 2015 mmwd1013i1.pptx/6 WaterDataForTexas.org


7 Climate models: By 2050 Southwest will become more hot, more dry Snowpack dynamics and storage will change Extended droughts with intense precipitation events and variability Water Sustainability Risk Index due to climate change in 2050 (Roy et al., 2012) mmwd1013i1.pptx/7


8 Goals and Measurable Outcomes reaching enhanced levels of municipal conservation and reuse. continue to make the most efficient use of their supplies. water reuse and conservation is a critical component of meeting future water needs. mmwd1013i1.pptx/8 conservation and reuse will help address Colorado s growing demands while upholding our Water Values.


9 Perspectives are Quickly Evolving on Augmenting Potable Supplies with Purified Water a solution of last resort National Research Council 1998 mmwd1013i1.pptx/9 could significantly increase the nation s total available water resources. National Research Council 2012

10 mmwd1013i1.pptx/10 CA Medical Association supports potable reuse


11 Why is POTABLE Reuse Attractive Here? Direct potable reuse IPR Groundwater augmentation Drought-resistant Local Lower energy Uses existing infrastructure Cost-effective IPR Surface water augmentation Other nonpotable uses Year-round Year-round mmwd1013i1.pptx/11 Landscape Irrigation Seasonal


12 DPR Initiative: Focused research mmwd1013i1.pptx/12 CA legislative mandate to investigate DPR criteria by 2016 > $6M pledged in support of DPR research $4.5M on 26 projects to date
13 Drivers for DPR Regulatory Approaches DPR Economics mmwd1013i1.pptx/13
14 What are our primary risks with DPR? Acute Pathogens Chronic Trace Organic Compounds mmwd1013i1.pptx/14 plus all the MCLs (of course!)
: The CWA and SDWA were not intended to be used for")
15 Non-Potable Reuse: Mitigate Risk by Avoiding Ingestion Potable Reuse: A Whole New Set of Challenges Trace Organic Compounds Pathogens CWA + SDWA = IPR CWA + SDWA = DPR mmwd1013i1.pptx/15 Reliability & Redundancy Monitoring & Treatment Technologies NWRI-NSF Direct Potable Reuse Treatment Workshop (July 2014): The CWA and SDWA were not intended to be used for DPR.


16 How do we address the gap? Clean Water Act DPR Regs Safe Drinking Water Act mmwd1013i1.pptx/16 How do we transform raw wastewater into a suitable raw water for potable supply?
17 Case Study: Trace Organic Concentrations vs. Human Health Benchmarks Compound WRF Effluent After O3/BAF At 30% blend mmwd1013i1.pptx/17 1,7 Dimethylxanthine 4 tert Octylphenol Acesulfame K Food additive. Human health benchmark not defined. Amoxicillin Atenolol Atrazine Butalbital Human health benchmark unknown. Caffeine Carbamazepine Carisoprodol Human health benchmark unknown. Cotinine and so on
18 Existing Regulations Define Safe Drinking Water for Regulated Compounds and Pathogens Severely impaired sewage?-raw water-? High quality WWTP effluent drinking water sitespecific quality sitespecific quality Defined: 10-4 risk mmwd1013i1.pptx/18 but not how to get there.
19 Regulatory Approaches to DPR Severely impaired sewage sitespecific quality WWTP effluent sitespecific quality High quality drinking water Defined: 10-4 risk TCEQ Approach (8V/6G/5.5C) mmwd1013i1.pptx/19 California / WRRF Approach (12V/10G/10C)


20 Monitoring technology limits options Magic Meter mmwd1013i1.pptx/20
21 Failure response time becomes critical with potable reuse Identify Failure Respond Sampling Interval Sample TAT System Reaction time Failure Response Time mmwd1013i1.pptx/21 Repeat for each combination of: (1) process, (2) pathogen, and (3) monitoring method
22 IPR vs. DPR: Natural vs. engineered buffers Response Retention Time (RRT) Treatment / Attenuation Perception mmwd1013i1.pptx/22 Long RRTs possible (months) Shorter RRTs required (hours days)


")
23 How do we Compensate for Reduced RRT? Accurate monitoring to detect failure Additional (redundant) treatment Sufficient storage to test WQ ahead of potable use mmwd1013i1.pptx/23 Long RRTs possible (months) Shorter RRTs required (hours days)
24 The Range of Potential RRTs is HUGE Monitoring Complexity Monitoring Focused RRT < 1 hour Online sensors for monitoring Storage Focused RRT in months Conventional monitoring mmwd1013i1.pptx/24 Response Retention Time (= Storage Volume)


25 For an Engineered Storage Buffer Bigger is Not Always Better! More response time Reduced monitoring MORE is better! Stored water quality mmwd1013i1.pptx/25 LESS is better! Water lost in process upset
26 DPR Failure Mitigation Alternatives Diversion of offspec water Monitoring & failure response is critical Stand-by process redundancy Monitoring & failure response is critical Duty process redundancy Monitoring & failure response is still important but less central The Four Rs of Potable Reuse Pecson, Trussell, Pisarenko, and Trussell JAWWA March 2015 R eliability R obustness mmwd1013i1.pptx/26 R edundancy R esilience
27 Monitoring study at Big Spring is assessing new monitoring tools with potential regulatory benefits Particle Counts for MF Integrity Trasar for RO Integrity Chloramines for UV dose Moss Creek Lake H 2 O 2 Secondary Effluent Microfiltration Reverse Osmosis UV <20% blend E.V. Spence Pipeline Raw Water Production Facility RO concentrate To drinking water plants mmwd1013i1.pptx/27

28 Evolving approach provides more credit for advanced monitoring MF RO UV/H 2 O 2 Cl 2 Process Monitoring Method Credits Awarded V P B Failure Response Time MF Pressure decay hours RO EC minutes UV/H 2 O 2 sensors minutes Cl 2 Online residual minutes mmwd1013i1.pptx/28 Totals hours Goals

29 Evolving approach provides more credit for advanced monitoring MF RO UV/H 2 O 2 Cl 2 Process Monitoring Method Credits Awarded V P B Failure Response Time MF Pressure decay hours RO EC minutes UV/H 2 O 2 UV sensors minutes Cl 2 Online residual minutes mmwd1013i1.pptx/29 Totals minutes Goals

30 Evolving approach provides more credit for advanced monitoring MF RO UV/H 2 O 2 Cl 2 Process Monitoring Method Credits Awarded V P B Failure Response Time MF Pressure decay hours RO Trasar minutes UV/H 2 O 2 UV sensors minutes Cl 2 Online residual minutes mmwd1013i1.pptx/30 Totals minutes Goals

31 DPR Projects are Informing the Regulatory Process CRMWD new Raw Water has: mmwd1013i1.pptx/31 Minimal trace pollutants No detected virus or protozoa Very low DBPFP after RO Cloudcroft processintensive approach Above and beyond the log removal targets Strong reliability and redundancy Operationally complex and challenging
 (f) of this title. Case-by-case approval Treatment requirements based on pathogen log reduction credits Pilot or full scale verification required mmwd1013i1.")
32 Regulation of DPR in Texas Public Drinking Water Innovative/alternate treatment clause: Any treatment process that does not have specific design requirements in (a) (f) of this title. Case-by-case approval Treatment requirements based on pathogen log reduction credits Pilot or full scale verification required mmwd1013i1.pptx/32


33 California s IPR Regs: Groundwater Replenishment Filtered, disinfected tertiary water 12/10/10 log reduction for enteric virus, Giardia, and Crypto Total N <10 mg/l Others < MCL or AL 5:1 Groundwater: Recycled Water mmwd1013i1.pptx/33 RO for injection systems Virus credit for every 1 month in aquifer storage Surface water augmentation GW injection


")

34 Path Toward National Guidelines No National Guidelines or Regulations Exist Many States and Considering Their Own Approaches (TX, CA, OK, NM) mmwd1013i1.pptx/34 Substantial database of information available for common benefit.


35 Path Toward National Guidelines Document issues important for developing DPR guidelines Overview of topics important in DPR implementation Public health protection Multiple barriers Treatment technologies WQ & performance monitoring Operation management Utility and agency staff Regulators Water professionals interested in DPR Purpose Focus Audience mmwd1013i1.pptx/35
36 Anticipated Outcomes 1 A resource on DPR including information and expert judgment Source of information on the protection of public health for DPR Review the factors and topics related to implementing DPR 2 Address the need the for potable reuse guidelines Provide direction and criteria to ensure DPR quality and safety mmwd1013i1.pptx/36
37 Drivers for DPR Regulatory Approaches DPR Economics mmwd1013i1.pptx/37
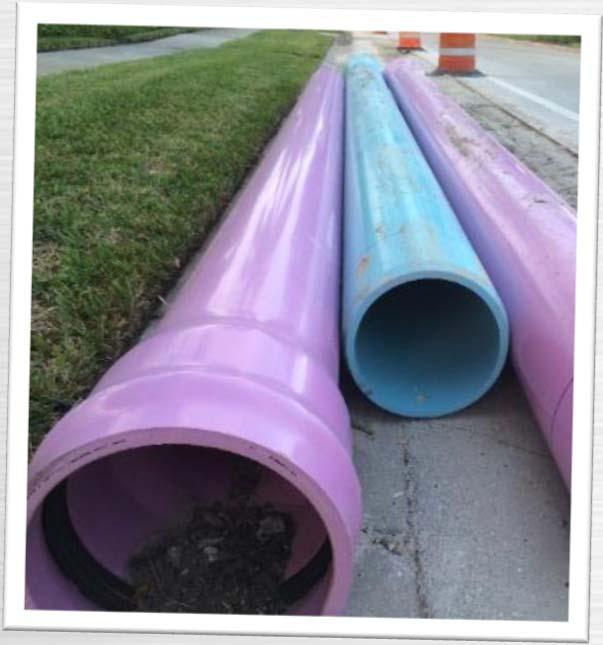
38 NPR vs IPR/DPR: Which set of pipes carries more water? mmwd1013i1.pptx/38 ~$4.3M to move 25 mgd one mile ~$1.5M to move 25 mgd one mile plus existing potable infrastructure


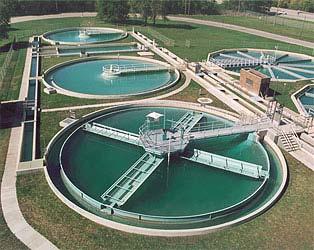
39 IPR vs. DPR: Sometimes IPR = WTW* WTP IPR WTP WRF mmwd1013i1.pptx/39 * Well-traveled water

40 IPR vs. DPR: Sometimes IPR = WTW* DPR Drought-resistant Local Lower energy Uses existing infrastructure Cost-effective WTP WRF mmwd1013i1.pptx/40 * Well-traveled water 2 miles


41 mmwd1013i1.pptx/41 What are our options for cost-effective treatment to meet these goals? a.k.a can we achieve the desired removals without reverse osmosis?
42 Step 1 Define Performance Parameters Parameter Microbial Virus (MS-2 bacteriophage) Protozoa (Cryptosporidium) Bacteria (Total Coliform) Removal Goal > 12-log > 10-log > 9-log mmwd1013i1.pptx/42 Chemical Trace Organic Compounds Estradiol Equivalency (EEQ) N-nitrosodimethylamine NDMA) < 1 ug/l < 5 ng/l < 10 ng/l


43 Define Preferred Combinations mmwd1013i1.pptx/43 Environmental Buffers (optional) Step 2
44 Step 3 Work Through the Excel Interface for Results DRAFT CA-style FAT for IPR mmwd1013i1.pptx/44

45 Key Takeaways: What the Future Holds Progress will be a function of Scarcity / Options Provider Interest Technology & Costs Public Acceptance Potable reuse is a game-changer for our industry Regs are being driven by projects and demand DPR drives a need for new monitoring technologies and a focus on response times mmwd1013i1.pptx/45 Applied research is paving the way for understanding treatment options, treatment goals, and operational guidance