Noise Level Compliance Report
|
|
|
- Lucinda Owen
- 5 years ago
- Views:
Transcription

1 Noise Level Compliance Report for the Lake Winds Energy Park Spring 2016 Noise Level Measurements Mason County, Michigan August 2016 Prepared for: Mason County Michigan Scottville, Michigan Prepared by: Hankard Environmental, Inc. Verona, Wisconsin
2 Contents Executive Summary Introduction Applicable Noise Regulation Noise Measurement Equipment Measurement Dates, Locations, and Procedures Measurement Dates Measurement Locations Measurement Procedures Turbine and Atmospheric Conditions Turbine Operations During Measurements Atmospheric Stability During Measurements Wind Direction During Measurements Representation of Loudest Conditions Noise Level Analysis Procedures Measurement and Analysis Results Analysis of Noise Levels Measured at Location Analysis of Noise Levels Measured at Location Analysis of Noise Levels Measured at Location Analysis of Noise Levels Measured at Location Conclusions Appendix A: Noise Measurement Equipment Calibration Records Appendix B: Turbine Operations During Measurements Appendix C: Calculation of Maximum Sound Level at Location 2 LWEP Spring 2016 Noise Level Compliance Analysis - August 2016 Page 1
3 Figures Figure 1-1: General Location of the LWEP... 8 Figure 1-2: LWEP Layout... 9 Figure 3-1: Typical Noise/Wind Measurement Setup Figure 4-1: Map of Measurement Location Figure 4-2: Map of Measurement Location Figure 4-3: Map of Measurement Location Figure 4-4: Map of Measurement Location Figure 4-5: Field Form from a Night When WTG Noise was Dominant Figure 4-6: Field Form from a Night When Ground Wind Noise was Dominant Figure 7-1: Location 5 Noise Level Versus Time, March 29-30, Figure 7-2: Location 5 Noise Levels Without non-wtg Events March 29-30, Figure 7-3: Location 5 One-Third Octave Band Spectra March 29-30, Figure 7-4: Location 5 Noise Levels Without non-wtg, May 23 rd, Figure 7-5: Location 5 One-Third Octave Band Spectra, May 23, Figure 7-6: Location 5 One-Third Octave Band Spectra, April 25 th, Figure 7-7: Location 5 One-Third Octave Band Spectra, May 24 th, Figure 7-8: Location 2 Noise Levels Versus Time, March 29-30, Figure 7-9: Location 2 Noise Levels Without Non-WTG Sources, March 29-30, Figure 7-10: Location 2 One-Third Octave Band Spectra, March 29-30, Figure 7-11: Location 2 Noise Levels Versus Time, March 31, Figure 7-12: Location 2 Noise Levels Without Non-WTG Sources, March 31, Figure 7-13: Location 2 One-Third Octave Band Spectra, March 31, Figure 7-14: Location 2 Results of 25 Hz Filter Analysis, March 31, Figure 7-15: Location 10 Noise Levels Versus Time, April 28, Figure 7-16: Location 10 One-Third Octave Band Spectra, April 28, Figure 7-17: Location 10 Results of 25 Hz Filter Analysis, April 28, Figure 7-18: Location 10 Noise Levels Versus Time, April 25, Figure 7-19: Location 10 One-Third Octave Band Spectra, April 25, Figure 7-20: Location 10 Results of 25 Hz Filter Analysis, April 25, Figure 7-21: Location 10 Noise Levels Versus Time, April 26, LWEP Spring 2016 Noise Level Compliance Analysis - August 2016 Page 2
4 Figure 7-22: Location 10 One-Third Octave Band Spectra, April 26, Figure 7-23: Location 9 Mainly WTG Frequency Spectra, April 28, Figure 7-24: Location 9 WTG and Wind Frequency Spectra, April 28, Figure 7-25: Location 9 Wind Dominated Frequency Spectra, April 28, Figure 7-26: Location 9 Noise Levels Versus Time, April 26, Figure 7-27: Location 9 One-Third Octave Band Spectra, April 26, Tables Table 4-1: Dates and Times of Noise Measurements Spring Table 4-2: Distance and Direction from Measurement Location to Nearest Turbines Table 5-1: Turbine Operations During Measurements Table 5-2: Observed Atmospheric Stability During Measurements Table 5-3: Location of Measurement with Respect to Wind Direction and Turbines Table 5-4: Summary of Measurements Representation of Loudest Conditions Table 7-1: Location 5 WTG Noise Levels March 29-30, 2016 (10-min Leq, dba) Table 7-2: Location 2 WTG Noise Levels March 29-30, 2016 (10-min Leq, dba) Table 7-3: Location 2 WTG Noise Levels March 31, 2016 (10-min Leq, dba) LWEP Spring 2016 Noise Level Compliance Analysis - August 2016 Page 3
5 Executive Summary Hankard Environmental conducted noise level measurements at the Lake Winds Energy Park (LWEP) in Mason County Michigan in the Spring of The measurements were conducted at the request of Mason County, and followed the procedures laid out in the April 2015 Mitigation Plan Sound Testing Protocol and the December 2015 Consent Judgement. The purpose of the measurements was to determine if noise emissions from the LWEP are in compliance with Section a of the Mason County Zoning Ordinance, which states that noise from a wind energy facility cannot exceed 45 dba the property line of an unpooled parcel on which there is an occupied building or dwelling. Measurements were conducted at four locations; two from previous measurement campaigns (Locations 2 and 5), and two new locations (Locations 9 and 10). Noise levels were measured during three different four-day surveys; one each in the months of March, April, and May The Mason County noise limit applies only to noise generated by the wind turbine generators (WTG). However, microphones placed outside measure all noise that is present in the environment, including that from the WTGs and that from non-wtg sources such as traffic, aircraft, the activities of the homeowners, dogs, birds/insects/amphibians, and wind blowing across the microphone and through nearby vegetation. The measured data was analyzed in accordance with the LWEP Mitigation Plan Sound Testing Protocol, applicable portions of ANSI S12.9 Part 3 and ANSI S12.18, as well using methods developed by Hankard Environmental. The results of the noise level measurements and data analysis for each location are described below. Note that, per the Consent Judgement, testing at Location 2 was conducted with the two closest turbines in Noise Reduced Operation Mode 1. For the purposes of this 2016 analysis, turbines operating in normal mode (NRO 0) were considered to be at full electrical power when their power output was 90% or more of full rated power (1,815 kw). Turbines operating in NRO 1 were considered to be operating at full electrical power when their power output was 80% or more of full rated power. Location 5 The noise level data collected during the early morning hours of May 23 rd are representative of loudest wind turbine conditions. The nearest turbine was operating at full electrical power, other nearby turbines were operating at or near full electrical power, the measurement location was downwind of the nearest turbines, and the atmosphere was stable and conducive to sound propagation. The loudest WTG-only 10-minute L eq was 44 dba. Adding to the validity of this data, multiple 10-minute data points were obtained during these conditions. Representative data was also collected at Location 5 on the night and morning of March 29 th 30 th. During one 10- minute period of maximum turbine operations the loudest WTG-only 10-minute L eq was 43.4 dba. Based on all of the data collected at Locations 5 in 2016, we conclude that noise levels due to LWEP wind turbine operations are in compliance with Mason County s 45 dba noise level limit. No additional testing is recommended at Location 5. LWEP Spring 2016 Noise Level Compliance Analysis - August 2016 Page 4
6 Location 2 Noise levels were measured on two occasions at Location 2, but neither represent loudest WTG conditions. On March 29 30, the nearest WTG operated at full electrical power for one 10-minute period, but at that time the three other nearest turbines were operating at about 50% of capacity, and the measurement location was upwind of the nearest turbine. On March 31 st the nearest turbine never achieved more than about 60% of capacity. The 2 nd, 3 rd and 4 th closest turbines did achieve full electrical power, but only sporadically and not necessarily at the same time. The loudest WTG-only noise level measured at Location 2 on March was 43.3 dba. On March 31 a level of 44.7 dba was determined using the strict procedures outlined in the Mitigation Plan Sound Testing Protocol, but our field observations and further review of the measured data show that the WTG-only noise level was, at most, 44 dba. While we did not find any WTG-only noise levels above about 44 dba at this location, we do not feel that we captured loudest WTG noise conditions. Based on all of the data we collected at Location 2, we cannot provide definitive conclusions regarding compliance with the Mason County noise level limit. We recommend continued testing at Location 2 in With regard to NRO operation, we recommend that WTG-6 and WTG-15 near Location 2 be left in NRO Mode 2 until the Spring 2017 testing. This is based on the measurement data collected on March 29, On this night atmospheric conditions were conducive to maximum sound propagation, but three out of the closest four turbines were not at full electrical power production. We measured a maximum WTG-only noise level of about 43.4 dba on this night. My calculations regarding how much louder the measured noise level would have been if all four of the nearest turbines were at full electrical power indicate that the full-production noise level could have been as high as 45.1 dba. Given this result, and the uncertainty of the calculation, there is the possibility of exceeding 45 dba if WTG-6 and WTG-15 are not placed into NRO 2. With regard to NRO operation during the Spring 2017 measurements, we recommend testing with WTG-6 and WTG-15 in either NRO Mode 1 or Mode 0. For the purposes of determining maximum noise levels, these modes are acoustically equivalent according to Vestas technical documentation. That is, when hub-height wind speeds are 7 m/s or greater, noise emissions are the same in Modes 0 and 1. When hub-height wind speeds are in the 4 to 7 m/s range, NRO Mode 1 noise levels are about 0.5 to 1.5 dba lower than Mode 0 noise levels. These turbines can be left in NRO Mode 1 or Mode 0 indefinitely if sufficient valid data is obtained at Location 2 in 2017, and the turbine-only sound level is determined to be less than 45 dba. If, however, insufficient or inconclusive data are obtained in 2017, these turbines should be returned to NRO Mode 2 either indefinitely, or until such time that additional testing at Location 2 demonstrates compliance with the 45 dba standard while WTG-6 and WTG-15 are in NRO Mode 0 or 1. Location 10 Noise levels were measured on two occasions at Location 10 when the nearest turbine was producing full electrical power. On April 28 th the nearest WTG operated at full electric power for two 10-minute periods, and during those times the three other nearest turbines were operating between 60 and 80% of full capacity. On April 25 th the nearest WTG operated at full electric power for one 10-minute period, and during that time the three other nearby turbines were operating at about 50% of full capacity. The loudest WTG-only noise level measured at Location 10 was 43 dba. LWEP Spring 2016 Noise Level Compliance Analysis - August 2016 Page 5
7 While we did not find any WTG-only noise levels above about 43 dba at this location, we do not feel that we necessarily captured loudest WTG noise conditions. Therefore, based on all of the data we collected at Location 10, we cannot provide definitive conclusions regarding compliance with the Mason County limit. We recommend continued testing at this location in Similarly, there is not enough valid data at Location 10 from the Spring 2016 measurements to recommend a propagation plan at this time. The need for a propagation plan should be reviewed after the Spring 2017 measurements, and should be based on the totality of the data measured at all sites in both 2016 and Location 9 Noise levels were measured on one occasion at Location 9 when the nearest turbine was producing full electrical power. On April 28 th the nearest WTG operated at full electric power for three 10-minute periods, and during those times the three other nearby turbines were operating at about 80% or greater. The loudest WTG-only noise level measured at Location 9 was between 43 and 44 dba. While we did not find any WTG-only noise levels above about 44 dba at this location, we do not feel that we necessarily captured loudest WTG noise conditions. Therefore, based on all of the data we collected at Location 9, we cannot provide definitive conclusions regarding compliance with the Mason County limit. We do not recommend additional measurements at Location 9. There is a relatively high amount of traffic here, some full power data has been acquired, and as described below we prefer to focus on fewer sites. We do recommend reviewing the data from Location 9 after the 2017 testing, applying anything that was learned from the 2017 measurements and data analysis, and re-assessing compliance at Location 9 at that time. For example, if testing at other location(s) with similar turbine geometry and similar predicted noise levels indicates compliance, it might be reasonable to conclude the same for Location 9. Similarly, there is not enough valid data at this location from the Spring 2016 measurements to recommend a propagation plan at this time. The need for a propagation plan should be reviewed after the Spring 2017 measurements, and should be based on the totality of the data measured at all locations in both 2016 and Spring 2017 Noise Level Testing Recommendations For the Spring 2017 measurements, the Consent Judgement mandates testing at Locations 1 and 6. As described above, we are recommending continued measurements at Locations 2 and 10. The Consent Judgement also mandates the selection of two, additional, measurement locations for We do not feel that this is in the best interest of this case, and recommend the Consent Judgement be amended to eliminate this requirement. We feel that testing at two sites on any given night is sufficient, having four sites to choose from is adequate, and Locations 1, 2, 6, and 10 provide a good representation of the LWEP as a whole. In general, we recommend measuring more data at fewer sites, versus less data at more sites. We also recommend that the turbines not be turned off unless and until field staff are confident that the turbine-only noise level being measured is approaching or exceeding 45 dba. This procedure was implemented by Hankard Environmental for the last two weeks of 2016 testing, and is designed to maximize the amount of turbine-on noise data collected. LWEP Spring 2016 Noise Level Compliance Analysis - August 2016 Page 6
8 1. Introduction The Lake Winds Energy Park (LWEP) is 100 megawatt utility grade wind energy system consisting of 56 Vestas V megawatt wind turbine generators located in Riverton and Summit Townships of Mason County, Michigan. The general location of the facility is shown in Figure 1-1, and the layout of the facility is shown in Figure 1-2. The LWEP was constructed in 2011 and 2012, and began commercial operation in November Noise emissions from the LWEP must meet the sound level limits of the Mason County Zoning Ordinance. Post-construction sound studies were completed by other acoustical consultants in 2013, 2014, Testing in 2015 confirmed the mitigation measures (Noise Reduced Operation (NRO) Mode 2) in place at four of the eight original testing locations were both necessary and sufficient to maintain compliance. Pursuant to the December 2015 Consent Judgement, turbines near one of the eight original locations (Location 7) will remain in NRO Mode 2 for the remainder of operations. After three rounds of testing at one of the locations (Location 5) there was still no viable data for the Planning Commission to form a conclusion. Appeals and court proceedings have arisen from the previous testing results. Through the terms of the December 2015 Consent Judgement between Mason County and Consumers Energy, Hankard Environmental, Inc. was selected by the Mason County Planning Commission as a new third party acoustical consultant. Hankard Environmental is a Wisconsinbased acoustical consulting firm with significant wind energy facility noise level measurement and analysis experience. The Commission requested that Hankard Environmental conduct a new post-construction sound survey per the terms of Consent Judgement and the Mitigation Plan Sound Testing Protocol (Appendix 2 to April 18, 2014 memorandum from Consumers Energy to Mason County, Revised April 2015). Hankard Environmental conducted testing at four locations near the LWEP in the Spring of Testing was conducted during three four-day surveys; one in each of the months of March, April, and May This report describes the results of the measurements, the results of the analysis of the data, and conclusions regarding what the measured data do and not show about LWEP compliance with the sound level limits of the Mason County Zoning Ordinance. Also described herein are the sound level limits themselves, measurement locations, equipment, and procedures, as well as the procedures used to analyze the data, turbine and atmospheric conditions during the measurements, the measurement results, and the quality of the data as it pertains to demonstrating compliance. LWEP Spring 2016 Noise Level Compliance Analysis - August 2016 Page 7

9 Figure 1-1: General Location of the LWEP LWEP Spring 2016 Noise Level Compliance Analysis - August 2016 Page 8


10 Figure 1-2: LWEP Layout LWEP Spring 2016 Noise Level Compliance Analysis - August 2016 Page 9
11 2. Applicable Noise Regulation Noise emissions from the LWEP must adhere to the sound level limits contained within the Mason County Zoning Ordinance, Section 17.70, subsection 17.a. The pertinent portion of this ordinance is provided below. 17. Noise a. Sound Level Limits. 1. The A-weighted equivalent sound level (LA eq ) measured at the property line of an unpooled (single) parcel (as defined in subsection 19 hereof) upon which there is an occupied building or dwelling shall not exceed 45 dba. If the unpooled parcel does not have an occupied principal building or dwelling on it, then the 45 dba sound limit may be exceeded at the property line; provided that when an occupied principal building or dwelling is built on such unpooled parcel after the special land use permit has been issued, the sound level shall not exceed 45 dba measured at the nearest wall of the occupied building or dwelling located on the unpooled parcel and in compliance with the minimum required front, side and rear yard setbacks then in effect within the zoning district in which the occupied building or dwelling is located. 2. On a pooled parcel, the ten-minute LA eq sound level measured at the wall of an occupied building nearest to the wind turbine or turbines shall not exceed 55 dba. 3. These sound level limits are to be evaluated using the A-weighted equivalent sound level (LA eq ) descriptor. The LA eq should be measured using a tenminute time interval. 4. The sound level limits listed above apply to the contribution from the wind energy system only and do not include contributions from background ambient sounds. 3. Noise Measurement Equipment All of the noise measurement equipment used on this project meet the Type 1 requirements of American National Standards Institute (ANSI) S (R2006) American National Standard Specification for Sound Level Meters. Noise levels were measured using Bruel and Kjaer Type 2250 sound level meters and associated pre-amplifiers, and ½ inch diameter free-field precision microphones (Type 4951 outdoor microphone/pre-amplifier). All measurement and field calibration equipment was certified by a traceable laboratory within the past year (calibration certificates can be found in Appendix A). In addition, field calibrations were conducted before and after each measurement. The drift in the measured noise level was minimal (-0.1 to +0.1 over the entire measurement survey). LWEP Spring 2016 Noise Level Compliance Analysis - August 2016 Page 10
12 The microphones were mounted on tripods, and positioned approximately 1.5 meters above the ground (per ANSI S12.9). The microphones were covered with hydrophobically treated, seveninch diameter, 80 pores per inch density windscreens (ACO Pacific Model WS7-80T). All electronic equipment was contained in weatherproof cases and was powered by batteries. Ground wind speed and direction were measured using Vaisala WINDCAP Ultrasonic Wind Sensor mounted on a tripod approximately 2 meters above the ground (per ANSI S12.18), and located within approximately 3 meters of the microphone. Figure 3-1 shows a picture of a typical noise/wind measurement configuration. Sound level meters were time-synchronized to the LWEP control system to within approximately 2 seconds to allow for the integration of noise and ground wind data with WTG operations data. The sound level meters were configured to continuously measure and record 10-second averages of the following metrics: overall L eq, L 10, L 50, and L 90, as well as one-third octave band L eq levels (6.3 Hz to 10 khz). The meters also logged ground wind speed and direction every 10 seconds. Figure 3-1: Typical Noise/Wind Measurement Setup LWEP Spring 2016 Noise Level Compliance Analysis - August 2016 Page 11
13 4. Measurement Dates, Locations, and Procedures 4.1 Measurement Dates Noise levels were measured during three different four-day surveys between March and May of After contracting was complete in mid-march, the weather forecast for the area was monitored on a daily basis. The first survey was scheduled as soon as sufficient nighttime wind speeds were forecast. Once on-site, measurements were conducted each night unless the wind turbines were not operating at sufficient capacity and not forecast to do so, or snow or rain was occurring. We generally stayed on-site for four to five nights, and only left when the forecast called for prolonged periods (days) of insufficient wind speeds or inclement weather. This process was repeated until three surveys had been completed. Table 4-1 lists the dates and times when measurements were conducted. Table 4-1: Dates and Times of Noise Measurements Spring 2016 Date (2016) Start Time End Time March :00 pm 5:00 am March 31 7:30 pm 12:00 am April 24 9:10 pm 9:30 pm April 25 4:40 pm 6:00 pm April 26 3:00 pm 6:00 pm April 28 1:00 am 4:40 am May :00 pm 5:00 am May 24 5:40 pm 7:00 pm 4.2 Measurement Locations Noise levels were measured at four locations. Figures 4-1 through 4-4 show a map of each specific measurement location. As mandated by the Mitigation Plan Sound Testing Protocol and the Consent Judgement, measurements were conducted at Locations 2 and 5. As also mandated by these documents, measurements were conducted at two new locations selected by Hankard Environmental. These are denoted as Locations 9 and 10 herein. These two new locations were selected as follows: 1. The process started by reviewing the list of predicted noise levels contained in Appendix C (Table C-1) of the report entitled Acoustic Study of the Lake Winds Energy Park (prepared by Tech Environmental, Revised June 2011). We focused on the locations with the highest predicted noise levels (44.5 dba or greater). 2. From this list of approximately 20 locations we identified locations with the closest turbines situated to the west/southwest or east directions. This is because (a) historical wind data show these to be the primary wind directions in the spring in this area, and (b) to compliment the fact that the two mandatory locations have nearest turbines in the LWEP Spring 2016 Noise Level Compliance Analysis - August 2016 Page 12
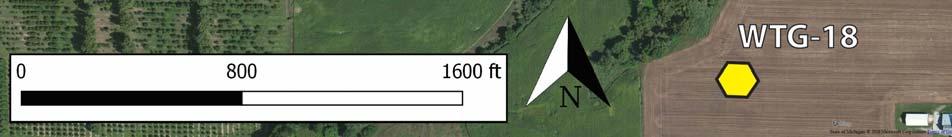
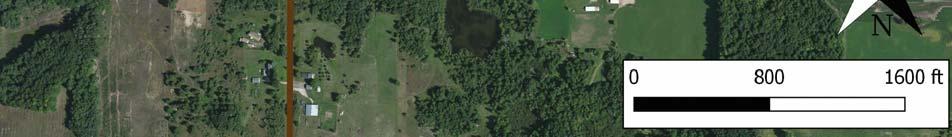
14 north and south directions (thus giving field personnel options on any given night depending on wind direction). 3. We sought locations that had less vegetation located nearby (primarily large trees). 4. Finally, we required permission from the landowner. Table 4-2 lists, for each measurement location, the distance and direction to the closest four WTGs (the direction listed is that which places the measurement location downwind of each turbine). Table 4-2: Distance and Direction from Measurement Location to Nearest Turbines Location Nearest Distance (feet) Nearest Direction (degrees) 2 nd Distance (feet) 2 nd Direction (degrees) 3 rd Distance (feet) 3 rd Direction (degrees) 4 th Distance (feet) 2 WTG-6 WTG-15 WTG-4 WTG-18 4 th Direction (degrees) 1, , , , WTG-25 WTG-32 WTG-35 WTG-26 1, , , , WTG-18 WTG-16 WTG-15 WTG-19 1, , , , WTG-47 WTG-46 WTG-49 WTG-50 1, , , , LWEP Spring 2016 Noise Level Compliance Analysis - August 2016 Page 13


15 Figure 4-1: Map of Measurement Location 2 LWEP Spring 2016 Noise Level Compliance Analysis - August 2016 Page 14


16 Figure 4-2: Map of Measurement Location 5 LWEP Spring 2016 Noise Level Compliance Analysis - August 2016 Page 15


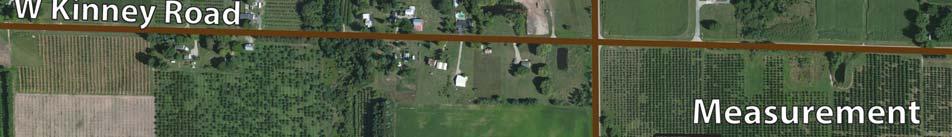


17 Figure 4-3: Map of Measurement Location 9 LWEP Spring 2016 Noise Level Compliance Analysis - August 2016 Page 16


18 Figure 4-4: Map of Measurement Location 10 LWEP Spring 2016 Noise Level Compliance Analysis - August 2016 Page 17
19 4.3 Measurement Procedures Noise levels were measured at two locations on any given night, with one exception when on one night only one location had a chance of producing valid data due to forecasted turbine operations and wind direction. The selection of which locations to measure on any given night was made by Hankard Environmental on the day of the measurements and was based primarily on wind direction. In general, the loudest noise levels will be measured when the measurement location is situated downwind of the turbines. Once measurement locations for the day were established, wind conditions were monitored and field staff deployed to the locations as soon as turbine operations exceeded approximately 50% of capacity. The measurement equipment was set up first, which generally takes about 15 minutes, and left to run continuously as described above. Next, field staff began noting the audibility of turbine noise, and the times when non-wtg noise sources were present, including but not limited to traffic, wind blowing through nearby vegetation, insects/birds/frogs, planes, dogs, etc. Based on our experience with previous wind turbine noise measurement projects, the type of notes that will prove most useful in the subsequent analysis of the data depends on conditions. On days/nights when ground winds are calm (less than about 1 to 2 m/s) and non-wtg noise sources are present infrequently, one only needs to note the approximate times when non-wtg noise was audible. After a review of the resulting noise level time history and frequency spectra to remove any residual non-wtg noise, one is left with a dataset consisting entirely of WTG-only noise. An example field measurement form from such a night is shown in Figure 4-5. The more challenging situation is a night when ground wind speeds are moderate (about 2 to 5 m/s) on a continuous basis, and/or there is a consistent amount of non-wtg noise present (particularly traffic). In this case the objective of the field notes is to identify those minute(s) when WTG noise was most prominent. For example, minutes would be noted when there was a lull in ground wind, or the minutes when no traffic was audible. Minutes when wind or traffic was particularly audible were also noted. In the subsequent analysis of the data, frequency spectra from these various minutes are compared to determine what is and is not related to WTG operations. An example field form from such a night is shown in Figure 4-6. The measurement and analysis procedures followed the applicable portions of ANSI S12.9 Part 3 (2013) Quantities and Procedures for Description and Measurement of Environmental Sound: Short-Term Measurements With an Observer Present, and ANSI S (R2009) Outdoor Measurement of Sound Pressure Level. LWEP Spring 2016 Noise Level Compliance Analysis - August 2016 Page 18


20 Figure 4-5: Field Form from a Night When WTG Noise was Dominant LWEP Spring 2016 Noise Level Compliance Analysis - August 2016 Page 19


21 Figure 4-6: Field Form from a Night When Ground Wind Noise was Dominant LWEP Spring 2016 Noise Level Compliance Analysis - August 2016 Page 20
22 5. Turbine and Atmospheric Conditions The goal of this study is to determine if noise levels from the WTGs are in compliance with the Mason County Zoning Ordinance, which states that noise levels shall not exceed 45 dba at an unpooled parcel. If a relatively small number of noise samples are going to be used to demonstrate compliance for all time, the measurements must be conducted during conditions that produce the loudest WTG noise levels at residences. Loudest conditions are present when (a) nearby WTG operations are at or near capacity, and (b) the atmosphere is stable, and (c) the measurement location is downwind of nearby turbines. The following sections describe the extent to which each of these conditions was present during the measurements. Section 5.4 summarizes the conditions, and present the author s determination of which measurements conducted as part of this Spring 2016 survey represent loudest conditions, and which provide useful information about turbine noise at a given location albeit not loudest conditions. 5.1 Turbine Operations During Measurements The Vestas V turbines reach their maximum acoustical output when hub-height wind speeds reach approximately 10 meters per second (m/s). Winds speeds in excess of this create more electrical power, but do not create additional acoustic output because the turbine has reached its maximum rotational speed. For the purposes of this analysis, maximum turbine operation is defined by the Mitigation Plan Sound Testing Protocol, which states: Full electrical power shall be defined as the nearest mitigated turbine(s) to a test location producing at least 80% of rated electric power in the applicable Mode 2, or 90% for the nearest turbine operating in NRO Mode 0 (test site 5 only). If testing under full electrical power, and suitable weather/ambientsound conditions, is not achieved in six nights, the testing shall be extended. Table 5-1 lists, for each measurement day and for each location, the number of 10-minute intervals during which there was full electrical power production at the nearest turbine according to the above definition. Also listed are the exact time intervals when this occurred. Plots of power production for the four turbines closest to each measurement location are provided in Appendix B. After the first week of testing in March 2016 we realized that shutting down the turbines every other hour, as outlined in the Mitigation Plan Sound Testing Protocol, is only necessary if during any given measurement it is the opinion of field personnel that the WTG-only noise level is approaching or greater than the 45 dba limit. This determination comes from our intent watching of the instantaneous noise level (L eq, Fast, dba) and listening to the acoustic environment. Until the WTG-only noise level regularly exceeds about 44 dba it is better to keep the turbines running. This maximizes the amount of time spent measuring turbine on conditions, which maximizes the chance that we are capturing loudest turbine conditions. LWEP Spring 2016 Noise Level Compliance Analysis - August 2016 Page 21
23 Table 5-1: Turbine Operations During Measurements Date March Location Number of 10-minute Intervals of Full Electric Power at Nearest Turbine Times of Full Electric Power for Nearest Turbine : :20, 00:30, 00:50 March April April :00 April 26 April 28 May May :20, 4:00, 4: :30, 4: :50-01: Atmospheric Stability During Measurements In general, during the daytime the atmosphere is unstable as the sun heats the air, heated masses of air rise and shift, and there is subsequently a lot of atmospheric mixing. These conditions are not favorable for sound propagation and therefore measurements taken under such conditions should not be considered representative of loudest conditions. Mixing generally decreases at night after sunset and there is a greater chance for both wind gradients and temperature inversions to set up. A wind gradient is where ground wind speeds are low (<~3 m/s) while wind speeds at hub-height are relatively high (>~8 m/s). Under these conditions, sound waves traveling away from and downwind of a source are bent toward the ground and noise levels are greater than in the upwind direction. Temperature inversions, the condition where temperature increases with height up to a point, bend sound waves back toward the ground in all directions from the source. Noise levels during a temperature inversion are, as a result, louder than what they would be otherwise. Atmospheric stability was not measured, per se, as part of this study. Table 5-2 lists the stability of the atmosphere during each day surveyed based on field observations. For example, on two nights, turbine operations were at or near maximum (high hub-height wind speeds) and ground winds were very low, indicating the presence of a wind gradient. On days when conditions forced us to measure in the late afternoon, hub-heights winds were low to moderate, as were ground winds, thus indicating no wind gradient. LWEP Spring 2016 Noise Level Compliance Analysis - August 2016 Page 22
24 Table 5-2: Observed Atmospheric Stability During Measurements Date (2016) Stability Notes March Stable Moderate hub-height wind speeds, very low ground wind speeds March 31 Unstable Moderate hub-height wind speeds, moderate ground wind speeds April 24 Unstable Moderate hub-height wind speeds, moderate ground wind speeds April 25 Unstable Windy (storm moving in), late afternoon April 26 Unstable Sun still strong, late afternoon April 28 Unstable Moderate hub-height wind speeds, moderate ground wind speeds May Stable Full turbine operations, very low ground wind speeds May 24 Unstable Windy, sun still strong, late afternoon 5.3 Wind Direction During Measurements In general, noise levels are louder downwind of a source versus upwind or at some intermediate angle. This is not straightforward in the case of wind turbine farms due to the fact that the noise source (turbines) is distributed and located in many different directions from any given measurement location. Wind direction is less important for those turbines located within approximately 2,000 feet, because WTG noise emissions are nearly identical upwind and downwind of the turbine (somewhat lower to the sides). Wind direction becomes more important for more middle-distance turbines (2,000 to 5,000 feet), as atmospheric conditions now play a greater role in how much of the emitted sound energy reaches more distant locations. Turbines located more than 5,000 feet of residences where the closest turbines are in the 1,500 foot-range do not significantly affect the total measured level, as their contribution is more than 10 db less than that from the closest turbines. Table 5-3 lists the dates on which measurements were conducted at each location, the prevailing wind direction during each measurement, and which locations were downwind of which turbines. 5.4 Representation of Loudest Conditions Table 5-4 summarizes, for each measurement day and each location, the occurrence of full operations for at least one 10-minute interval, the observed presence of a stable atmosphere, and if the wind direction was such that the measurement location was downwind of the nearest turbine(s). Also shown is the author s opinion as to whether or not the measured noise levels are representative of the loudest condition that might occur at each location. The data most representative of loudest conditions is that obtained on May 23, 2016 at Location 5. Representative data was also obtained at Location 5 on March 29, Thus, as described in Section 8, below, definitive conclusions can be reached about WTG noise levels at Location 5. At Location 2 there was only one 10-minute period of maximum operations at the nearest turbine, but at the time the atmosphere was not stable and other nearby turbines were operating at low power. At Locations 9 and 10, turbine power production was maximum on one night. However, on this night the nearest turbines were located at a crosswind direction, and the atmosphere was not stable. LWEP Spring 2016 Noise Level Compliance Analysis - August 2016 Page 23
25 Date Table 5-3: Location of Measurement with Respect to Wind Direction and Turbines Location Wind Direction (compass) Nearest Orientation (relative) 2 nd Orientation (relative) 3 rd Orientation (relative) 4 th Orientation (relative) March S Upwind Downwind Upwind Crosswind March S Downwind Downwind Downwind Crosswind March 31 2 N Downwind Upwind Downwind Crosswind April 24 9 ESE Downwind Upwind Upwind Crosswind April E Upwind Downwind Crosswind Crosswind April 25 5 S Downwind Downwind Downwind Crosswind April S Crosswind Crosswind Downwind Crosswind April 26 9 NNE Upwind Crosswind Upwind Upwind April NE Crosswind Downwind Crosswind Upwind April 28 9 S Crosswind Crosswind Crosswind Downwind April S Crosswind Crosswind Downwind Crosswind May S Downwind Downwind Downwind Crosswind May S Crosswind Crosswind Downwind Crosswind May 24 5 SSW Downwind Downwind Downwind Crosswind May S Crosswind Crosswind Downwind Crosswind Date Table 5-4: Summary of Measurements Representation of Loudest Conditions Location Wind Direction (from) Full Turbine Operation Stable Atmosphere Loudest Wind Direction Representative of Loudest Condition? March S YES YES No YES - limited March S YES YES YES YES March 31 2 N No No YES No April 24 9 ESE No No No No April E No No YES No April 25 5 S YES No YES No April S YES No No No April 26 9 NNE No No No No April NE No No No No April 28 9 S YES No No No April S YES No No No May S YES YES YES YES May S No YES No No May 24 5 SSW No No YES No May S No No No No LWEP Spring 2016 Noise Level Compliance Analysis - August 2016 Page 24
26 6. Noise Level Analysis Procedures As described in Section 2, the noise level limit at the property line of an un-pooled parcel upon which there is an occupied building or dwelling is 45 dba. However, this applies to WTG noise only, and the microphones placed at the measurement locations measure noise from the WTGs, as well as that from traffic, planes, birds/insects/amphibians, the activities of residents, and wind blowing across the microphone and through vegetation. The measurement data needs to be analyzed in order to separate WTG noise from non-wtg noise. The data analysis process employed is that outlined in the LWEP Mitigation Plan Sound Testing Protocol, follows applicable portions of ANSI S12.9 Part 3, and includes techniques developed by Hankard Environmental based on our in-depth experience with other wind turbine noise projects. 1. First, a couple of remarks regarding how Hankard Environmental believes a wind turbine noise compliance analysis should be conducted: a. We believe in analyzing all of the data we measure, regardless of turbine operations, wind direction, ground wind speed, time of day, etc. We can learn something from any and all measurements, and can make a better determination of each 10-minute sample s validity to the LWEP compliance process after reviewing all of the data. b. During the first week of measurements in March 2016 we implemented the turbine-on / turbine-off measurement procedure that had become the norm on LWEP studies. As such, the data from these measurements was analyzed in accordance with the Mitigation Plan Sound Testing Protocol. c. Starting with the April measurements and continuing through the May measurements, the turbines were not turned off unless Hankard Environmental field staff felt that WTG-only noise levels were consistently above 44 dba. This maximizes the amount of turbine-on data we collect. Turbine-off noise levels are used to determine background noise levels, primarily from wind, and are only needed if the total level exceeds 45 dba. d. Thus, after analyzing all of the data according to the Mitigation Plan, the resulting 10-minute L eq levels contain some background noise for the April and May 2016 data. At this point, if background noise from wind or traffic was consistent, the data likely still includes some non-wtg noise. To minimize this, Hankard Environmental applies additional data analysis and reduction. The result is an L eq noise level attributed primarily to wind turbine operations, and absolutely does not exceed 45 dba (or we would have shut down the turbines to determine background levels). e. Based on our experience, which consists of hundreds of hours spent in rural environments listening to wind turbine noise and background noise, as well as thousands of hours spent analyzing turbine-noise-wind datasets, we believe that the key to most closely determining WTG-only noise level lies in the review of the LWEP Spring 2016 Noise Level Compliance Analysis - August 2016 Page 25
27 one-third octave band frequency spectra of both 10-second and 10-minute L eq samples. When wind turbines are operating at their maximum acoustic output the noise level, on a 10-minute L eq basis, is relativley consistent, and has a very distinct spectral shape in the absence of background noise. We seek out this WTG-only spectral shape in the data and eliminate those 10-second samples that exhibit clear signs of being significantly influenced by non-wtg sources. f. On this project, this primarily applies to separating noise from wind blowing across the microphone and through vegetation. As described in Section 4.3, above, we find that the analysis required is different for measurements conducted when the ground winds are very low (less than 2 m/s), versus when they are moderate 2 to 5 m/s). The low-wind analysis requires primarily the elimination of non-wtg noise through the review of field notes and noise level versus time plots (overall, A-weighted L eq ). g. We separate WTG and wind noise using both a primary method and a secondary method. The primary method generally follows the Mitigation Plan Sound Testing Protocol and ANSI S12.9, as it relies on field technicians observations and notes. i. The primary method is to plot the one-third octave band frequency spectra of those one-minute periods when field staff identified turbines as the primary source of audible noise. If the resulting spectra have no clear signs of significant wind influence (explained below), the resulting overall level is reported as the WTG noise level. ii. The secondary method consists of sorting the measured turbine-on 10- second L eq samples according to their 25 Hz one-third octave band level (dba). The 25 Hz level correlates with the amount of pseudo noise that is being generated by wind passing over the microphone (despite the 7 diameter windscreen). After sorting, the samples are grouped into 5 db bins (25 Hz band level of 50 to 55 db, 55 to 60 db, etc.) and the energyaverage one-third octave band spectrum for each bin is plotted. The spectra with lower overall levels will exhibit a WTG-only spectral shape (unless ground winds are consistently too strong), and the higher level spectra will exhibit a wind influenced spectral shape. 2. The first step in the Mitigation Plan and ANSI S12.9 data analysis method is to create and review noise level versus time plots for each measurement survey at each location. Noise levels are measured in 10-second L eq samples, but ultimately calculate a 10-minute L eq. 10-second samples during which non-wtg noise was noted by field technicians is removed. This mainly applies to noise from traffic, planes, dogs, etc. ANSI S12.9 allows for the elimination of up to ½ of the data points in any given interval (10 minutes in this case). 3. In addition to eliminating specific times when field technicians noted the presence of non- WTG noise, Hankard Environmental reviews the frequency spectrum of each 10-second sample remaining in the dataset. We further eliminate 10-second samples that have an LWEP Spring 2016 Noise Level Compliance Analysis - August 2016 Page 26
28 erratic spectral shape, often due to sources that the technicians may not have noticed. WTG-only noise level has a distinct spectral shape, and no 10-second samples with any sign of WTG noise are eliminated in this manner. 4. Per ANSI S12.9, environmental noise level measurements should not be taken when ground wind speeds exceed 5 m/s, and thus data acquired under these conditions was discarded. 5. High-frequency bird/insect/amphibian noise, when present, was eliminated from all turbine-on and turbine-off 10-minute L eq samples. Per ANSI S12.9, the overall A-weighted L eq was re-calculated using only the 31.5 through 1,000 Hz octave band noise levels. 6. For the March 2016 measurements only, during which the turbines were turned off every other one hour to allow for the measurement of background noise levels, the turbine-on 10-minute L eq is calculated for each of the six 10-minute period in the hour. For turbineoff measurements, the 10-minute L eq is not calculated for the first 40 to 50 minutes of the hour, because the cooling fans on the turbines do not turn off and control the background noise level accept for the last one or two 10-minute samples in the hour. The lowest of these measured 10-minute samples was then carried forth in the analysis. The WTG-only noise level results from this analysis. 7. For the April and May 2016 measurements, for which field staff determined that WTGonly noise levels were less than 45 dba, the above-described additional analyses were conducted instead of Item 6. LWEP Spring 2016 Noise Level Compliance Analysis - August 2016 Page 27
29 7. Measurement and Analysis Results The following sub-sections describe the results of the noise level measurements and data analysis for each location. Conclusions from the results are provided in Section 8.0, along with statements of data validity and compliance with Mason County standards. The descriptions in this section reference plots of nearby WTG operations during the measurements, and these can be found in Appendix B. Also, the data are described for Location 5 first, as this is the location where the most representative data was acquired. Similarly, for each location, the most representative measurement data are described first, followed by data from measurements when turbine operations were low or atmospheric conditions were not ideal for sound propagation. 7.1 Analysis of Noise Levels Measured at Location 5 March 29 th 30 th, 2016 Location 5 Measurements were conducted between 10:00 pm on March 29 th through 5:00 am on the 30 th. From the power production data it can be seen that the closest turbine (WTG-25) was operating at or very near full electrical power during the 10-minute periods of from 0:20 to 0:50. The next three closest turbines were operating at approximately 75% to 80% of capacity. The wind direction during this time period was out of the north, placing the residence upwind of all the nearest turbines. Ground wind speeds were very light during the measurement (1 to 3 m/s). Figure 7-1 shows the noise level versus time for the entire measurement period. Shown is the 10- second L eq (dba), the 10-minute L eq (dba), the 10-second average ground wind speed (meters per second, m/s), and the two-minute average ground wind speed (m/s). The presence of noise from passing vehicles is obvious. Figure 7-2 shows the same information, with the noise levels during non-wtg events removed based on field notes, the noise level versus time signature, and a review of the spectral content of the signal at different times. Table 7-1 lists the loudest WTG-on 10-minute noise level for each of the four turbine-on hours, as well as the lowest 10-minute turbine-off noise levels measured before and after each turbine-on hour, and the average of before and after turbine-off levels. Also shown is the 1.5 db uncertainty level from ANSI S12.9 Part 3, and the resulting WTG-only noise level. The highest WTG-only noise level is 43.4 dba. This level agrees with field observations. Figure 7-3 shows the one-third octave band frequency spectra for the 10-minute periods of turbine-on and turbine-off data from Table 7-1. The turbine-on spectra show the characteristic shape of WTG-only noise levels. Specifically, low frequency levels below about 60 db, a peak in the mid-band levels (in this case 315 Hz), and a steady drop off in levels at frequencies higher than the mid-band peak. LWEP Spring 2016 Noise Level Compliance Analysis - August 2016 Page 28


30 Figure 7-1: Location 5 Noise Level Versus Time, March 29-30, 2016 LWEP Spring 2016 Noise Level Compliance Analysis - August 2016 Page 29
31 12 Ground Wind Speed (m/s, 10 second average and 2 minute average) Time (hh:mm) Noise Level (10 Sec) Noise Level (10 Min) Ground Wind Noise Level (Leq, dba) Figure 7-2: Location 5 Noise Levels Without non-wtg Events March 29-30, 2016 LWEP Spring 2016 Noise Level Compliance Analysis - August 2016 Page 30