Watt About Energy in the Northwest
|
|
|
- Gerald Reynolds
- 5 years ago
- Views:
Transcription
1 Watt About Energy in the Northwest WSU Whatcom County Carbon Masters Course Nancy Hirsh NW Energy Coalition November 3, 2011 nwenergy.org
2 Turn of the Century Extraction economy Timber Wheat Fish Minerals Small dams - produce electricity in 1880 s Private and municipal providers
3 Commodity vs. Essential Service Commodity - open to price competition, take it or leave it VS. Essential service - regulated with obligation to serve Natural monopoly - elimination of duplication of poles and wires State regulation , Public Utility Districts and Co-ops 1930
4 1930 s Key to Electricity History Congress declared that: Electricity is an essential service Sell power at cost with an opportunity to earn a profit Natural monopoly in exchange for an obligation to serve State regulators must set just and reasonable rates Build out of the Columbia River System

5
6 Bonneville Power Administration BPA markets 45% of region s electric power from 31 federal hydroprojects and one nuclear plant BPA power sales about 80% from hydro Has 136 customers - public utilities, DSIs, other federal agencies, private utilities BPA owns and operates 75% of the NW s high voltage electrical transmission system. The system includes more than 15,000 miles of transmission line and 285 substations.
7 Thermal Program Hydro power served all NW power needs into the 1970s Thermal generation seen as the future for meeting load Private and public utilities started fossil and nuclear construction BPA agreed to buy and market the output then bill its customers This deal allowed WPPSS to go forward - largest public bond default in US history
8 Investor-Owned Utilities Serving WA Puget Sound Energy - Electric & Gas Avista Utilities - Electric & Gas PacifiCorp (Pacific Power) - Electric Cascade Natural Gas - Gas Northwest Natural - Gas
9 Consumer Owned Utilities Municipal - 10 cities Department of city government - City Council is governing board Tacoma is different - utility governing board Public Utility Districts - 28 PUDs Electric, water, wastewater, and telecom 23 PUDs provide electricity to 815,000 customers Locally elected Commissioners Mostly within County boundaries but not all
10 Consumer Owned cont. Cooperatives and Mutuals 20 in the state Serve 280,000 customers Rates about the same as state average But bills are higher 8 customers per mile of line vs. 41 customers per mile of line as the state average Costs to serve higher
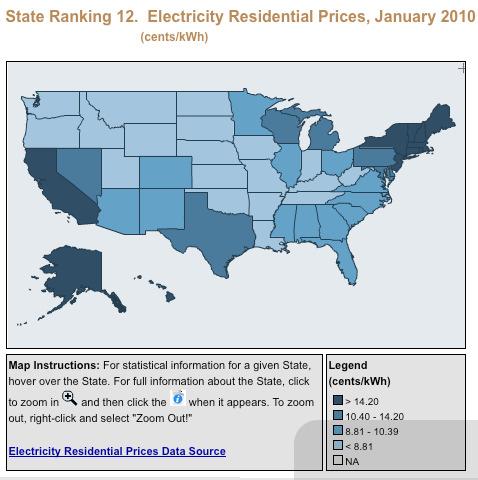
11 2009 Washington State Electric Utility Fuel Mix Electricity Sales to Washington Customers by Fuel Source Reported to utility customers in 2009, Produced by Washington Department of Commerce
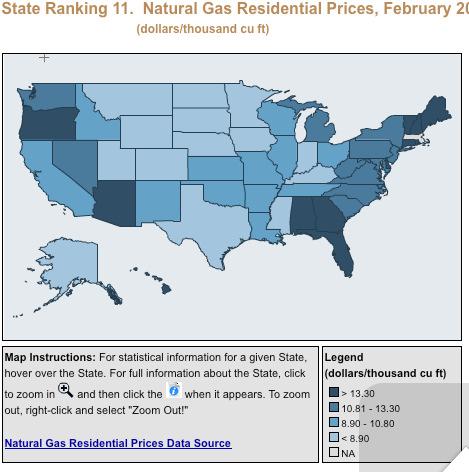
12 Home Heating Fuel Electricity WA = 53% US = 33% Natural Gas WA = 33% US = 51% Fuel Oil WA = 6% US = 9% Comparison
13
14
15
16 Generating Resources Hydropower Storage, Run of River Nuclear Fossil Coal, Natural Gas Renewables Wind, Solar, Geothermal, Biomass, Ocean Efficiency, CHP, Load Management

17 Lower Granite Dam
18 Fossil Fuels 9 coal plants - Serving the NW WA, OR, MT, NV, WY Considered a low cost fuel Rail and mine mouth Carbon constraints eminent 48% of US electricity - 17% of WA 26 natural gas fired plants all over the region Gas turbine technology advance energy crisis spikes prices 21% of US electricity - 13% of WA
19 Natural Gas Canada supplies most of WA and NW natural gas Northwest Pipeline Corp. supplies western WA and OR, Gas Transmission Northwest supplies the eastern part of both states Residential sector leads natural gas consumption - then industrial and electric power generation Roughly one-third of households use natural gas for home heating

20
21 Renewable Energy Technology Wind - fastest growing in US and NW Bigger turbines, off-shore, slower wind speeds, small scale Intermittent Solar - fastest growing worldwide Photovoltaics, concentrating solar thermal, hot water, passive Expensive but dropping in cost Geothermal - 24/7 resource hot water, hot rocks low and high temperature
22 Renewables Cont. Biomass Combustion Gasification Liquid fuels Ocean Energy Wave Pressure Tidal Current

23 Energy Efficiency Time magazine calls energy efficiency "Miracle Juice" Helps stabilize prices and lower energy bills Generates good, local jobs Boosts the bottom line for businesses and utilities Makes our built and natural environments healthier and more comfortable Frees up electric grid and pipeline capacity
24 Load Management Customer side of the meter Direct load control Price signal notification Demand response - paid to shut down Time of Use & Block Rates Peak prices Inclining block rates - use more, pay more Seasonal rates
25 Levelized Lifecycle Cost (2006$/MWh) $300 $250 $200 $150 $100 $50 $0 Assumptions : Energy Efficiency Energy Efficiency is Still the Cheapest Option Emission (CO2) cost Transmission & Losses System Integration Geothermal Combined Cycle Col. Basin Wind Efficiency Cost = Average Cost of All Conservation in Draft 6 th Power Plan Under $100 MWh Transmission cost & losses to point of LSE wholesale delivery 2020 service - no federal investment or production tax credits Baseload operation (CC - 85%CF, Nuclear 87.5% CF, SCPC 85%) Medium NG and coal price forecast (6 th Plan draft) AB Wind Advanced Nuclear Supercritical Coal (No CSS) 6 th Plan draft mean value CO2 cost (escalating, $8 in 2012 to $47 in 2029). IGCC (No CSS) Reciprocating Engine Wood Residue (No CHP) MT Wind WY Wind CSP Parabolic Trough Utility Photovoltaic
26 Sixth Plan Resource Portfolio* Cumulative Resource (Average Megawatts) NG Single Cycle Demand Response Simple- Cycle Gas Combined- Cycle Gas Renewables Efficiency *Expected Value Build Out. Actual build out schedule depends on future conditions 26

27 Bright Future NW Energy Coalition NW Energy Coalition