Implementation. MODULE 2 Understanding Where Policies Apply DRINKING WATER SOURCE PROTECTION
|
|
|
- Jeffrey Jenkins
- 5 years ago
- Views:
Transcription


1 Implementation Resource Guide MODULE 2 Understanding Where Policies Apply DRINKING WATER SOURCE PROTECTION


2 Implementation Resource Guides I M P L E M E N TAT I O N RESOURCE GUIDE A Compendium of Eight Modules Look for all eight modules in our Drinking Water Source Protection series. You can find them at Implementation Resource Guide A Compendium of Eight Modules D R I N K I N G W AT E R S O U R C E P R O T E C T I O N M OD UL E 1 I M P L E M E N TAT I O N RESOURCE GUIDE MODULE 1 Establishing a Risk Management Office D R I N K I N G W AT E R S O U R C E P R O T E C T I O N M OD UL E 5 I M P L E M E N TAT I O N RESOURCE GUIDE MODULE 5 Risk Management Plans D R I N K I N G W AT E R S O U R C E P R O T E C T I O N M ODU LE 2 I M P L E M E N TAT I O N RESOURCE GUIDE MODULE 2 Understanding Where Policies Apply D R I N K I N G W AT E R S O U R C E P R O T E C T I O N M ODU LE 6 I M P L E M E N TAT I O N RESOURCE GUIDE MODULE 6 Prohibition D R I N K I N G W AT E R S O U R C E P R O T E C T I O N D R I N K I N G W AT E R S O U R C E P R O T E C T I O N MO DUL E 3 I M P L E M E N TAT I O N RESOURCE GUIDE MODULE 3 Land Use Planning D R I N K I N G W AT E R S O U R C E P R O T E C T I O N MO DUL E 7 I M P L E M E N TAT I O N RESOURCE GUIDE MODULE 7 Non-Regulatory Policies (Education and Outreach, Incentives, and Section 26, Paragraph 1 Policies) D R I N K I N G W AT E R S O U R C E P R O T E C T I O N MO DUL E 4 I M P L E M E N TAT I O N RESOURCE GUIDE MODULE 4 Annual Reporting & Information Management D R I N K I N G W AT E R S O U R C E P R O T E C T I O N MO DUL E 8 I M P L E M E N TAT I O N RESOURCE GUIDE MODULE 8 Other Obligations D R I N K I N G W AT E R S O U R C E P R O T E C T I O N
3 DRINKING WATER SOURCE PROTECTION Module 2: Understanding Where Policies Apply Implementation Resource Guide 06/05/2014 Note to Reader: This document is one of a series developed by staff at conservation authorities and Conservation Ontario in support of source protection plan implementation. These documents cover a variety of tools related to plan implementation, but not all will apply in your municipality. Consult your local source protection plan to determine which policies are applicable in your municipality. This document has not been reviewed by legal counsel and is not presented as legal advice. Implementation Guide: Module 2 Understanding Where Policies Apply Page 3 of 89
4 TABLE OF CONTENTS A. Purpose of This Module... 8 B. The Need for a Threats Verification... 8 C. Data Management... 8 D. Entering Property to Verify Threats... 9 E. Useful Supporting Documents... 9 i. Assessment Reports... 9 ii. Source Protection Plans iii. Provincial Tables of Drinking Water Threats iv. Provincial Tables of Circumstances v. Mapping Database F. Some Terms You Need to Know i. Technical Rules ii. The Director G. Vulnerable Areas and Vulnerability Scoring i. Wellhead Protection Areas Vulnerability Scoring for Wellhead Protection Areas Table 1: Example Relationship between Vulnerability and Vulnerability Score Table 2: Vulnerability Score Required for a Drinking Water Threat to Be Significant in a WHPA ii. Intake Protection Zones Vulnerability Scoring for Intake Protection Zones iii. Highly Vulnerable Aquifers iv. Significant Groundwater Recharge Areas H. Threats I. Approaches for Identifying Significant Drinking Water Threats i. Threats Based Approach Using the Provincial Tables to Determine Threats Table 10: Sample from the Tables of Drinking Water Threats Table 11: Provincial Tables of Circumstances Where a Threat Could Be Significant ii. Issue Based Approach Figure 12: Methodology for Identifying Drinking Water Issues Implementation Guide: Module 2 Understanding Where Policies Apply Page 4 of 89
5 Issue Contributing Area iii. Events Based Approach iv. Conditions Based Approach v. Local Threats Based Approach J. Putting It All Together- Steps for Identifying Threats and Applying Policies K. Case Study Table 15: Excerpt from the Tables of Drinking Water Threats L. Appendix 1- Detailed Local Threat Example Congregation of Waterfowl Within or Near Surface Water Bodies M. Appendix 2 Threat Screening Questionnaires Threat 1a Application of Untreated Septage to Land Threat 1b Waste Disposal Sites Threat 1c Mine Tailings Threat 2a Stormwater Management Threat 2b Waste water Treatment Plants/Sewer Systems Threat 2c On-site Sewage Systems Threat 2d Industrial Effluent Threats 3, 4 and 5 Agricultural Source Material Threats 6 & 7 Non Agricultural Source Material (NASM) Threats 8 & 9 Commercial Fertilizer Threats 10 & 11 Pesticides Threats 12 & 13 Road Salt Threat 14 Storage of Snow Threat 15 Handling and Storage of Fuel Threat 16 Handling and Storage of Dense Non Aqueous Phase Liquids (DNAPLs) Threat 17 Handling and Storage of Organic Solvents Threat 18 Aircraft De-icing Threat 21 Livestock Implementation Guide: Module 2 Understanding Where Policies Apply Page 5 of 89
6 LIST OF TABLES Table 1: Example Relationship between Vulnerability and Vulnerability Score Table 2: Vulnerability Score Required for a Drinking Water Threat to Be Significant in a WHPA 16 Table 3: Definitions for Surface Water Intakes as Outlined in the Technical Rules Table 4: Methods for Delineating Vulnerable Areas around Surface Water Intakes Table 5: Vulnerability Score Required for a Significant Drinking Water Threat in an IPZ Table 6: Prescribed Drinking Water Threats under the Clean Water Act, Table 7: Summary of Water Quality Threats by Threat Category Table 8: Summary of Risk Scores Required for Drinking Water Threats Table 9: Layout of the Tables of Drinking Water Threats Table 10: Sample from the Tables of Drinking Water Threats Table 11: Provincial Tables of Circumstances Where a Threat Could Be Significant Table 12: Area Where Activities Are or Would Be Significant Drinking Water Threats Table 13: Classification of Threat Levels for Drinking Water Conditions Table 14: Summary of the Impact of Conditions to Drinking Water Threats Table 15: Excerpt from the Tables of Drinking Water Threats Table 16: Excerpt from Provincial Table of Circumstances Table 17: Example of a Local Threat in the Ontonabee-Peterborough Region Implementation Guide: Module 2 Understanding Where Policies Apply Page 6 of 89
7 LIST OF FIGURES Figure 1: Wellhead Protection Areas (Ministry of Environment, 2012) Figure 2: Intrinsic Vulnerability (Ministry of Environment, 2012) Figure 3: Relationship between Intrinsic Vulnerability and Vulnerability Scores (Ministry of Environment, 2012) Figure 4: Type D Intake Protection Zones 1 and 2 Showing Vulnerability Scores Assigned Figure 5: Three Intake Protection Zones for a Type A (Great Lakes) Intake Figure 6: Vulnerability Scores for Vulnerable Areas around Type A Intake Figure 7: Areas for Significant, Moderate and Low Drinking Water Threats Figure 8: Understanding the Provincial Tables of Circumstances Codes Figure 9: Understanding the Provincial Tables of Circumstances Codes (Example 2) Figure 10: Understanding the Provincial Tables of Circumstances Codes (Example 3) Figure 11: Understanding the Provincial Tables of Circumstances Figure 12: Methodology for Identifying Drinking Water Issues Figure 13: Issue Contributing Area of a Municipal Well Figure 14: Location of a Condition to be Classified as a Significant Threat Figure 15: Steps in Identifying and Confirming Significant Drinking Water Threats Figure 16: Screening Chart of Questionnaires to Complete by Property Type Figure 17: Flow Chart of Threats to Screen for Within a Wellhead Protection Area Based on Vulnerability Score Figure 18: Flow Chart of Threats to Screen for Within IPZ/WHPA-E Based on Vulnerability Score Figure 19: Case Study Property Location Figure 20: Property Location and Vulnerable Area Map Figure 21: Property Location and Vulnerability Score Map Figure 22: Locations Where Local Threat (Congregation of Waterfowl) Is or Would Be Significant Implementation Guide: Module 2 Understanding Where Policies Apply Page 7 of 89
8 A. Purpose of This Module This module is the second in a series of documents developed for use by municipalities to assist with preparing for the implementation of source protection plans. This module is intended to assist municipal staff, Risk Management Officials and Risk Management Inspectors with implementing the policies in the source protection plan. By the end of this module, you will understand: what a vulnerable area is how to identify a vulnerable area how vulnerability scores are calculated what a significant drinking water threat is how to identify significant drinking water threats how to determine if a source protection plan policy applies B. The Need for a Threats Verification The threats identification in the Assessment Reports was based on a preliminary understanding of activities which were believed to be taking place at the time of the assessment. These initial threat counts serve as an estimate of the scope of work necessary to implement the source protection plan. Verifying the existence of these threats is therefore the necessary first step in initiating the implementation of the policies of the source protection plan, including initiating the development of Risk Management Plans where they are required. Consult with your source protection region before undertaking this threats verification to gain a better understanding of the quality of data collected on threats identification in the Assessment Reports. Some municipalities will have staff in place to begin this exercise prior to approval of the source protection plan, while others may not. For some source protection regions and areas, the threats verification exercise will be straightforward. For others, the process will be more complex. Timelines for the threats verification will vary depending on the region, number and types of threats; therefore, it is highly advisable to plan ahead for unexpected delays. For example, in large urban areas, the field verification task may be more onerous, and can quickly become outdated as new businesses emerge and others close down. C. Data Management The process you undertake to verify threats will serve as the basis for the rest of your implementation efforts. How you track your efforts will be important. Refer to Module 4 for further details about ongoing data management and reporting requirements. Implementation Guide: Module 2 Understanding Where Policies Apply Page 8 of 89
9 D. Entering Property to Verify Threats You may require access to private property to verify significant drinking water threats. Section 88 of the Clean Water Act, 2006 allows an employee or agent of a source protection authority to enter private property in order to collect data and information that is relevant to the preparation of an Assessment Report, a source protection plan, an interim/annual progress report, or for the purposes of conducting a monitoring program for implementation of source protection plans. As well, a Risk Management Inspector has inspection and property entry powers, which gives the Inspector authority to access property for the purposes of inspections and collecting data/information. This may include inspecting significant threat activities designated by the source protection plan under Section 57 (which prohibits activities) or Section 58 (requires a Risk Management Plan for the activity). While the Clean Water Act provides powers of entry, it is expected that, under most circumstances, a trained person will enter with the consent of the property owner and will be accompanied by the property owner. Therefore, it is important for anyone likely to be engaged in the verification of threats to complete the Ministry of the Environment mandated training. The Property Entry Training Course, developed by the Ministry, is the model for property entry skills and knowledge taught to persons likely to enter private property for the purposes of compliance with the Clean Water Act. For information on the Ministry of the Environment Property Entry training, contact the Source Protection Programs Branch by sourceprotection@ontario.ca. E. Useful Supporting Documents i. Assessment Reports Assessment Reports are technical documents which describe the local watershed, assess the available water supply, map vulnerable areas and identify threats in these vulnerable areas that pose risks to our drinking water. In some cases, threats were identified through a desktop exercise only. A multi-stakeholder source protection committee, with representation from the public sector, as well as local interests such as farming, business, environmental and public health organizations, municipalities and First Nations in some regions, completed Assessment Reports for the source protection area. The Assessment Reports enumerate significant drinking water threats to determine the extent and scope of threat activities, and this information contributed to the development of policies in source protection plans. Contact your local source protection authority to request a copy of your local approved Assessment Report. Implementation Guide: Module 2 Understanding Where Policies Apply Page 9 of 89
10 ii. Source Protection Plans Source protection plans contain a series of policies developed by the source protection committee in consultation with the local community to protect municipal drinking water sources from existing and future drinking water threats. The Clean Water Act and the Ontario Regulation 287/07 establish the requirements governing the contents of a source protection plan. In particular, Ontario Regulation 287/07 requires that the source protection plan contain the following objectives: policies to protect existing and planned drinking water sources, and policies for every area where threats could be significant to ensure that the activities identified as significant drinking water threats either never become a significant threat or, if the activity is already taking place, the activity ceases to be a significant threat. Contact your local source protection authority to request a copy of your local source protection plan. iii. Provincial Tables of Drinking Water Threats The Provincial Tables of Drinking Water Threats document drinking water threats and the level or risk associated with that threat under certain circumstances. These tables include: the prescribed activities that can be identified as threats, the circumstances which make them threats, the vulnerable areas where those activities can be identified as threats, and the level of risk that the threat poses based on the above details. Find the Provincial Tables of Drinking Water Threats at iv. Provincial Tables of Circumstances The Provincial Tables of Circumstances are designed to enable the reference of threats by vulnerable area types (i.e. groundwater, surface water); contaminant type (i.e. chemical, pathogen, DNAPL); vulnerability score; and, threat level (i.e. significant, moderate, low). Based on the possible combinations of vulnerable areas, vulnerability scores and the types of parameters associated with the threats sub-categories, 76 different Provincial Tables of Circumstances are available. These tables contain the same information as the Provincial Tables of Drinking Water Threats, just presented in a different format. Find the Provincial Tables of Circumstances at Implementation Guide: Module 2 Understanding Where Policies Apply Page 10 of 89
11 v. Mapping Database All 19 source protection regions submitted their vulnerability and threats assessment data, in geodatabase format, to the Ministry of the Environment using a tool called the Assessment Report Database. This geodatabase contains a summary of all significant drinking water threats that were identified in vulnerable areas. Each municipality will have received or will be receiving a copy of the geodatabase or geographical information systems data relevant to its jurisdiction from the local source protection authority. You can use this data to integrate source protection information into the mapping programs (e.g., ArcGIS) currently available in your municipality. If your municipality is unable to accept geodatabase or geographical information systems data, contact your local source protection authority to obtain the data in an alternate format. The Ministry of the Environment also has plans for a province-wide web mapping portal where implementing bodies can find the vulnerable area, vulnerability score and the relevant significant drinking water threats that apply in each area. This portal is scheduled to be launched in Your local source protection authority will be able to provide information regarding the status of this tool. F. Some Terms You Need to Know i. Technical Rules Throughout this document, reference is made to the Technical Rules. The Technical Rules were developed by the Ministry of the Environment and establish requirements for completing the technical work required to be included in an Assessment Report. Find the Technical Rules at ii. The Director Also in this document, reference will be made to the Director. The Director refers to the Director of Source Protection Programs Branch at the Ministry of the Environment. G. Vulnerable Areas and Vulnerability Scoring The Clean Water Act requires that policies are developed to protect municipal drinking water sources from activities that are or would be significant drinking water threats. The Clean Water Act identifies four types of vulnerable areas: 1. Wellhead Protection Areas (WHPAs) 2. Surface Water Intake Protection Zones (IPZs) 3. Highly Vulnerable Aquifers (HVAs) Implementation Guide: Module 2 Understanding Where Policies Apply Page 11 of 89
12 4. Significant Groundwater Recharge Areas (SGRAs) i. Wellhead Protection Areas A WHPA is the area of land around a municipal well, the size of which is determined by how quickly water travels underground to the well, in relation to the subsurface geology (rocks and sediments), and water extraction rates. This measurement is generally described in years and referred to as time of travel. The different WHPAs around a municipal well are: 1. WHPA-A: The 100-metre radius around the wellhead. 2. WHPA-B: The area within which the time of travel to the well (within the aquifer) is up to and including two years (excluding WHPA-A). 3. WHPA-C: The area within which the time of travel to the well (within the aquifer) is up to and including five years (excluding WHPA-A and WHPA-B). o WHPA-C1: In situations where the WHPA was delineated before 2005, a WHPA-C may not have been delineated. In these cases, WHPA-C1 is provided instead. It is the area within which the time of travel to the well (within the aquifer) is up to and including 10 years (excluding WHPA- A and WHPA-B). Figure 1: Wellhead Protection Areas (Ministry of Environment, 2012) 4. WHPA-D: The area within which the time of travel to the well (within the aquifer) is up to and including 25 years (excluding WHPA-A, WHPA-B, WHPA-C and WHPA-C1). 5. WHPA-E: This area is delineated when municipal groundwater supplies are considered to be under the direct influence of surface water (groundwater under the direct influence or GUDI). If a well is designated as GUDI, there is a requirement to determine the point of influence between surface water bodies or natural courses which can deliver surface water to the well in a short amount of time (measured in hours) when compared to a well not under the direct influence of surface water. If the exact point of influence is unknown, the nearest surface water body is assumed to be the point of influence. 6. WHPA-F: Is only delineated when a WHPA-E is delineated, and the well is subject to issues which originate from outside the other parts of the WHPA. The WHPA-F is delineated by following the IPZ-3 Technical Rules. Figure 1 provides an example of the four typical WHPAs associated with municipal wells. Implementation Guide: Module 2 Understanding Where Policies Apply Page 12 of 89
 work together to affect the speed at which water moves toward it.")
13 Vulnerability Scoring for Wellhead Protection Areas Each WHPA is further assessed for the intrinsic vulnerability (natural vulnerability) of the aquifers. The intrinsic vulnerability is evaluated by assessing how the geology, geography, hydrogeology, and soil (among other things) work together to affect the speed at which water moves toward it. The outcome of the intrinsic vulnerability assessment is a map that reports the vulnerability as high, medium or low (Figure 2). Figure 2: Intrinsic Vulnerability (Ministry of Environment, 2012) Once the intrinsic vulnerability has been evaluated, vulnerability scores can be assigned within the WHAPs. The Technical Rules provide the guidance necessary to take the intrinsic vulnerability (high, medium or low) and translate it to a vulnerability score (based on a 10-point scale). The first step to assigning vulnerability scores is overlaying the WHPAs capture zones onto the intrinsic vulnerability map (Figure 2). Table 1 shows an example of how the Technical Rules establish the relationship between the intrinsic vulnerability and the vulnerability score when using the intrinsic susceptibility index (ISI) or aquifer vulnerability index (AVI) methodology. Within a WHPA-A, where the intrinsic vulnerability is high, medium or low, the table indicates that a vulnerability score of 10 is to be assigned. Within WHPA-B the table indicates that a vulnerability score of 10 is to be assigned where the intrinsic vulnerability is high, 8 where it is medium and 6 where it is low. A WHPA will have several vulnerability scores assigned within it, Implementation Guide: Module 2 Understanding Where Policies Apply Page 13 of 89
14 even if the intrinsic vulnerability is the same across the wellhead. Figure 3 illustrates how the intrinsic vulnerability is translated to a vulnerability score using Table 1. Implementation Guide: Module 2 Understanding Where Policies Apply Page 14 of 89
 The vulnerability scores within the capture zones can be increased if a transport")
15 Table 1: Example Relationship between Vulnerability and Vulnerability Score Vulnerability Vulnerability Score WHPA-A WHPA-B WHPA-C WHPA-C1 WHPA-D High Medium Low Figure 3: Relationship between Intrinsic Vulnerability and Vulnerability Scores (Ministry of Environment, 2012) The vulnerability scores within the capture zones can be increased if a transport pathway is present. A transport pathway acts as a conduit or direct path for contaminants to get into the underground aquifer, for example, an old well that has not been abandoned properly. Another example of a transport pathway is an open aggregate pit or quarry that has removed the natural protective materials overlaying the municipal aquifer. Table 2 summarizes the vulnerability scores required for a significant drinking water threat to be present within a WHPA. Implementation Guide: Module 2 Understanding Where Policies Apply Page 15 of 89
16 Table 2: Vulnerability Score Required for a Drinking Water Threat to Be Significant in a WHPA Threat Type Vulnerable Area Vulnerability Score Required for a Significant Threat Chemical WHPA- A, B,C,C1,D 8 10 WHPA- E Pathogen WHPA- A and B 10 WHPA -E 8 9 DNAPL WHPA- A,B, C, C1 Any score ii. Intake Protection Zones An IPZ is the area of water and land immediately surrounding a surface water intake. It is based on the distance from the intake as well as the minimum response time for the water treatment plant operator to respond to adverse conditions or an emergency. The IPZ also includes the remaining watershed area upstream of the minimum travel time area, or an area where it can be demonstrated through modeling or other methods that a contaminant would reach the intake during an extreme event. The Technical Rules classify surface water intakes according to the nature of the water source from which they draw water. Different methodologies are prescribed for the delineation of IPZs for each intake classification. Table 3 outlines the four intake classifications as they are outlined in the Technical Rules. In some cases, intakes are classified or re-classified based on other circumstances through approval granted by the Director of the Source Protection Programs Branch of the Ministry of the Environment. Table 3: Definitions for Surface Water Intakes as Outlined in the Technical Rules Intake Type A B C D Description Intake or the planned intake is or would be located in a Great Lake Intake or the planned intake is or would be located in a connecting channel (e.g. St. Lawrence, St. Mary s, St. Clair, Detroit and Niagara rivers, and the Welland Canal) Intake or the planned intake is or would be located in a river and neither the direction nor velocity of the flow of the water at the intake is affected by a water impoundment structure If the intake is not a Type A, B or C (e.g., intakes located in inland lakes) For each surface water intake, three IPZs are identified. Table 4 summarizes the methodologies for delineation of the vulnerable areas around a surface water intake. Implementation Guide: Module 2 Understanding Where Policies Apply Page 16 of 89
17 Table 4: Methods for Delineating Vulnerable Areas around Surface Water Intakes Intake Protection Zone 1 (IPZ-1) The area immediately around the intake. Intake Type A and D B C Delineation Defined by a 1 km radius centered on the crib of the intake (Table 5). Defined by a semi-circle that has a radius of 1 km extending upstream from the crib of the intake and a rectangle with a length of 2 km centred on the crib of the intake and a width of 100 metres extending downstream from the crib of the intake. Defined by a semi-circle that has a radius of 200 metres extending upstream from the crib of the intake and a rectangle with a length of 400 metres centred on the crib of the intake and a width of 10 metres downstream of the intake. Note: The IPZ-1 is a fixed distance from the intake based on the sensitivity analysis of a massive sudden spill in the vicinity of the intake. The IPZ-2 is defined as the area that may contribute water to the intake where the time of travel to the intake is equal to or less than the time that is sufficient to allow the operator of the system to respond to an adverse Intake Protection Zone 2 (IPZ-2) condition in the quality of the surface water. The Technical Rules indicate that a minimum 2 hour time of travel should be used to delineate the IPZ 2 (excluding IPZ-1). Note: The IPZ-2 represents the operator response time to shut down the drinking water system in case of a spill. For all types of intakes, the IPZ-3 is defined as the area of the water and land that may lead to contaminants reaching an intake during an extreme event such as a one in one hundred year rainfall as determined through modeling or other methods (contaminant transport, boundary approach, combined approach). Significant threats are then identified if it can be Intake Protection Zone 3 shown through modeling that a release of a contaminant during an extreme (IPZ-3) event may be transported to the intake. For type C and D intakes not located in Lake Nipissing, Lake Simcoe, Lake St. Clair, or the Ottawa River, the IPZ-3 is defined as the area within each surface water body that may contribute water to the intake within the watershed boundary. Note: The IPZ-3 is an area beyond the IPZ-1 and 2 and is delineated differently based on the intake type. For all intake types where the IPZ-1, IPZ-2 and IPZ-3 abuts land, a setback of less than or equal to 120 metres or the Conservation Authority Regulation limit is included, whichever, is greater. The set-back is measured from the high water mark of the surface water body that encompasses the area where overland flow drains into the surface water body and the areas of the Conservation Authority Regulation limit along the abutted land. Implementation Guide: Module 2 Understanding Where Policies Apply Page 17 of 89
.")
18 Vulnerability Scoring for Intake Protection Zones As was the case with the WHPAs, the vulnerable areas around a surface water intake have also been assigned a vulnerability score (Figure 4, Figure 5, Figure 6). The vulnerability scores required for an activity to be designated as a significant drinking water threat, taking into consideration the type of threat and the vulnerable area around a surface water intake, are outlined in Table 5. Note Table 5 does not apply when significant drinking water threats are identified under the issue or events based approaches discussed in Sections 9 (II) and (III) respectively. Note also that intakes located in the Great Lakes or connecting channels do not have a vulnerability score associated with their IPZ-3 as per the Technical Rules. Table 5: Vulnerability Score Required for a Significant Drinking Water Threat in an IPZ Threat Type Vulnerable Area Vulnerability Score Required for a Significant Threat Chemical IPZ/WHPA-E 8 10 Pathogen IPZ-WHPA-E 8 10 DNAPL IPZ/WHPA-E 10 Figure 4: Type D Intake Protection Zones 1 and 2 Showing Vulnerability Scores Assigned Implementation Guide: Module 2 Understanding Where Policies Apply Page 18 of 89
 Intake Numbers in")

19 IPZ-1 is represented in red, IPZ-2 in blue and IPZ-3 as the dashed line. Figure 5: Three Intake Protection Zones for a Type A (Great Lakes) Intake Numbers in bold represent the vulnerability score Figure 6: Vulnerability Scores for Vulnerable Areas around Type A Intake Implementation Guide: Module 2 Understanding Where Policies Apply Page 19 of 89
20 iii. Highly Vulnerable Aquifers Although HVAs are one of four types of vulnerable areas identified under the Clean Water Act, significant drinking water threats cannot be found in HVAs, unless an identified issue is present. For an issue to be present in a HVA, the issue contributing area for a municipal system would have been extended to incorporate the HVA. If this is the case, significant threats associated with the issue can be located within the entire delineated issue contributing area. The issue contributing area is discussed in Section 9 (II). iv. Significant Groundwater Recharge Areas Although SGRAs are one of four types of vulnerable areas identified under the Clean Water Act, significant drinking water threats cannot be found in SGRAs, unless an identified issue is present. For an issue to be present in a SGRA, the issue contributing area for a municipal system would have been extended to incorporate the SGRA. If this is the case, significant threats associated with the issue can be located within the entire delineated issue contributing area. The issue contributing area is discussed in Section 9 (II). H. Threats A threat is an activity or condition that adversely affects or has the potential to adversely affect the quality or quantity of any water that is or may be used as a source of drinking water that is prescribed by the Regulations as a drinking water threat. The Province has prescribed 21 threats to municipal drinking water sources. The identified activities or conditions are considered to be chemical, pathogen or dense non-aqueous phase liquid (DNAPL) threats. Each of the activities prescribed to be drinking water threats under the Clean Water Act are those considered to be undertaken by humans. These activities are listed in Ontario Regulation 287/07 and examples of each activity are summarized and sorted by category in Table 7. Implementation Guide: Module 2 Understanding Where Policies Apply Page 20 of 89
21 Table 6: Prescribed Drinking Water Threats under the Clean Water Act, 2006 Threat # Prescribed Drinking Water Threat Activity Examples of Threat 1 The establishment, operation or maintenance of a waste disposal site within the meaning of Part V of the Environmental Protection Act. Storage of PCBs and other hazardous waste, landfilling of hazardous, non-hazardous, municipal or commercial waste, and land application of 2 The establishment, operation or maintenance of a system that collects, stores, transmits, treats, or disposes of sewage. 3 The application of agricultural source material to land. 4 The storage of agricultural source material. 5 The management of agricultural source material The application of non-agricultural source material. The handling and storage of non-agricultural source material. The application of commercial fertilizer to land. The handling and storage of commercial fertilizer. The application of pesticide to land. The handling and storage of pesticide. untreated septage. Septic systems, stormwater treatment ponds, discharge of industrial effluent, sewage treatment plants, and sanitary sewer systems. Manure produced by farm animals, and run-off from farm yards and manure storages. Facilities that cultivate fish or other aquatic organisms in a controlled environment. Land application of sewage biosolids or other similar wastes. Contaminants of interest include nitrogen and phosphorus. Pesticides of interest include the chemicals used to control weeds (herbicides), or fungi (fungicides) or those used as a soil fumigant to control fungi, and nematodes and weeds. Contaminants of interest include chloride and sodium The application of road salt. The handling and storage of road salt. 14 The storage of snow. Contaminants of interest include chloride, sodium, and petroleum hydrocarbons. 15 The handling and storage of fuel. Bulk plants or facilities where fuel is manufactured, gas stations and cardlocks or keylocks, marinas, private storage such as farms and contractor yards, and heating Implementation Guide: Module 2 Understanding Where Policies Apply Page 21 of 89
22 16 The handling and storage of a dense nonaqueous phase liquid. oil tanks for homes and businesses. Dry-cleaning chemicals, paint and spot removers, rugcleaning fluids, and varnishes. 17 The handling and storage of an organic solvent. Paints, varnishes, lacquers, adhesives, glues, and degreasing or cleaning agents, and in the production of dyes, polymers, plastics, textiles, and printing inks. 18 The management of run-off that contains chemicals used in the de-icing of aircraft. 19 * An activity that takes water from an aquifer or a surface water body without returning the water taken to the same aquifer or surface water body. Airports using ethylene glycol to de-ice aircrafts. Water taken from Lake Simcoe and discharged into groundwater. 20 * An activity that reduces the recharge of an aquifer. Increasing impervious cover (parking lots). 21 The use of land as livestock grazing or pasturing land, an outdoor confinement area or a farmanimal yard. Fields where livestock graze, and confinement areas outside barns. * This implementation module does not detail the process to identify significant threats for water quantity (threats 19 and 20) as the process is unique for each water quantity threat identified. Water quantity threats are derived through Tier 3 Water Budget studies, in which your municipality was likely involved. To confirm the absence or presence of water quantity threats in your municipality, contact your local source protection authority. Table 7: Summary of Water Quality Threats by Threat Category Threat Category Threat # Chemical 1,2,3,4,6,7,8,9,10,11,12,13,14,15,17,18,21 Pathogen 2,3,4,5,6,7,21 DNAPL 1,2,16 If an activity is not listed in Table 7, it does not fall within the scope of the Clean Water Act. Examples of activities outside the scope of the Clean Water Act include geothermal power, pharmaceuticals and personal care products, and disposal of imported fill. However, activities not strictly identified above can be added as local threats. See Section 9 (v) for a description of local threats. The 21 potential threats above can be classified into three categories: low, moderate or significant based on a calculated risk score. The process for determining a risk score is discussed next. Implementation Guide: Module 2 Understanding Where Policies Apply Page 22 of 89
23 I. Approaches for Identifying Significant Drinking Water Threats There are five ways to identify significant drinking water threats, as prescribed under the Clean Water Act: 1. threats based approach 2. issue based approach 3. events based approach 4. conditions based approach 5. local threats based approach According to the Clean Water Act, there must be policies for all activities classified as significant drinking water threats. Policies must address activities that currently occur as well as any activities that may occur in the future. Each source protection committee is given the option of creating policies for moderate or low drinking water threats. Review your local source protection plan to determine whether or not policies were developed for these threats in your area. i. Threats Based Approach The threats based approach is the most common way to identify drinking water threats. The foundation for the threats based approach is the risk score. A risk score is assigned to an activity that is based on a combination of hazard rating (of the specific activity) and vulnerability score (of the area where the activity takes place). Risk Score = Hazard Rating x Vulnerability Score Hazard ratings are the basis for the circumstances in the Tables of Drinking Water Threats, and are assigned scores on a scale of 2 10 by the Ministry of Environment. The scores were assigned by considering a number of factors, including but not limited to toxicity, quantity of contaminant released, and the frequency of association with pathogens. Recall that the vulnerability score is assigned on a scale of 2 10 by considering the intrinsic vulnerability and time of travel. Table 8 summarizes the risk scores required for an activity or condition to be considered a significant, moderate or low drinking water threat. A risk score of is required for the activity or condition to be considered a significant drinking water threat. Implementation Guide: Module 2 Understanding Where Policies Apply Page 23 of 89
24 Table 8: Summary of Risk Scores Required for Drinking Water Threats Threat Risk Score Significant Moderate Low For example, an activity with a hazard rating of 8 that takes place in an area where the vulnerability score is 8 has a risk score of 64. Table 8 identifies it as a moderate threat. An activity assigned a hazard rating of 8 that takes place in an area where the vulnerability score is 10 has a risk score of 80. Table 8 identifies it as a significant threat. The risk scores required to have a significant drinking water threat are built into the Tables of Drinking Water Threats and Tables of Circumstances, meaning you do not need to explicitly calculate the risk score to identify significant drinking water threats. The Tables indicate when a specific circumstance is significant, moderate or low. Using the Provincial Tables to Determine Threats Tables of Drinking Water Threats The Province established the Tables of Drinking Water Threats to identify circumstances in which activities are classified as drinking water threats. These tables can be used to identify circumstances where activities are significant threats and to indicate vulnerable areas where activities are or would be significant drinking water threats. To determine these circumstances and areas, it is important to understand how the tables are set up. Find the Tables of Drinking Water Threats at Upper Thames River Conservation Authority has an interactive version of the table also available online: Implementation Guide: Module 2 Understanding Where Policies Apply Page 24 of 89
25 Table 9: Layout of the Tables of Drinking Water Threats Location in Table Column 1 Column 2 Column 3 Columns 4 6 Field Activity (drinking water threat), based on the 19 water quality prescribed drinking water threats. Set of circumstances specific to a drinking water threat, including presence of contaminant parameters, volumes, and release into the environment. Vulnerable area (e.g. WHPA, IPZ) Vulnerability scores identifying whether the activity under the set of circumstances is a significant, moderate or low drinking water threat. Implementation Guide: Module 2 Understanding Where Policies Apply Page 25 of 89
26 Example: Determining Threats Using the Tables of Drinking Water Threats Step 1: Identifying Drinking Water Threat (Table 10, Column 1) The establishment, operation or maintenance of a system that collects, transmits, treats or disposes of sewage. Step 2: Review the Circumstances (Table 10, Column 2) Is the sewage system a stormwater management facility designated to discharge stormwater to land or surface water? Is the drainage area associated with the stormwater facility more than 10 hectares but not more than 100 hectares? Are the predominant land uses in the area rural, agricultural or low density residential? Could the discharge of stormwater result in the presence of lead or one or more of its compounds containing lead in groundwater or surface water? If you answer yes to all of these questions, this circumstance would apply. Step 3: Review the location of the activity (i.e., stormwater management facility) (Table 10, Column 3) Is the activity in the IPZ-1, IPZ-2, IPZ-3, or WHPA-E? Is the activity in the WHPA-A, WHPA-B, WHPA-C, WHPA-C1, or WHPA-D? Is the activity in a highly vulnerable aquifer area? Is the activity in a significant groundwater recharge area? Step 4: Determine whether the threat is significant, moderate, or low (Table 10, Columns 4-6) If the activity in the IPZ-1, IPZ-2, IPZ-3, or WHPA-E with vulnerability score of 10, the threat is significant. If the activity is in the IPZ-1, IPZ-2, IPZ-3 or WHPA-E with a vulnerability score of 8 9, or WHPA-A, B, C and D with a vulnerability score of 10, the threat is moderate. If the activity is in the IPZ-1, IPZ-2, IPZ-3, or WHPA-E with a vulnerability score of , the threat is low. Implementation Guide: Module 2 Understanding Where Policies Apply Page 26 of 89
27 Table 10: Sample from the Tables of Drinking Water Threats Drinking Water Threats Reference Number Under the Following CIRCUMSTANCES Areas Within Vulnerable Areas Threat is Significant in Areas with a Vulnerability Score of Threat is Moderate in Areas with a Vulnerability Score of Threat is Low in Areas with a Vulnerability Score of Column 1 Column 2 Column 3 Column 4 Column 5 Column 6 The establishment, operation or maintenance of a system that collects, transmits, treats or disposes of sewage. IPZ-1, IPZ-2, IPZ-3, and WHPA-E The system is a storm water management facility designed to discharge storm water to land or surface water. 2. The drainage associated with the storm water management facility is more than 10 but not more than 100 hectares and the predominant land uses in the area are rural, agricultural, or low density residential. 3. The discharge may result in the presence of Lead or one or more of its compounds containing Lead in groundwater or surface water. WHPA-A, WHPA-B, WHPA-C, WHPA-C1, WHPA-D HVA 6 SGRA 6 Location Activity Circumstances Significant, Moderate, or Low Tables of Circumstances The Provincial Tables of Circumstances contain the same information as the Tables of Drinking Water Threats, but are presented in a different format. Based on the possible combinations of vulnerable areas and vulnerability scores, 76 different Provincial Tables of Circumstances have been created. The Tables of Circumstances represent all of the different combinations for which there are provincially prescribed threats and circumstances within the Tables of Drinking Water Threats. There are five categories of tables: 1. Chemical tables for groundwater (WHPAs) 2. DNAPL tables for groundwater 3. Pathogen tables for groundwater 4. Chemical and DNAPL tables for surface water (IPZs) 5. Pathogen tables for surface water Each of the five categories of tables have been further broken down into activities that are significant, moderate, or low drinking water threats depending on the vulnerability score of the Implementation Guide: Module 2 Understanding Where Policies Apply Page 27 of 89
28 vulnerable area. As Table 11 demonstrates, 12 of the 76 Provincial Tables of Circumstances list circumstances where a threat could be significant (see Table 11). The Tables of Circumstances were used to generate maps for each drinking water system (included in the Assessment Reports) that relate the vulnerability score for a WHPA or IPZ to the number and types of circumstances in the Tables of Drinking Water Threats. The maps in the Assessment Reports illustrate the areas around the municipal drinking water systems where land use activities either are (for the case of existing activities), or would be (for the case of potential future activities) significant, moderate or low drinking water threats. Embedded in these maps or in the Assessment Reports are tables to direct the reader to the appropriate list of threats that corresponds to the combination of vulnerable area, i.e. WHPA A-E or IPZ 1-3 and vulnerability score (10, 8, 6 or 2). Determining Threats Using the Tables of Circumstances Using Figure 7 as an example, the areas where significant, moderate, or low drinking water threats are present is shown for both chemical and pathogen threats. The embedded table demonstrates that, where the vulnerability score is 10 (Red), Provincial Tables 20 and 46 would list the circumstances under which an activity in that area would be considered a chemical or pathogen threat, respectively. The areas where the vulnerability score is 8 (orange) are where the circumstances listed in Provincial Tables 21 (chemical) and 47 (pathogen) would apply. Please note that the colouring used to illustrate the vulnerability scores in this example was not used by all source protection regions. Therefore, the mapping in your Assessment Report(s) may not be exactly the same. Implementation Guide: Module 2 Understanding Where Policies Apply Page 28 of 89
, the location of the activity (i.e., IPZ, WHPA), the vulnerability score, and the classification of the threat (i.e., significant, moderate or low).")
29 Figure 7: Areas for Significant, Moderate and Low Drinking Water Threats A numerical code corresponds to each of the Provincial Tables of Circumstances. The code distinguishes between the type of threat (i.e., chemical, pathogen, DNAPL), the location of the activity (i.e., IPZ, WHPA), the vulnerability score, and the classification of the threat (i.e., significant, moderate or low). The Provincial Tables of Circumstances supports the Tables of Drinking Water Threats. As you complete the threat verification exercise, you will work extensively with both sets of Tables. For some threats and vulnerable areas you may find it easier to work with the Provincial Tables of Circumstances, while in other cases it will be easier to work with the Tables of Threats. For example, when screening for significant drinking water threats within WHPA-E, the Tables of Circumstances may be easier as you need to look at only a few pages instead of searching through each threat type in the Tables of Threats. Implementation Guide: Module 2 Understanding Where Policies Apply Page 29 of 89
30 Table 11: Provincial Tables of Circumstances Where a Threat Could Be Significant TABLE NUMBER CODE DESCRIPTION 1 CW10S Chemicals in a WHPA with a vulnerability score of 10 2 CW8S Chemicals in a WHPA with a vulnerability score of 8 19 CIPZ10S Chemicals in an IPZ with a vulnerability of CIPZWE9S Chemicals in an IPZ or WHPA E where the vulnerability score is 9 21 CIPZWE8.1S Chemicals in an IPZ or WHPA E where the vulnerability score is CIPZWE8S Chemicals in an IPZ or WHPA E where the vulnerability score is 8 9 DWAS DNAPLS in WHPA A, B, C, C1, with any vulnerability 12 PW10S Pathogens in WHPA A, B with a vulnerability of PIPZ10S Pathogens in an IPZ with a vulnerability of PIPZWE9S Pathogens in an IPZ or WHPA E with a vulnerability of 9 47 PIPZWE8.1S Pathogens in an IPZ or WHPA E with a vulnerability of PIPZWE88S Pathogens in an IPZ or WHPA E with a vulnerability of 8 Chemical Vulnerability Score C IPZWE 9 S IPZ and WHPA-E Significant Drinking Water Threat Figure 8: Understanding the Provincial Tables of Circumstances Codes (Example 1) Implementation Guide: Module 2 Understanding Where Policies Apply Page 30 of 89
31 DNAPL All Vulnerability Scores D W A S WHPA Significant Drinking Water Threat Figure 9: Understanding the Provincial Tables of Circumstances Codes (Example 2) Pathogen Vulnerability Score P IPZ 10 S Intake Protection Zone Significant Drinking Water Threat Figure 10: Understanding the Provincial Tables of Circumstances Codes (Example 3) Implementation Guide: Module 2 Understanding Where Policies Apply Page 31 of 89
32 Prescribed Threat Chemical of Concern: In many cases there are a number of chemicals associated with the same activity and circumstance. Provincial Table (CW10S): Chemicals in a WHPA with a vulnerability score of 10 The application of road salt Ref # Circumstances Chemical The road salt is applied in an area where the percentage of Chloride total impervious surface area, as set out on a total impervious surface area map, is 80 percent or more Sodium Reference Number from the November 2009 Tables of Drinking Water Threats Circumstance from the November 2009 Tables of Drinking Water Threats. A blank space indicates the same circumstance as above relates to a different contaminant of concern Figure 11: Understanding the Provincial Tables of Circumstances Implementation Guide: Module 2 Understanding Where Policies Apply Page 32 of 89
33 ii. Issue Based Approach An issue is defined under the Clean Water Act as an existing water quality problem associated with a municipal drinking water supply (this includes monitoring wells), or evidence of a trend that suggests a deterioration of water quality for one or more parameters. The Assessment Reports will identify any issues for each drinking water system. The intent of the issues evaluation is to identify chemical or bacterial concentrations in raw drinking water at the drinking water system that will limit the ability of the water to serve as a drinking water source, either now or in the future. The presence of a contaminant in a well or drinking water system is determined through the analysis of available data and reports. To be considered a drinking water issue, a parameter needs to be at a concentration that is above the Ontario Drinking Water Quality Standards, or have an increasing trend that will lead to concentrations being above the standards, in accordance with the Technical Rules. A parameter may not be identified as an issue in cases where it is naturally occurring or effective treatment is in place. For example, both iron and manganese can occur naturally in the environment. Therefore, exceeding the Ontario Drinking Water Standards for these two metals in the data collected from a municipal drinking water system doesn t necessarily identify it as an issue. The different source protection regions developed a process for identifying issues which met the Technical Rules. Figure 12 outlines an example process used by a few source protection regions to identify an issue. Consult your local Assessment Report for specific details on how issues were identified within your municipality. Implementation Guide: Module 2 Understanding Where Policies Apply Page 33 of 89

34 Figure 12: Methodology for Identifying Drinking Water Issues Note the following acronym definitions in this figure: MAC = Maximum Acceptable Concentration, ODWQS = Ontario Drinking Water Quality Standards, AO = Aesthetic Objective, OG = Operational Guideline. Implementation Guide: Module 2 Understanding Where Policies Apply Page 34 of 89

35 Issue Contributing Area An issue contributing area is the area where drinking water threats may contribute to a known drinking water issue. An issue contributing area can occur within a WHPA, an IPZ, and may include a HVA, or a SGRA. Within issue contributing areas, significant drinking water threats are present anywhere a circumstance for the identified issue is occurring, regardless of the vulnerability score stated to be required in the Tables of Threats or Circumstances. Step 1: Review available data and reports for evidence that the concentration of a parameter is above the Ontario Drinking Water Quality Standards, or has an increasing trend that will lead to concentrations being above the standards. In this example, it has been determined that a nitrate-nitrogen issue exists. Step 2: Identify the issue contributing area (Figure 13, Table 12). For this municipal drinking water supply system, the issue contributing areas represents the entire WHPA shown in red. Figure 13: Issue Contributing Area of a Municipal Well Implementation Guide: Module 2 Understanding Where Policies Apply Page 35 of 89
36 Table 12: Area Where Activities Are or Would Be Significant Drinking Water Threats THREATS RELATED TO DRINKING WATER ISSUES Area Significant Activities prescribed to be drinking water threats that can generate nitrate-nitrogen (NO 3 N) This table identifies the activities that are (or would be for future activities) significant drinking water threats within the issue contributing area. Step 3: Identify all significant threats within the issue contributing area that are associated with the issue. All circumstances associated with nitrate and nitrogen listed in the Provincial Tables of Threats and Circumstances would trigger the identification of a significant drinking water threat if the activity or condition is present or could be occurring anywhere within the issue contributing area, regardless of the vulnerability score within the different capture zones. iii. Events Based Approach The events based approach uses numerical modeling to identify potential significant threats and delineate the IPZ-3 for certain intakes. Through numerical modeling, spills of potential contaminants are simulated. This model calculates the probability of a spill reaching the intake at a concentration sufficient to trigger a threat by considering factors such as wind speed, water currents and flow rates. Steps to Identify Significant Drinking Water Threats and IPZ-3 Delineation Step 1: Select extreme events for threat identification and IPZ-3 delineation. An analysis of wind speeds and river flows is undertaken to develop an extreme event scenario with a joint probability (considering both wind and flow) of approximately a 1-in-100-year storm event. Step 2: Identify potential significant threats and assign spill scenarios. Identify specific activities that may result in a contaminant being transported to the intake during an extreme event and the possible deterioration of the drinking water source. If an activity is considered to be a potential significant threat, spill scenarios are developed for the purposes of modeling transport to the intake. Step 3: Model lake and tributary spills. Calculate the dilution and reduction in spill concentrations in tributaries between the spill location and the tributary mouth by analytical means, during an extreme event. Implementation Guide: Module 2 Understanding Where Policies Apply Page 36 of 89
37 Step 4: Identify significant threats and delineate IPZ-3. Determine whether the spill constitutes a threat to the drinking water source at the intake through a comparison of modeled concentrations at the intake with the Ontario Drinking Water Quality Standard (ODWQS). Concentrations exceeding the ODWQS are typically considered to be a deterioration of the drinking water. If the identified activity is not within an existing IPZ (IPZ-1 or 2), an IPZ-3 is delineated based on the location of the significant threat activities. Identifying the extent of the IPZ-3 and the associated significant threats is an iterative process. Upon review of step 3 and 4 results, revisit step 1 to ensure additional activities excluded in the first round are still no longer a threat. If the new modeling results indicate that an additional activity should be considered, proceed with steps 3 and 4. iv. Conditions Based Approach A condition represents the contamination of rock, soil, or water resulting from a past activity, such as a fuel spill. A condition must be within a vulnerable area (WHPA, IPZ, HVA, SGRA) and meet certain criteria as outlined in the Technical Rules to be considered a threat. Unless there is evidence that the condition is causing off-site contamination, the condition will not be considered a significant threat as prescribed by the Technical Rules and described in this section. Criteria to Identify a Condition in the Technical Rules 1. The presence of a DNAPL in groundwater in a HVA, SGRA, or WHPA. 2. The presence of a single mass more than 100 litres of one or more DNAPLs in surface water in an IPZ. 3. The presence of a contaminant in groundwater in a HVA, SGRA, or WHPA, if the contaminant is listed in Table 2 of the Soil, Groundwater and Sediment Standards and is present at a concentration that exceeds the potable groundwater standard set out for the contaminant in that table. 4. The presence of a contaminant in surface soil in an IPZ, if the contaminant is listed in Table 4 of the Soil, Groundwater and Sediment Standards and is present at a concentration that exceeds the potable groundwater standard set out for the contaminant in that table. 5. The presence of a contaminant in sediment, if the contaminant is listed in Table 1 of the Soil, Groundwater and Sediment Standards and is present at a concentration that exceeds the sediment standard set out for the contaminant in that table. Conditions are evaluated by calculating a risk score (Table 13).The risk score is calculated by multiplying the hazard rating by the vulnerability score of the vulnerable area in which the condition is located. The hazard rating is higher when there is evidence that the condition is causing offsite contamination or if the condition is on a property where a well, intake, or monitoring well related to a drinking water system is located. The Technical Rules specify that Implementation Guide: Module 2 Understanding Where Policies Apply Page 37 of 89
38 where there is evidence that the condition is causing offsite contamination, or if the condition is on the same property as the drinking water system well, intake or monitoring well, the hazard rating is 10. In all other situations, the hazard rating is 6 (i.e. if the condition is and will remain contained within the site). A condition may also be a significant drinking water threat if it is associated with a drinking water issue or if there is evidence that it is causing offsite contamination. Table 13: Classification of Threat Levels for Drinking Water Conditions Threat Level Risk Score Significant 80 Moderate Low Steps to Identify a Condition Step 1: Review available data and reports for evidence that a past activity is causing contamination offsite. For this example, there is evidence of vinyl chloride contamination as a result of past activities. Step 2: Identify the hazard score for the condition based on the Technical Rule criteria. For this example, it was determined that the hazard score associated with the vinyl chloride contamination is 10 because of evidence of offsite contamination. Step 3: Identify the risk score of the condition. Recall that the risk score is equal to the vulnerability score multiplied by the hazard score and Table 14 identifies the areas where the condition would be significant, moderate and low. Implementation Guide: Module 2 Understanding Where Policies Apply Page 38 of 89

39 Condition is SIGNIFICANT where the hazard score is 10 and vulnerability score is 8 or higher. Condition is MODERATE where the hazard score is 10 and vulnerability score is 6. Figure 14: Location of a Condition to Be Classified as a Significant Threat Vulnerability Score Table 14: Summary of the Impact of Conditions to Drinking Water Threats Evidence that the condition is causing offsite contamination and/or condition is on a property or well related to the drinking water system Hazard Risk Are or Would Be All other situations Hazard Risk Are or Would Be Score Score Conditions Risk Score Score Conditions Risk Significant 6 60 Moderate Significant 6 48 Low Moderate 6 36 Negligible Risk Negligible Risk 6 24 Negligible Risk v. Local Threats Based Approach Source protection committees had the option to identify local threats as significant where permission was given by the Director of the Source Protection Programs Branch. To be designated as a local threat, three main criteria must be met: 1) The source protection committee identified the activity as a potential threat to a municipal drinking water source. 2) In the opinion of the Director, the chemical hazard rating of the activity is greater than 4, or the pathogen hazard rating of the activity is greater than 4. 3) The risk score for the activity in the vulnerable area is greater than 40, calculated as outlined in the Technical Rules. Consult your local source protection plan to determine if your source protection committee was given permission to designate an activity as a local threat. Implementation Guide: Module 2 Understanding Where Policies Apply Page 39 of 89
40 Appendix 1 provides an example of a local threat in the Otonabee-Peterborough Source Protection Region. Implementation Guide: Module 2 Understanding Where Policies Apply Page 40 of 89
41 J. Putting It All Together- Steps for Identifying Threats and Applying Policies This section pieces together the information provided to determine if significant drinking water threats are present on a property. The process of determining whether an activity is a significant drinking water threat can be broken into seven key steps (Table 15). STEP 1 Identify the location of the property STEP 2 Identify whether the property is located in a vulnerable area STEP 3 Identify the vulnerability score STEP 4 Use screening checklist to determine which Significant Drinking Water Threats to screen for based on property type STEP 5 Complete appropriate significant drinking water threat questionnaires STEP 6 Confirm presence of Significant Drinking Water Threats STEP 7 Apply appropriate policy(ies) Figure 15: Steps in Identifying and Confirming Significant Drinking Water Threats Implementation Guide: Module 2 Understanding Where Policies Apply Page 41 of 89
42 The first three steps in determining if significant drinking water threats are present onsite involve identifying the location of the property in question in relation to vulnerable area and vulnerability score. Once the property location has been determined, confirm that the property is located within a vulnerable area where significant drinking water threats are possible. Under the Clean Water Act significant drinking water threats are only found within WHPAs, IPZs or an issue contributing area, which may include HVAs or SGRAs. Next, identify the vulnerability score. Within WHPAs and IPZs significant drinking water threats are possible anywhere the vulnerability score is 8 10, with the exception of the issue contributing area. Within the issue contributing area, significant drinking water threats are present anywhere a circumstance for the identified threat is met, regardless of the vulnerability score. Once the property location, vulnerable area and vulnerability score have confirmed that the property is located in an area where significant drinking water threats are possible, identify the significant drinking water threats for which you want to screen. Figure 16 identifies threats commonly found on parcels of land based on the property type. The screening chart groups property types into four broad categories: agricultural, residential, industrial / commercial / institutional, and municipal. Not every property will fall into the four broad classes exclusively. For example, agricultural properties can have a residence and an ancillary commercial business also onsite. If this is the case, you may have to screen by vulnerable area and vulnerability score. Figures 17 and 18 provide quick reference as to what threats are possible depending on the vulnerable area (WHPA or IPZ) vulnerability score. Once a list of threats to screen for has been narrowed down, the next step is to complete the appropriate significant drinking water threat questionnaires. Questionnaires for each of the 18 water quality drinking threats are located in Appendix 2. The questionnaires have been developed to obtain the information required to determine if a significant drinking water threat exists. Once the individual threat questionnaires have been completed, the next step is to compare the respondent s answers with the Provincial Tables of Threats and/or the Provincial Tables of Circumstances to determine if a significant drinking water threat exists. Section 9 (I) describes how to use the Tables of Threats and Tables of Circumstances. If the Tables of Threats and/or Circumstances confirm that a significant drinking water threat is present onsite, the last step is to apply the appropriate source protection plan policy. Contact your local source protection authority to obtain a copy. Implementation Guide: Module 2 Understanding Where Policies Apply Page 42 of 89
43 Industrial, Commercial, Institutional Threat Agricultural Operations Residential Properties 1a Untreated septage 1b Waste disposal sites 1c Mine tailings 2a Stormwater management Municipal Lands 2b Wastewater treatment plants/sewer systems 2c Onsite sewage systems 2d Industrial effluent 3 Application of agricultural source material to land 4 Storage of agricultural source material 6 Application of non-agricultural source material 7 Handling and storage of nonagricultural source material 8 Application of commercial fertilizer to land 9 Handling and storage of commercial fertilizer 10 Application of pesticides to land 11 Handling and storage of pesticides 12 Application of road salt 13 Handling and storage of road salt 14 Storage of snow 15 Handling and storage of fuel 16 Handling and storage of DNAPLs 17 Handling and storage of organic solvents 18 Aircraft de-icing 21 Livestock grazing, pasturing, outdoor confinement and farm-animal yards Figure 16: Screening Chart of Questionnaires to Complete by Property Type Implementation Guide: Module 2 Understanding Where Policies Apply Page 43 of 89

44 Figure 17: Flow Chart of Threats to Screen for Within a Wellhead Protection Area Based on Vulnerability Score Implementation Guide: Module 2 Understanding Where Policies Apply Page 44 of 89

45 Figure 18: Flow Chart of Threats to Screen for Within IPZ/WHPA-E Based on Vulnerability Score Implementation Guide: Module 2 Understanding Where Policies Apply Page 45 of 89
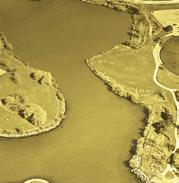
46 K. Case Study You should now have an understanding of the three components (vulnerable areas, vulnerability score, and threat activities) necessary to determine whether an activity is a significant drinking water quality threat. You can make use of the Tables of Drinking Water Threats or Tables of Circumstances to complete the following fictional exercise. Let s assume the Assessment Report indicates that an industrial property located at 123 Hall Street has the potential for several significant threats to drinking water. The Assessment Report further indicates that the two significant threat activities, which may be occurring are the handling and storage of an organic solvent (Threat #17), and the handling and storage of fuel (Threat #15). This section of the module will work through the process of determining whether a significant drinking water threat is present for the fictional property located at 123 Hall Street. Step 1: Identify the location of the property. Locate the property using digital mapping software. Figure 19 shows the location of the property outlined in turquoise. Figure 19: Case Study Property Location Implementation Guide: Module 2 Understanding Where Significant Threat Policies Apply Page 46 of 89
.")
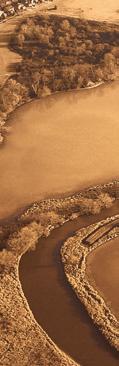
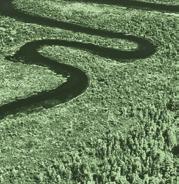
47 Step 2: Identify the location of the property in relation to vulnerable areas. Check whether the property is located within a vulnerable area where significant drinking water threats are possible (Figure 20). The technical mapping provided within the Assessment Report indicates that the property is located within a municipal WHPA in capture zone WHPA-A. Digital copies of the technical mapping for your area may already have been or will be provided by your local source protection authority and will also be available through the Ministry of the Environment s Open Portal. Figure 20: Property Location and Vulnerable Area Map Step 3: Identify the vulnerability score. Since the property in question is located within WHPA-A, the vulnerability score is 10 (Figure 21). It is possible to have multiple vulnerability scores located on one property, as the property may be located in more than one vulnerable area (WHPA-A and B). If this is the case, additional screening efforts to identify the presence of a significant drinking water threat may be required. Implementation Guide: Module 2 Understanding Where Significant Threat Policies Apply Page 47 of 89

48 Therefore, it will be important to note the location of the significant drinking water threat on the property. Use GPS coordinates to note the exact threat location. Figure 21: Property Location and Vulnerability Score Map Step 4: Use the screening chart to determine which questionnaires to complete. To complete this task you will need to use the significant drinking water threat screening chart (Figure 16). The screening chart identifies which threats are possible based on the property type where the activity is located. Figure 16 demonstrates that several potential significant drinking water threats are possible on an industrial property. You now need to reference the WHPA flowchart ( Figure 17) to determine which threats are possible on the property given the vulnerability score. Since the property is located where the vulnerability score is 10, all threats identified are possible significant threats and should be further investigated. If multiple vulnerability scores are present on the property, you will need to know where the potential significant drinking water threat is located onsite relative to the vulnerability score. For example, if a fuel tank is located in a WHPA on a property where the vulnerability score is both 10 and 8, you will need to know the location of the fuel tank to proceed. Noting the Implementation Guide: Module 2 Understanding Where Significant Threat Policies Apply Page 48 of 89
49 location of the threats by GPS coordinates will aid in the decision making process for identifying significant drinking water threats. If the tank is located where the vulnerability score is 10, there is potential for the fuel tank to be significant drinking water threat, and you will need to complete the questionnaire to determine if the circumstances to be a significant drinking water threat are met. If the fuel tank is located where the vulnerability score is 8, it is not possible for the fuel tank to pose a significant drinking water threat, however it may be a moderate or low threat. Step 5: Complete the appropriate significant drinking water threat questionnaires. The basic information gathered from the Assessment Report database, as well as the vulnerability score of the area where the property is located, has confirmed which significant drinking water threats are possible. Since there is potential for all water quality threats to be significant on the property, all surveys in Appendix 2 must be completed. You will need to work with the landowner or tenant (whoever is undertaking the activity) to fill out these questionnaires. This information is used in conjunction with the Ministry of the Environment s Tables of Drinking Water Threats and the Tables of Circumstances to confirm the presence of a significant drinking water threat. In this example, the completion of these surveys identifies that two significant drinking water threats are likely on the property; handling/storage of organic solvent, and handling/storage of fuel. Step 6: Confirm the presence of significant drinking water threat(s). To confirm whether the two activities taking place on the property are indeed significant drinking water threats, you need to refer to the Tables of Drinking Water Threats. The format of the Tables of Drinking Water Threats has already been described. Review: What you know: 1. the vulnerable area from Step 2 2. the vulnerability score from Step 3 3. information about the activity from Step 5 Using the feedback provided by the person engaging in the activity, you can confirm whether the circumstances described in Table 15 (Column 2) apply (circumstances for a significant threat related to the handling and storage of fuel). Implementation Guide: Module 2 Understanding Where Significant Threat Policies Apply Page 49 of 89
50 Table 15: Excerpt from the Tables of Drinking Water Threats Drinking Water Threats Reference Number Under the Following CIRCUMSTANCES Areas Within Vulnerable Areas Threat is Significant in Areas with a Vulnerability Score of Threat is Moderate in Areas with a Vulnerability Score of Threat is Low in Areas with a Vulnerability Score of Column 1 Column 2 Column 3 Column 4 Column 5 Column 6 The handling and IPZ-1, IPZ-2, storage of fuel IPZ-3, and The below grade handling of liquid fuel in relation to its storage at a bulk plant as defined in Section 1 of O. Reg. 217/01 (Liquid Fuels) made under the Technical Standards and Safety Act, 2000, or a facility that manufacturers or refines fuel. 2. The quantity of liquid fuel stored is more than 2,500 litres. 3. A spill of the fuel may result in the presence of BTEX in groundwater or surface water. WHPA-E WHPA-A, WHPA-B, WHPA-C, WHPA-C1, WHPA-D HVA 6 SGRA 6 Alternatively, you can simply refer to the Tables of Circumstances for chemicals in a WHPA with a vulnerability score of 10 (CW10S). Provincial Table (CW10S): Chemicals in a WHPA with a vulnerability score of 10 The handling and storage of fuel Table 16: Excerpt from Provincial Table of Circumstances Ref # Circumstances Chemical The storage of liquid fuel in a tank below grade and at a facility BTEX as defined in Section 1 of O. Reg. 213/01 (Fuel Oil) made under the Technical Standards and Safety Act, 2000 or a facility as defined in Section BTEX 1 of O. Reg. 217/01 (Liquid Fuels) made under the Technical Standards and Safety Act, 2000, but not including a bulk plant. 2. The fuel is stored in a quantity that is more than 250, but not more than 2,500 litres Petroleum Hydrocarbons F1(nC6 nc10) Implementation Guide: Module 2 Understanding Where Significant Threat Policies Apply Page 50 of 89
51 Step 7: Apply appropriate policy or policies. The Tables of Drinking Water Threats and the Tables of Circumstances have confirmed the Assessment Report threat enumeration two significant drinking water threats are occurring on the property: 1. handling and storage of an organic solvent, due to a manufacturing process, and 2. handling and storage of fuel, due to the presence of a back-up power generator. You should now reference your local source protection plan to confirm which policy(ies) apply to this property and then undertake the necessary steps to implement the policy(ies). The process of actual implementation of the policy(ies) is explained in future modules. Implementation Guide: Module 2 Understanding Where Significant Threat Policies Apply Page 51 of 89

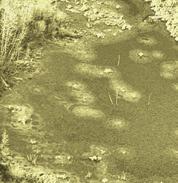
52 L. Appendix 1 - Detailed Local Threat Example Congregation of Waterfowl Within or Near Surface Water Bodies Table 17 provides an example of an activity, hazard rating and circumstances provided by the Director to determine when a local threat is considered significant. In this case, the threat is the congregation of waterfowl within or near surface water bodies in the Otonabee-Peterbrorough Source Protection Region. Table 17: Example of a Local Threat in the Ontonabee-Peterborough Region Activity Maintaining open areas of mown grass for recreational activities that promote the congregation of waterfowl within or near surface water bodies (for Lakefield and Peterborough IPZs). Circumstances that make the activity Hazard Rating a drinking water threat 10 Congregation of waterfowl results in discharge of pathogens in surface water in an area where there are known drinking water quality impacts from waterfowl within an IPZ. You will recall that a significant threat is determined through a combination of hazard rating and vulnerability score. In this instance, the congregation of waterfowl within or near surface water bodies has been identified as a local threat with a hazard rating of 10. Therefore, anywhere the vulnerability score is equal to or greater than 8, the activity would be considered a significant threat (8 x 10 = 80). Figure 22 illustrates the locations of the vulnerable areas (red and orange areas). Vulnerability Score 10 8 Figure 22: Locations Where Local Threat (Congregation of Waterfowl) Is or Would be Significant Implementation Guide: Module 2 Understanding Where Significant Threat Policies Apply Page 52 of 89
53 M. Appendix 2 Threat Screening Questionnaires Implementation Guide: Module 2 Understanding Where Significant Threat Policies Apply Page 53 of 89
54 Threat 1a Application of Untreated Septage to Land Contact Information Contact Name for Property: Property Owner: Property Address: Phone Number: Roll Number: Note: Please see the end of questionnaire for a unit conversion chart. Application and Storage of Nutrients (Managed Lands) 1. Is untreated septage applied to land on the property? Yes, please continue No 2. What is the approximate land area on the property where the untreated septage is applied? Less than 1 hectare 1-10 hectares More than 10 hectares Unit Conversion Chart Metric 1 hectare 2.47 acres 10 hectares acres 100 hectares acres Imperial Appendix 2 Threat Screening Surveys Page 54 of 89
55 Threat 1b Waste Disposal Sites Contact Information Contact Name for Property: Property Owner: Property Address: Phone Number: Roll Number: Note: Please see the end of questionnaire for a unit conversion chart. Waste Management 1. Is the property registered through Ontario s Hazardous Waste Information Network? Yes, please provide the registry number if known: No 2. Is the property registered as a waste receiver or waste generator through the MOE? Yes, please provide the registry number if known: No 3. Does the property have an MOE Environmental Compliance Approval/Certificate of Approval for waste storage or waste disposal? Yes, please specify Environmental Compliance Approval/Certificate of Approval type and number (e.g. hazardous waste storage): No Land Disposal 4. Is the property currently used for any of the following? (check all that apply) Please answer the additional question if you check any of the boxes. Land disposal of petroleum refining waste. If checked, what is the land/fill area? Less than 1 hectare Appendix 2 Threat Screening Surveys Page 55 of 89
56 1-10 hectares More than 10 hectares Land disposal of hazardous waste, liquid industrial waste, or processed liquid industrial waste. If checked, what is the land/fill area? Less than 1 heactare 1-10 hectares More than 10 hectares Land disposal of municipal waste. If checked, what is the land/fill area? Less than 1 heactare 1-10 hectares More than 10 hectares Land disposal of industrial or commercial waste. If checked, what is the land/fill area? Less than 1 heactare 1-10 hectares More than 10 hectares 5. Is the property used for land disposal of liquid industrial waste? Yes No, skip to next Section, PCB Waste 6. Are there injection wells for the disposal of liquid industrial waste on the property? Yes No, skip to next Section, PCB Waste 7. What is the combined injection rate of all injection wells on the property? Less than 380 m 3 /year 380 3,799 m 3 /year 3,800 37, 999 m 3 /year 38, ,999 m 3 /year 380,000 3,799,999 m 3 /year 3,800,000 to 37,999,999 m 3 /year More than 38, 000, 000 m 3 /year Appendix 2 Threat Screening Surveys Page 56 of 89
57 PCB Waste 8. Is the property used to store or dispose of PCB waste? Yes No, skip to next Section, Hazardous or Liquid Industrial Waste 9. How is the PCB waste stored? In a facility or engineered cell below grade In drums, located at or above grade In a storage tank(s) located below grade In a storage tank(s) located partially below grade Outdoors, not in a container Other a. Please specify container: b. Where is it stored? (Check all that apply) Above grade Below grade Partially above and below grade Hazardous or Liquid Industrial Waste 10. Are you subject to the Toxics Reduction Act? Yes, please continue questionnaire No, skip to question 12 Not sure 11. Do you have a Toxics Reduction Plan? Yes No Not sure 12. Is hazardous waste or liquid industrial waste stored on the property? Yes, please continue questionnaire No, questionnaire has been completed. 13. Where is it stored? (check all that apply) Above grade Below grade Partially above and below grade Appendix 2 Threat Screening Surveys Page 57 of 89
58 14. Does the property store or handle small quantities of any of the following hazardous or liquid industrial wastes? (check all that apply) Please answer the additional questions if you check any of the boxes. Waste that is a hazardous industrial waste, hazardous waste chemical, ignitable waste, corrosive waste, leachate toxic waste or reactive waste and that is produced in any month in an amount less than 5 kilograms or otherwise accumulated in an amount less than 5 kilograms. If checked, where is the waste stored or handled? (check all that apply) Above grade Below grade Partially above and below grade If checked, does the waste contain arsenic, cadmium, mercury, or chromium VI? Yes No Waste that is an acute hazardous waste chemical and that is produced in any month in an amount less than 1 kilogram or otherwise accumulated in an amount less than 1 kilogram. If checked, where is the waste stored or handled? (check all that apply) Above grade Below grade Partially above and below grade If checked, does the waste contain arsenic, cadmium, mercury, or chromium VI? Yes No An empty container or the liner from an empty container that contained hazardous industrial waste, hazardous waste chemical, ignitable waste, corrosive waste, leachate toxic waste or reactive waste. If checked, where is the waste stored or handled? (check all that apply) Above grade Below grade Partially above and below grade If checked, does the waste contain arsenic, cadmium, mercury, or chromium VI? Yes No An empty container of less than 20 litres capacity or 1 or more liners weighing, in total, less than 10 kilograms from empty containers, that contained acute hazardous waste chemical. If checked, where is the waste stored or handled? (check all that apply) Above grade Appendix 2 Threat Screening Surveys Page 58 of 89
59 Below grade Partially above and below grade If checked, does the waste contain arsenic, cadmium, mercury, or chromium VI? Yes No The residues or contaminated materials from the cleanup of a spill of less than 5 kilograms of waste that is a hazardous industrial waste, hazardous waste chemical, ignitable waste, corrosive waste, leachate toxic waste or reactive waste. If checked, where is the waste stored or handled? (check all that apply) Above grade Below grade Partially above and below grade If checked, does the waste contain arsenic, cadmium, mercury, or chromium VI? Yes No The residues or contaminated materials from the cleanup of a spill of less than 1 kilogram of waste that is an acute hazardous waste chemical. If checked, where is the waste stored or handled? (check all that apply) Above grade Below grade Partially above and below grade If checked, does the waste contain arsenic, cadmium, mercury, or chromium VI? Yes No Liquid industrial waste that is produced in any month in an amount less than 25 litres or otherwise accumulated in an amount less than 25 litres. If checked, where is the waste stored or handled? (check all that apply) Above grade Below grade Partially above and below grade If checked, does the waste contain arsenic, cadmium, mercury, or chromium VI? Yes No 15. Is hazardous waste or liquid industrial waste stored on the property? Yes, please continue questionnaire No, questionnaire has been completed. Appendix 2 Threat Screening Surveys Page 59 of 89
60 16. How many of each of the following types of wells are on the property? If you do not have a type of well please print 0. Type of Well Industrial Use Wells Unused Wells Irrigation Wells Dewatering wells Drinking Water Wells Geothermal Wells Monitoring Wells Drywell or Soakaway Pit Other: Other: Other: # of Wells Unit Conversion Charts Metric 1 litre 0.22 gallons 25 litres 5.5 gallons 50 litres 11 gallons 250 litres 55 gallons 2500 litres 550 gallons Imperial Metric 1 hectare 2.47 acres 10 hectares acres 100 hectares acres Imperial Appendix 2 Threat Screening Surveys Page 60 of 89
61 Threat 1c Mine Tailings Contact Information Contact Name for Property: Property Owner: Property Address: Phone Number: Roll Number: 1. Are tailings from mining operations stored on the property? Yes, please continue questionnaire No 2. How are the tailings typically stored on the property? (check all that apply) In a pit In an impoundment structure 3. Is the property required to report to the National Pollutant Release Inventory? Yes No Appendix 2 Threat Screening Surveys Page 61 of 89
62 Threat 2a Stormwater Management Contact Information Contact Name for Property: Property Owner: Property Address: Phone Number: Roll Number: Note: Please see the end of questionnaire for a unit conversion chart. Stormwater 1. Does the property have a stormwater management facility? Yes, please continue questionnaire No 2. What is the drainage area serviced by the facility? Less than 1 hectare 1 to 9 hectares 10 to 100 hectares More than 100 hectares Unit Conversion Charts Metric Imperial 1 hectare 2.47 acres 10 hectares acres 100 hectares acres Appendix 2 Threat Screening Surveys Page 62 of 89
63 Threat 2b Waste water Treatment Plants/Sewer Systems Contact Information Contact Name for Property: Property Owner: Property Address: Phone Number: Roll Number: Sanitary Sewage The following questions ask about sanitary sewage systems. Note that if more than one system (of the same type) is present on the property, you need to fill in the combined capacity of all systems. 1. Does the property have a privately-owned or operated sewage system that discharges untreated or partially treated sewage into the municipal sanitary sewer, or that is not connected to the municipal sewer system? Note that this includes sewage holding tanks or treatment tanks, but does not include plumbing features such as toilets or pipes. Yes, please continue questionnaire No, skip to question 4 2. Does the system include a designed bypass to divert extra flow due to higher volume/higher flow events? Yes No Designed bypass means an intentional diversion of wastewater from the wastewater system, from any portion of a pre-treatment facility prior to completing pre-treatment, or from any industrial process or other source of wastewater prior to pre-treatment (i.e. during periods of high volume, some wastewater may bypass the wastewater treatment and flow directly to the sewer system, sewer or surface water). 3. What is the designed conveyance capacity of the sewage system? Less than 250 m 3 /day Appendix 2 Threat Screening Surveys Page 63 of 89
64 m 3 /day 1,000 9,999 m 3 /day 10, ,000 m 3 /day More than 100,000 m 3 /day 4. Does the system have a wastewater treatment tank or storage tank? Yes, treatment tank Yes, storage tank No, fill out the On-Site Sewage Systems questionnaire 5. What is the designed capacity of the tank? Note: if more than one tank is present indicate the total capacity of all tanks. Less than 500 m 3 /day 2,050 2,499 m 3 /day 2,500 17,499 m 3 /day 17,500 50,000 m 3 /day More than 50,000 m 3 /day 6. Does the tank(s) service more than 1 property? Yes No 7. The tank(s) is: (check all that apply) Above grade Below grade Partially above and below grade Appendix 2 Threat Screening Surveys Page 64 of 89
65 Threat 2c On-site Sewage Systems Contact Information Contact Name for Property: Property Owner: Property Address: Phone Number: Roll Number: Note: Please see the end of questionnaire for a unit conversion chart. 1. Does the property have a septic system, outhouse, earth-pit privy, privy vault, greywater system, cesspool, or leaching bed systems? Yes No 2. Does the property have a sewage system that uses a holding tank for hauled sewage? Yes No 7. What is the capacity of the system? If you have more than 1 system on the property, indicate the total combined capacity of all systems. Less than 10,000 L/day More than 10,000 L/day 8. Is the system servicing more than one property? Yes No Appendix 2 Threat Screening Surveys Page 65 of 89
66 Unit Conversion Chart Metric Imperial 1 litre 0.22 gallons 25 litres 5.5 gallons 50 litres 11 gallons 250 litres 55 gallons 2500 litres 550 gallons Appendix 2 Threat Screening Surveys Page 66 of 89
67 Threat 2d Industrial Effluent Contact Information Contact Name for Property: Property Owner: Property Address: Phone Number: Roll Number: 1. Does the property have an on-site industrial sewage system? Yes, please continue questionnaire No 2. Does the system discharge to surface water? Yes No 3. Is the property required to report to the National Pollutant Release Inventory? Yes No 4. Please list the chemicals discharged to surface water. Appendix 2 Threat Screening Surveys Page 67 of 89
68 Threats 3, 4 and 5 Agricultural Source Material Contact Information Contact Name for Property: Property Owner: Property Address: Phone Number: Roll Number: Application, Handling and Storage of Agricultural Source Material (Manure) This Section asks about application, handling and storage of manure (liquid or solid) on the property. The Source Water Protection program refers to manure as Agricultural Source Material (ASM). 1. Is manure applied to land on the property? Yes, please state to what percentage of the property it is applied % No 2. What is the approximate land area where agricultural source materials were applied on the property in the last year? Less than 1 hectare hectares hectares More than 100 hectares 3. Is manure stored on the property? Yes, please continue questionnaire No, skip to question 5 4. How is the manure typically stored? (check all that apply) Permanent nutrient storage facility located at or above grade Permanent nutrient storage facility located partially below grade Permanent nutrient storage facility located below grade Temporary field nutrient storage site located at or above grade Appendix 2 Threat Screening Surveys Page 68 of 89
69 Temporary field nutrient storage site located below grade 5. Is any part of the property currently used for aquaculture? Yes No Unit Conversion Charts Metric Imperial 1 litres 0.26 gallons 25 litres 6.6 gallons 50 litres 13 gallons 250 litres gallons 2500 litres gallons Metric 1 hectare 2.47 acres 10 hectares acres 100 hectares acres Imperial Appendix 2 Threat Screening Surveys Page 69 of 89
70 Threats 6 & 7 Non Agricultural Source Material (NASM) Contact Information Contact Name for Property: Property Owner: Property Address: Phone Number: Roll Number: Application, Handling and Storage of NASM This questionnaire asks about Non-Agricultural Source Material (NASM) that may be on your property. NASM refers to biosolids from outside sources, including sewage treatment facilities, pulp and paper mills, and food processing operations. 1. Is non-agricultural source material applied to land on the property? Yes, please state to what percentage of the property it is applied % No 2. What is the approximate land area where non- agricultural source materials were applied on the property in the last year? Less than 1 hectare hectares hectares More than 100 hectares 3. If nutrients are applied to less than 100% of the property, please give a brief description of the areas to which nutrients are NOT applied: Application, Handling and Storage of NASM 5. In the last 10 years, was any NASM stored on the property? Yes, please continue questionnaire Appendix 2 Threat Screening Surveys Page 70 of 89
71 No 6. How is the NASM typically stored? (check all that apply) Permanent nutrient storage facility located at or above grade Permanent nutrient storage facility located partially below grade Permanent nutrient storage facility located below grade Temporary field nutrient storage site located at or above grade Temporary field nutrient storage site located below grade 7. How much nitrogen is typically contained in the stored NASM? Less than 0.5 tonnes tonnes More than 5 tonnes Unknown 8. Do you have a NASM Plan? Yes, please provide the Reference number No Appendix 2 Threat Screening Surveys Page 71 of 89
72 Threats 8 & 9 Commercial Fertilizer Contact Information Contact Name for Property: Property Owner: Property Address: Phone Number: Roll Number: Note: Please see the end of questionnaire for a unit conversion chart. Application of Commercial Fertilizer 1. Is commercial fertilizer applied to land on the property? Yes, applied by outsourced contractor. Please state to what percentage of the property it is applied % Yes, applied by property owner/tenant. Please state to what percentage of the property it is applied % No Handling and Storage of Commercial Fertilizer 2. Is commercial fertilizer stored on the property? Yes, please continue questionnaire No 3. What is the purpose of fertilizer stored on the property? (check all that apply) Please answer the additional questions if you check any of the boxes. Stored for use on the property? If checked, what is the quantity of fertilizer stored on the property? Less than 25 kg kg 250-2,500 kg More than 2,500 kg Appendix 2 Threat Screening Surveys Page 72 of 89
73 Sold wholesale on the property? If checked, what is the quantity of fertilizer stored on the property? Less than 25 kg kg 250-2,500 kg More than 2,500 kg Sold for retail on the property? If checked, what is the quantity of fertilizer stored on the property? Less than 25 kg kg 250-2,500 kg More than 2,500 kg Manufactured and/or processed on the property? If checked, what is the quantity of fertilizer stored on the property? Less than 25 kg kg 250-2,500 kg More than 2,500 kg 4. What is the typical nitrogen content in the fertilizer? Less than 5% 5 25% More than 25% 5. What is the typical phosphorus content in the fertilizer? Less than 5% 5 25% More than 25% Unit Conversion Chart Kilograms Pounds 1 kilogram 2.20 pounds 25 kilograms 55.1 pounds 250 kilograms pounds 2500 kilograms pounds Appendix 2 Threat Screening Surveys Page 73 of 89
74 Threats 10 & 11 Pesticides Contact Information Contact Name for Property: Property Owner: Property Address: Phone Number: Roll Number: Note: Please see the end of questionnaire for a unit conversion chart. Application, Handling and Storage of Pesticides 1. In the past year, were pesticides applied to land on the property? Yes, applied by outsourced contractor Yes, applied by property owner/tenant No, skip to question 4 2. What is the approximate land area where pesticides were applied on the property in the past year? Less than 1 hectare hectares hectares More than 100 hectares 3. Does the pesticide applied on the property contain any of the following ingredients? (check all that apply) Atrazine Dicamba Dichlorophenoxy Acetic Acid (2,4-D) Dichloropropene-1,3 Glyphosate Atrazine MCPA (2-methyl-4-chlorophenoxy acetic acid) Mecoprop Appendix 2 Threat Screening Surveys Page 74 of 89
75 Metalaxyl Metolachlor or s-metolachlor Pendimethalin MCPB (2-methylphenoxy) butanoic acid Other Unknown None of these 4. Are pesticides stored on the property? Yes, please continue questionnaire No 5. What is the purpose of pesticide storage on the property? (check all that apply) Pesticides are stored for use on the property Pesticides are sold for retail on the property Pesticides are sold wholesale on the property Pesticides are manufactured/processed on the property 6. Does the pesticide stored on the property contain any of the following ingredients? (check all that apply) Atrazine Dicamba Dichlorophenoxy Acetic Acid (2,4-D) Dichloropropene-1,3 Glyphosate Atrazine MCPA (2-methyl-4-chlorophenoxy acetic acid) Mecoprop Metalaxyl Metolachlor or s-metolachlor Pendimethalin MCPB (2-methylphenoxy) butanoic acid Other Unknown None of these Appendix 2 Threat Screening Surveys Page 75 of 89
76 Unit Conversion Chart Metric US Standard Units 1 hectare 2.47 acres 10 hectares acres 100 hectares acres Appendix 2 Threat Screening Surveys Page 76 of 89
77 Threats 12 & 13 Road Salt Contact Information Contact Name for Property: Property Owner: Property Address: Phone Number: Roll Number: Note: Please see the end of questionnaire for a unit conversion chart. Road Salt and Winter Salt Storage and Application 1. Do you use any salt for de-icing on the property? Yes, please continue questionnaire No, skip to question 4 2. How much salt is applied in a typical year? Less than 25 kilograms kilograms kilograms More than 250 kilograms 3. Is the salt managed by an outside hired contractor or company? Yes No 4. Are any alternative salt application practices used? (check all that apply) Anti-icing liquid Pre-wetting (e.g. beet juice) Reduced chloride Pickled sand Chloride-free products (e.g. Calcium Magnesium Acetate) Other, please specify Appendix 2 Threat Screening Surveys Page 77 of 89
78 None 5. Do you store salt for de-icing on the property? Yes, please continue questionnaire No 6. What quantity of salt is stored? Less than 500 tonnes 500 5,000 tonnes More than 5,000 tonnes 7. How is the salt stored? (check all that apply) In a manner that allows exposure to precipitation, or runoff from precipitation or snow melt In a salt dome or other facility to prevent exposure to runoff and precipitation In manufacturer s package, indoors (e.g., garage or shed) Unit Conversion Chart Kilograms Pounds 1 kilogram 2.20 pounds 25 kilograms 55.1 pounds 250 kilograms pounds 2500 kilograms pounds Appendix 2 Threat Screening Surveys Page 78 of 89
79 Threat 14 Storage of Snow Contact Information Contact Name for Property: Property Owner: Property Address: Phone Number: Roll Number: Snow Storage 1. Is any part of the property used to store snow collected from roads or other paved areas located on a different property? Yes, from public roads, please continue questionnaire Yes, from private properties, please continue questionnaire Yes, from public roads and private properties, please continue questionnaire No 2. What is the approximate land area on the property used to store the snow? Less than 0.01 hectares hectares hectares 1 5 hectares More than 5 hectares 3. Where is the snow stored? Above grade Below grade (e.g. in a pit or quarry) Both Appendix 2 Threat Screening Surveys Page 79 of 89
80 Unit Conversion Chart Metric US Standard Units 1 hectare 2.47 acres 10 hectares acres 100 hectares acres Appendix 2 Threat Screening Surveys Page 80 of 89
81 Threat 15 Handling and Storage of Fuel Contact Information Contact Name for Property: Property Owner: Property Address: Phone Number: Roll Number: Note: Please see the end of questionnaire for a unit conversion chart. 1. Are any of the following types of liquid fuel used or stored on the property? (check all that apply) Please answer the additional questions if you check any of the boxes. Gasoline. What is the maximum quantity of fuel stored on the property at any one time? (check only one) Less than 25 litres (e.g. Jerry can) litres (up to 1 drum) 250-2,500 litres (at least 1 drum, up to 1 tank) More than 2,500 litres (more than 1 tank) How is the fuel stored? (Check all that apply) Above ground tank Underground tank (includes basement tanks) Portable container Diesel. What is the maximum quantity of fuel stored on the property at any one time? (check only one) Less than 25 litres (e.g. Jerry can) litres (up to 1 drum) 250-2,500 litres (at least 1 drum, up to 1 tank) More than 2,500 litres (more than 1 tank) How is the fuel stored? (Check all that apply) Above ground tank Underground tank (includes basement tanks) Portable container Heating oil/fuel oil. What is the maximum quantity of fuel stored on the property at any one time? (check only one) Appendix 2 Threat Screening Surveys Page 81 of 89
82 Less than 25 litres (e.g. Jerry can) litres (up to 1 drum) 250-2,500 litres (at least 1 drum, up to 1 tank) More than 2,500 litres (more than 1 tank) How is the fuel stored? (Check all that apply) Above ground tank Underground tank (includes basement tanks) Portable container Used oil/waste oil. What is the maximum quantity of fuel stored on the property at any one time? (check only one) Less than 25 litres (e.g. Jerry can) litres (up to 1 drum) 250-2,500 litres (at least 1 drum, up to 1 tank) More than 2,500 litres (more than 1 tank) How is the fuel stored? (Check all that apply) Above ground tank Underground tank (includes basement tanks) Portable container Other (please specify). What is the maximum quantity of fuel stored on the property at any one time? (check only one) Less than 25 litres (e.g. Jerry can) litres (up to 1 drum) 250-2,500 litres (at least 1 drum, up to 1 tank) More than 2,500 litres (more than 1 tank) How is the fuel stored? (Check all that apply) Above ground tank Underground tank (includes basement tanks) Portable container Unit Conversion Chart Metric 1 litre 0.22 gallons 25 litres 5.5 gallons 50 litres 11 gallons 250 litres 55 gallons Imperial 2500 litres 550 gallons Appendix 2 Threat Screening Surveys Page 82 of 89
83 Threat 16 Handling and storage of Dense Non Aqueous Phase Liquids (DNAPLs) Contact Information Contact Name for Property: Property Owner: Property Address: Phone Number: Roll Number: Note: Please see the end of questionnaire for a unit conversion chart. Chemical Storage and Handling 1. Are any of the following chemical products used or stored on the property? (check all that apply) Please answer the additional three questions if you check any of the boxes. Degreasers (e.g. acetone, methyl hydrate) not containing chlorinated solvents. What is the maximum quantity of chemical products stored on the property at any one time? (check only one) Less than 25 litres (e.g. Jerry can) litres (up to 1 drum) 250-2,500 litres (at least 1 drum, up to 1 tank) More than 2,500 litres (more than 1 tank) Please print the trade name or chemical name of the product used most often in this category: How are the chemical products stored? (Check all that apply) Above ground tank Underground tank (includes basement tanks) Portable container Paints/paint thinners (e.g. Varsol, Turpentine). What is the maximum quantity of chemical products stored on the property at any one time? (check only one) Less than 25 litres (e.g. Jerry can) litres (up to 1 drum) 250-2,500 litres (at least 1 drum, up to 1 tank) More than 2,500 litres (more than 1 tank) Appendix 2 Threat Screening Surveys Page 83 of 89
84 Please print the trade name or chemical name of the product used most often in this category: How are the chemical products stored? (Check all that apply) Above ground tank Underground tank (includes basement tanks) Portable container Enamels/lacquers (e.g. Varathane, Hydrocote). What is the maximum quantity of chemical products stored on the property at any one time? (check only one) Less than 25 litres (e.g. Jerry can) litres (up to 1 drum) 250-2,500 litres (at least 1 drum, up to 1 tank) More than 2,500 litres (more than 1 tank) Please print the trade name or chemical name of the product used most often in this category: How are the chemical products stored? (Check all that apply) Above ground tank Underground tank (includes basement tanks) Portable container Adhesives/glues (e.g. Epoxy, Polyurethane). What is the maximum quantity of chemical products stored on the property at any one time? (check only one) Less than 25 litres (e.g. Jerry can) litres (up to 1 drum) 250-2,500 litres (at least 1 drum, up to 1 tank) More than 2,500 litres (more than 1 tank) Please print the trade name or chemical name of the product used most often in this category: How are the chemical products stored? (Check all that apply) Above ground tank Underground tank (includes basement tanks) Portable container Resins (e.g. PVC Resin, Urea Formaldehyde). What is the maximum quantity of chemical products stored on the property at any one time? (check only one) Less than 25 litres (e.g. Jerry can) litres (up to 1 drum) 250-2,500 litres (at least 1 drum, up to 1 tank) More than 2,500 litres (more than 1 tank) Please print the trade name or chemical name of the product used most often in this category: How are the chemical products stored? (Check all that apply) Appendix 2 Threat Screening Surveys Page 84 of 89
85 Above ground tank Underground tank (includes basement tanks) Portable container Furniture strippers (e.g. Acetone, Toluene, Turpentine). What is the maximum quantity of chemical products stored on the property at any one time? (check only one) Less than 25 litres (e.g. Jerry can) litres (up to 1 drum) 250-2,500 litres (at least 1 drum, up to 1 tank) More than 2,500 litres (more than 1 tank) Please print the trade name or chemical name of the product used most often in this category: How are the chemical products stored? (Check all that apply) Above ground tank Underground tank (includes basement tanks) Portable container Chlorinated solvents (e.g. Trichloroethylene (TCE), Perchloroethylene (PCE)). What is the maximum quantity of chemical products stored on the property at any one time? (check only one) Less than 25 litres (e.g. Jerry can) litres (up to 1 drum) 250-2,500 litres (at least 1 drum, up to 1 tank) More than 2,500 litres (more than 1 tank) Please print the trade name or chemical name of the product used most often in this category: How are the chemical products stored? (Check all that apply) Above ground tank Underground tank (includes basement tanks) Portable container PCB liquids or fluids. What is the maximum quantity of chemical products stored on the property at any one time? (check only one) Less than 25 litres (e.g. Jerry can) litres (up to 1 drum) 250-2,500 litres (at least 1 drum, up to 1 tank) More than 2,500 litres (more than 1 tank) Please print the trade name or chemical name of the product used most often in this category: How are the chemical products stored? (Check all that apply) Appendix 2 Threat Screening Surveys Page 85 of 89
86 Above ground tank Underground tank (includes basement tanks) Portable container Creosote. What is the maximum quantity of chemical products stored on the property at any one time? (check only one) Less than 25 litres (e.g. Jerry can) litres (up to 1 drum) 250-2,500 litres (at least 1 drum, up to 1 tank) More than 2,500 litres (more than 1 tank) Please print the trade name or chemical name of the product used most often in this category: How are the chemical products stored? (Check all that apply) Above ground tank Underground tank (includes basement tanks) Portable container Other (please specify chemical name). What is the maximum quantity of chemical products stored on the property at any one time? (check only one) Less than 25 litres (e.g. Jerry can) litres (up to 1 drum) 250-2,500 litres (at least 1 drum, up to 1 tank) More than 2,500 litres (more than 1 tank) Please print the trade name or chemical name of the product used most often in this category: How are the chemical products stored? (Check all that apply) Above ground tank Underground tank (includes basement tanks) Portable container Unit Conversion Chart Metric 1 litre 0.22 gallons 25 litres 5.5 gallons 50 litres 11 gallons 250 litres 55 gallons 2500 litres 550 gallons Imperial Appendix 2 Threat Screening Surveys Page 86 of 89
87 Threat 17 Handling and Storage of Organic Solvents Contact Information Contact Name for Property: Property Owner: Property Address: Phone Number: Roll Number: Note: Please see the end of questionnaire for a unit conversion chart. Chemical Storage, Handling and Disposal 1. Do you store or handle organic solvents on the property? Yes, please continue questionnaire No 2. Do you store or handle more than 25 litres of the following organic solvents on the property: Wood preservative such as creosote or CCA? Paint stripper / degreaser Cleaning agent/ refrigerant Chloroform (historically used as an anesthetic, now as dyes, cleaning agent) Yes, please state how much is stored (litres) No Unsure Appendix 2 Threat Screening Surveys Page 87 of 89
88 Threat 18 Aircraft De-icing Contact Information Contact Name for Property: Property Owner: Property Address: Phone Number: Roll Number: Management of Runoff that Contains Chemicals used in the De-icing of Aircraft 1. Is the airport classified as: Remote Small Regional-continue 2. Is there an opportunity for run-off containing de-icing materials to discharge to land or water? Yes No Appendix 2 Threat Screening Surveys Page 88 of 89

89 Threat 21 Livestock Contact Information Contact Name for Property: Property Owner: Property Address: Phone Number: Roll Number: Use of Land as Livestock, Grazing or Pasturing; an Outdoor Confinement Area; or a Farm Animal Yard 1. Are livestock and/or poultry raised on the property? Yes, please fill in the table below No, skip to question 2 Please indicate the total number of each type of livestock and/or poultry on the property. Type of Livestock # of Livestock Beef cattle Horses Sheep Ducks Dairy cattle Chicken Turkeys Goats Swine Other: Other: 2. What is the total percentage of the property that is used for livestock grazing, pasture lands and outdoor confinement? % Appendix 2 Threat Screening Surveys Page 89 of 89