City of Portsmouth Wastewater Division. Wastewater Facilities and Programs. City Council Briefing and Public Input Session
|
|
|
- Lorin Bradley
- 5 years ago
- Views:
Transcription
1 City of Portsmouth Wastewater Division Wastewater Facilities and Programs City Council Briefing and Public Input Session Briefing #2 June 11, 2012 November 8, 2011

2 Topics for Discussion Introduction Regulatory Framework and Issues Collection System Wastewater Treatment Facilities Funding Questions and Comments


3 Regulatory Framework and Issues NPDES Permit Status US House Over-sight Hearing Status of Legal Actions
4 Lincoln Area Contract 3A
5 Lincoln Area Contract 3B
6 Cass Street Sewer Separation
7 Contract 3A - Initial Results S. Mill Pond CSOs April 22, 2012 Storm - Before Completion of Contract 3A June 2, 2012 Storm - After Completion of Contract 3A Rain 3.12 inches 3.45 inches CSO Volume Million Gallons 1.28 Million Gallons ~53% Reduction in CSO volume
8 Collection System
9 Collection System

10 Wastewater Treatment Facility
11 Wastewater Master Plan Preferred Alternative Preferred Alternative Phased Expansion at Pease WWTF EPA/NHDES Response to Draft WMP Preferred Alternative Phased approach does not achieve secondary treatment for Consent Decree compliance quickly enough EPA pushing to achieve secondary treatment for Peirce Island flows in next 5-7 years Affordability issues do not warrant spreading the project out over 20 years Pilot Effort
12 Piloting Outline Initial technology selection Pilot description Key observations to date Pilot timeline Key regulatory issues Process layouts Consent Decree dates
13 Existing Treatment Process Raw Wastewater Outfall To Piscataqua River Grit Chambers Chlorine Contact Tanks Primary Clarifiers
14 Conventional Secondary Treatment Process Return Activated Sludge Raw Wastewater Grit Chambers Outfall To Piscataqua River Chlorine Contact Tanks Primary Clarifiers Final Clarifiers Aeration Tanks

15 Conventional Secondary Treatment Layout
16 Nitrogen Removal to 8 mg/l Layout Sec. Treatment
17 Pilot Program Goals Pilot test the most promising technologies with Portsmouth's wastewater to: Best meet Portsmouth specific sizing criteria (i.e. fit within fence line of existing plant) Minimize capital and operational cost Ability to meet current and future permit limits Push the technologies to assess how each responds to high flows and loadings Gain insight into operational requirements and other factors for each technology
18 Option Evaluation Matrix Option 1 - BAF Option 2 - SBR w/ BioMag (Not Feasible) Option 3 - CAS w/ BioMag Option 4 - MBBR & ActiFlo Option 5 - MBBR & CoMag Option 6 - MBBR & DAF Option 7 - MBR Option 8 - Conventional Activated Sludge Evaluation Criteria Weight Rating Score Rating Score Rating Score Rating Score Rating Score Rating Score Rating Score Rating Score Operational Track Record/Established Process Operability (No. of Processes/Complexity of Processes) Ability to Retrofit Conv. Secondary Treatment Meet Future Nitrogen Limits of 8 mg/l Ability to Retrofit TN 8 to Meet Future Nitrogen Limits of 5/3 mg/l Constructability Site Layout Hydraulic Complexity Ability to Stay Within Fence Line for Secondary Treatment Ability to Stay Within Fence Line for Future TN Treatment Ability to Treat High FOG Levels Total Weighted Criteria Capital Cost (estimated - in millions) $33.0 $37.0 $32.0 $34.0 $32.0 $42.0 $39.0 Value Ratio (criteria/capital cost) Life Cycle Cost (in millions) $40.8 $46.7 $41.2 $47.4 $39.7 $53.3 $46.8 Value Ratio (criteria/ life cycle cost)
 ballast that is 5.")

19 BioMag Conventional activated sludge with BioMag iron ore (magnetite) ballast that is 5.2 times the weight of water Conventional clarification at higher loading rates Magnetite feed & recovery equipment Proprietary process Siemens (Formerly Cambridge Water Technologies)

 IDI: clay shale media")
20 BAF (Biologically Aerated Filters) Upflow packed bed filter Treatment and clarification in one vessel Backwash required Two main vendors: Kruger: polystyrene media (floats) IDI: clay shale media (sinks)


21 Moving Bed Bioreactor Media suspended in reactor basin No return sludge High rate solids separation Dissolved air flotation Many vendors
22 Pilot Timeline Fall 2011 Secure vendor equipment and construct pilot units January, 2012 Pilot operation start-up February Through April, 2012 Conduct secondary treatment experimental trials May/June, 2012 Conduct nitrogen removal and hydraulic stress test experimental trials July through September, 2012 Analyze data and update Technology Selection Memorandum October 1, 2012 Submit Technology Selection Memorandum to regulatory agencies
23 Key Observations to Date Raw Wastewater: Influent organic loading variability Large component of influent organic loading is in the soluble form Influent nitrogen concentrations lower than originally estimated

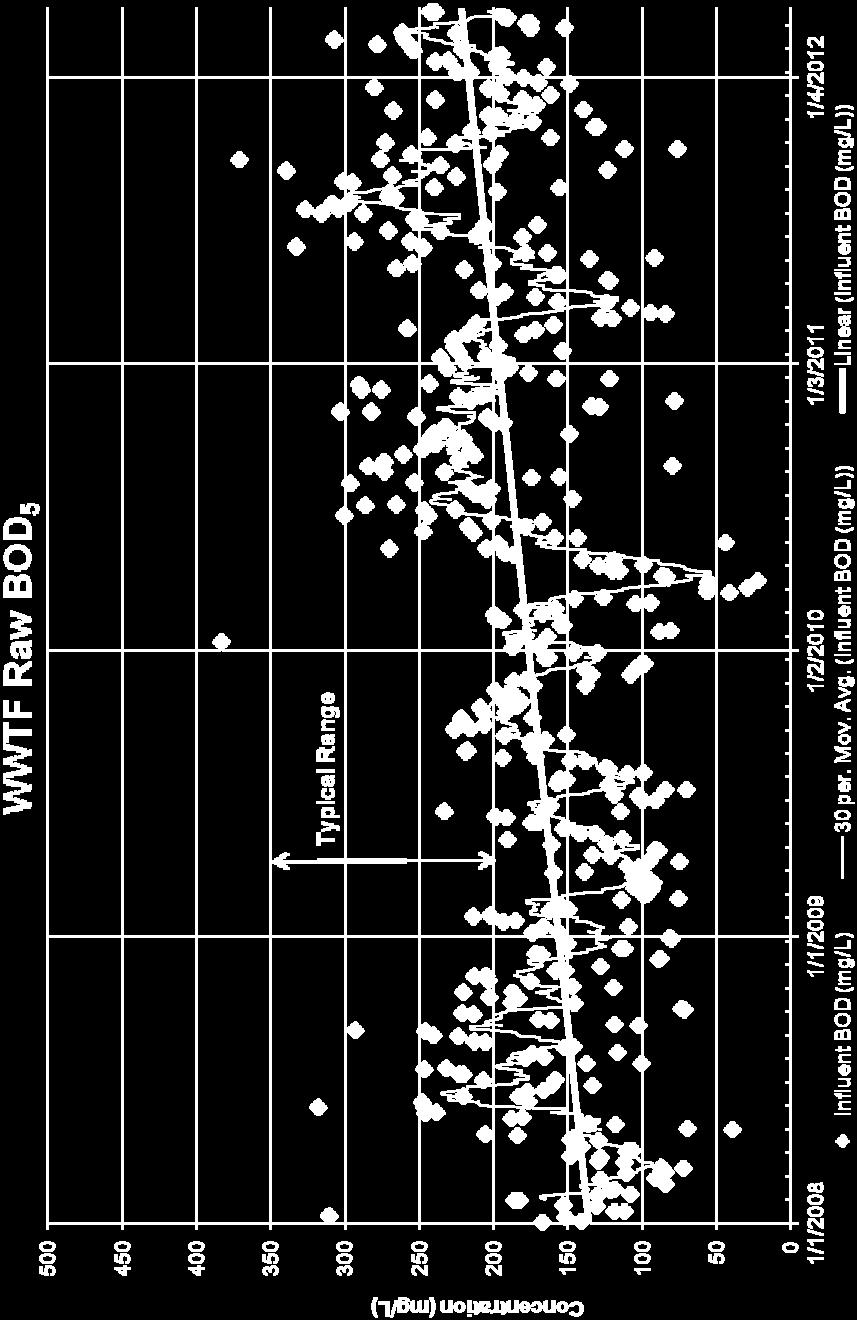
24 Raw Wastewater BOD Concentration

25 Key Observations to Date Raw Wastewater: Influent organic loading variability Large component of influent organic loading is in the soluble form Influent nitrogen concentrations lower than originally estimated


26 Key Observations to Date CAS With BioMag: Settling of Magnetite Minimize handling of Magnetite Requires careful operator attention


27 Key Observations to Date MBBR & DAF: Biomass Growth Period for Secondary Treatment of about 6-8 Weeks Quality Assurance of Media Series Reactors


28 Key Observations to Date BAF: Biomass growth period for secondary treatment of about 3-4 weeks Nitrifier growth stage slower than other processes System is highly automated
29 Pilot Experimental Trial Status Pilot Configuration Experimental Trial Status Secondary BioMag Average Daily Flow Complete Secondary MBBR/DAF Average Daily Flow Complete Secondary BioMag Maximum Month Flow Complete Secondary MBBR/DAF Maximum Month Flow Complete Secondary BAF Maximum Month Flow Complete Nitrogen Removal to 8 mg/l BioMag Maximum Month Flow Complete Nitrogen Removal to 8 mg/l MBBR/DAF Maximum Month Flow Complete Nitrogen Removal to 8 mg/l BAF Maximum Month Flow Pending Nitrogen Removal to 8 mg/l BioMag Hydraulic Stress Ongoing Nitrogen Removal to 8 mg/l MBBR/DAF Hydraulic Stress Ongoing Nitrogen Removal to 8 mg/l BAF Hydraulic Stress Pending Nitrogen Removal to 8 mg/l BioMag Nitrogen Stress Pending Nitrogen Removal to 8 mg/l MBBR/DAF Nitrogen Stress Pending Nitrogen Removal to 8 mg/l BAF Nitrogen Stress Pending
30 Key Regulatory Questions Peirce Island WWTF: Will Peak Design Flow Be 7.62 MGD or 10.5 MGD? Will Total Nitrogen Effluent Limit Be 8 mg/l? Will Total Nitrogen Effluent Limit Be A Seasonal Average? Will Wet Weather Treatment Train Be Allowed? Pease WWTF: Will Total Nitrogen Effluent Limit Be 8 mg/l? Will Total Nitrogen Effluent Limit Be A Seasonal Average? Will An Increase in Flow Through WWTF Outfall Be Allowed? The Answer to these Questions Impacts Size and Cost of WWTF Upgrades
31 Conceptual Facility Layouts Secondary Treatment Facility Conceptual Layouts
32 Secondary Treatment Layout MBBR & DAF
33 Secondary Treatment Layout - BAF
34 Secondary Treatment Layout CAS with BioMag

35 Conceptual Facility Layouts Nitrogen Removal to 8 mg/l Facility Conceptual Layouts
36 Nitrogen Removal to 8 mg/l Layout MBBR & DAF
37 Nitrogen Removal to 8 mg/l Layout - BAF
38 Nitrogen Removal to 8 mg/l Layout CAS with BioMag
39 Key Consent Decree Dates June 30, 2012 Complete initial pilot testing July 30, 2012 Submit pilot data October 1, 2012 Submit Piloting Technical Memorandum and recommended secondary treatment capacity July 1, 2013 Commence final design of secondary treatment facilities August 31, 2014 Complete design of secondary treatment facilities March 1, 2015 Commence construction of secondary treatment facilities March 1, 2017 Complete construction of secondary treatment facilities May 1, 2017 Achieve compliance with secondary treatment limits

40 Funding Projected Rate Impacts Rate Model RFQ
41 User Rate Projections As Presented June 23, 2010 Public Meeting 2012 User Rate
42 Current and Projected Sewer Rates Cost per Unit Current Sewer Rate Lower Tier $ 8.29 Current Sewer Rate Upper Tier $ 9.11 Projected Capital Cost Projected Sewer Rate for Secondary Only $ $40M Projected Sewer Rate for 3 mg/l TN $ $80M Billing Unit = 748 gallons or 100 Cubic Feet of water

43 Water & Sewer Rate Study Review and update both water and sewer rate structures and rates (previous rate study was in 2006) Assure rate structures promote sustainable water and sewer practices Assure equitable sharing of water and sewer costs Assure capability to pay for needed improvements and operations

44 Action Items Details on the Maine experience and relationship to New Hampshire issue Provide legal and consultant costs for wastewater issues and legal challenge 2.1 Schedule Next Meeting
45 Action Item 1.2 Coalition Cost Summary Total Invoiced to Date Portsmouth Cost Regulatory Effort $386, $77, Memorandum of Agreement $237, $47, Total Cost Per Year $124, $62, Costs Since June 2010
46 Questions & Answers