Disinfection ByProducts
|
|
|
- Arleen Montgomery
- 5 years ago
- Views:
Transcription
1 Developments in Disinfection Byproducts (DBPs) and Perfluorinated Compounds Drinking Water Rules and Regulations Update Seminar July 2017 Disinfection ByProducts 1
 Disinfection")


2 Disinfection 1966 United Artists (Thanks to Erik Rosenfeldt for the Clint Eastwood analogy) Disinfection The Good Typhoid Cases Philadelphia Filtration Sedimentation Chlorination From McGhee, 6 th Ed.,1991 Waterborne Disease Control Essential human need provided by water engineers Disinfection of drinking water was one of the major public health accomplishments of the 20 th century Chlorination has allowed us to live long enough to worry about cancer 2

3 Disinfection The Bad Any chemical disinfectant used in water treatment produces byproducts Strong Oxidants Killing pathogens is tricky; Forming DBPs is not Chlorinated DBPs and Health Effects Higher exposure to regulated THMs and HAAs, especially brominated ones, are associated with bladder cancer in humans But, existing studies do not clearly indicate that further DBP reduction lower cancer rate Disinfection Byproducts The Ugly Over 600 DBPs Have Been Identified, Others Still are Unknown THMs and HAAs are a fraction of the total DBP profile of a water Chlorinated Unknown TOX Chloraminated 3

4 Disinfection Byproducts HAAs THMs ICR Compounds 50 MWDSC DBPs ~700 Known DBPs Halogenated Compounds Non-halogenated Compounds 7 UCMR2 Nitrosamine Occurrence Data Could NDMA push utilities back to free chlorine? 4

 0 0 Dec-02 Apr-04 Sep-05")

5 Brominated DBP Challenges THM/HAA Locational Running Annual Average ( g/l) Raw Bromide RAA Echo THM LRAA Crosswinds LRAA Echo HAA LRAA Crosswinds HAA LRAA But this could be worse This is bad Raw Water Bromide RAA ( g/l) 0 0 Dec-02 Apr-04 Sep-05 Jan-07 Jun-08 Oct-09 Feb-11 Jul-12 Nov-13 UCMR4 will tell us more Scan the QR Code to view the full report on line (free access) 5

6 Compliance Can Be a Balancing Act Example DBPs and Corrosion Strategy 2: ph Change Lead No Orthophosphate Strategy 1: Coagulant Change LCR ph Stage 2 DBP Rule What are Perfluoroalkyl Substances? 6
7 Perfluoroalkyl Substances Perflourinated Compounds (PFCs) Perfluoroalkyl Acids Perfluoroalkyl Sulfonates PFOS Stain Resistant Fabric Scotch Gard Long-chain PFC No longer manufactured in the industry Hydraulic Fluid Semiconductors Reflective Coatings Fire Fighting Foam MRL = 40 ng/l Ref conc. = 70 ng/l 7
8 PFOA Stain Resistant materials Wire Insulator Long-chain PFC Previously a major product for 3M and DuPont Emulsifier Electronics Surfactants Fire Fighting Foam MRL = 20 ng/l Ref conc. = 70 ng/l US EPA Health Advisory In May 2016, US EPA issued Health Advisory for 2 PFCs Perfluorooctanoic acid (PFOA) Perfluorooctane sulfonate (PFOS) Health Advisory Level 70 ng/l for PFOS 70 ng/l for PFOA OR 70 ng/l for PFOS and PFOA combined 8
9 Other State PFC Regulations State PFC Concentration Guidelines State Matrix Contaminant Illinois Groundwater PFOA 0.4 µg/l PFOS 0.2 µg/l Maine Groundwater PFOA 0.06 µg/l PFOS 0.1 µg/l Michigan Surface Water PFOA 0.42 µg/l PFOS µg/l New Jersey Drinking Water PFOA 0.04 µg/l North Carolina Groundwater PFOA 2 µg/l Environmental and Human Impacts PFCs are persistent in the environment Longer-chain chemicals bioaccumulate more than shorter chain molecules EPA began phase-out of PFOS and PFOA Manufacturers simply switch to shorter chain versions Short-chain PFCs are MORE CHALLENGING to treat Humans are often exposed to PFCs through food, dust, consumer products, clothing, and water Half life in humans is several years (slow elimination) Thus exposure is cumulative 9
 Alabama Arizona California Colorado Delaware Florida Georgia Illinois")

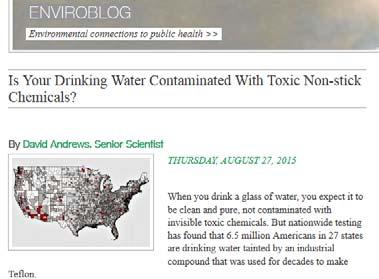
10 Distribution From UCMR 3 Data Note: Other Sites May Have Problems in Dry Months States Affected (based on UCMR3 data) Alabama Arizona California Colorado Delaware Florida Georgia Illinois Kentucky Maryland Massachusetts Minnesota Rhode island South Carolina Tennessee New Hampshire Texas New Jersey Virginia New York Washington North Carolina Wisconsin Ohio West Virginia Pennsylvania 10


11 What s the Big Deal? 11
12 Treatment Options for PFCs Treatment Options for PFOS and PFOA Removal of PFCs from source waters depends on concentration, raw water quality and other variables RO, NF: >90% removal GAC: >90% removal Anion Exchange: 10->90% removal Advanced Oxidation: Unknown PAC: Possible short-term solution pending jar testing results 12


 Non-polar portion of molecules sticks to")
13 Overall PFC Treatment Options Source: Water Research Sorption by Activated Carbon Uses chemistry and solute-particle interactions to remove contaminants from water Powdered activated carbon (PAC) Granular activated carbon (GAC) Non-polar portion of molecules sticks to carbon H 2 O Carbon 13
14 PAC Jar Testing Wood-Based PAC Had Best Performance 6 PFC Removal with 1.1 Hour Detention Time 70% 64% 60% 50% 48% Percent PFC Removal 40% 30% 20% 10% 14% 19% 19% 39% 22% HDB 10 mg/l HDB 25 mg/l HDB 50 mg/l Aquanuchar 10 mg/l Aquanuchar 25 mg/l Aquanuchar 50 mg/l Aquasorb 10 mg/l Aquasorb 25 mg/l Aquasorb 50 mg/l 0% -10% -9% -4% -20% Lignite Wood-Based Coconut Shell 100% PAC Jar Testing PFOS and PFOA Removal Better than Combined 6 PFCs PFOS+PFOA Removal with 1.1 Hour Detention Time Lignite Wood-Based Coconut Shell 90% 90% 80% 70% 69% HDB 10 mg/l Percent PFC Removal 60% 50% 40% 52% 38% HDB 25 mg/l HDB 50 mg/l Aquanuchar 10 mg/l Aquanuchar 25 mg/l Aquanuchar 50 mg/l Aquasorb 10 mg/l Aquasorb 25 mg/l 30% Aquasorb 50 mg/l 20% 15% 21% 22% 10% 9% 0% 1% 14
15 Other Implications of PAC Need to be Considered Possible change in ph PAC will quench any oxidants present (e.g., chlorine, KMnO 4 ) Residuals handling & disposal Need sufficient contact time Need sufficient velocity to avoid settling Storage challenges messy, needs building Explosion hazard control (dust) Powdered Activated Carbon Benefits Can be applied on intermittent basis Can adjust carbon type based on needs Disadvantages Needs high dose and long contact time Residuals handling and disposal Storage For 10 mgd WTP, 50 ppm PAC dose: ~4,200 ppd solids $3,800 per day in PAC costs 15
16 Example GAC Breakthrough Curves Note Shape of GAC Curves: Different Compounds Have Different Characteristics 16
17 When Exhausted, GAC May Release Additional Contaminants, Exceeding 100% effluent concentration is greater than influent leads to additional exposure Original Curve: Shorter Chain PFCs Break Through Earlier and C o /C i > 1 17
18 GAC provides treatment for PFCs in addition to improving general water quality and ensuring compliance 195 days to TOC breakthrough 620 days to PFC breakthrough Source: Calgon Carbon Corporation Granular Activated Carbon Benefits Excellent removal of most PFCs Removal of other chemical constituents DBP precursor reduction Disadvantages Permanent installation Carbon replacement costs can be costly Costs: $9M for 10 MGD + $1.3 M/year O&M Need to consider breakthrough time and regeneration cycles 18
19 GAC treatment may be the economical option for PFC treatment As compared to RO, GAC is a more economical treatment option for full WTP capacity No concentrated brine stream or chemical addition GAC is the most common treatment method for long-chain PFC removal Competition with other contaminants can reduce effectiveness ph, water temperature, contact time, ambient natural organic matter and the presence or absence of chlorine also impact effectiveness Thermal regeneration of GAC is effective for removing adsorbed PFCs Ways to Help Utilities Manage PFC Concerns Develop Water Quality Monitoring Programs Understand PFC variability Understand water quality impacts Develop Water Treatment Plant Profiles of PFCs Through each process Multiple barrier approaches Develop Finished Water Quality Goals Guidelines Compliance Consider Bench-Scale and Pilot-Scale Testing PAC jar testing GAC column testing Advanced Treatments Preliminary Engineering Reports Should Include Concept Residuals Layouts Estimated Costs Schedule 19
20 Other Resources icals_508.pdf FCs_StateOfTheScience.pdf final_.1.pdf Questions? David S. Briley, PE Water Practice Lead - Raleigh dbriley@hazenandsawyer.com