CVCA - LID Infrastructure Performance and Risk Assessment (IPRA) program
|
|
|
- Marvin Simmons
- 5 years ago
- Views:
Transcription
 program Jennifer Dougherty, M.A.Sc., P.")
1 CVCA - LID Infrastructure Performance and Risk Assessment (IPRA) program Jennifer Dougherty, M.A.Sc., P.Eng April 13, 2016


2 CVC Infrastructure Performance Monitoring Program 61 LID Sites 12 Demonstration Sites Road Right of Ways Residential sites Public Land sites industrial/commercial


; Defined 18 objectives for CVC s overall")
3 Stormwater Management Monitoring Strategy Highlight the importance of SWM monitoring in the design, construction, assumption, operation and maintenance of stormwater infrastructure to ensure long-term performance; Provide an overview of how CVC s stormwater monitoring program fits within our watershed stakeholders priorities (Region of Peel and member municipalities, Ministry of Environment, Ministry of Natural a Resources, Development e e Community); Defined 18 objectives for CVC s overall SWM monitoring gprogram.
4 Top Five Performance Monitoring Priorities Water quality and quantity performance of LID design in low infiltration soils; How multiple LID treats and manages stormwater; Performance of flood control, erosion control, water quality and natural heritage protection. Long term maintenance needs and impact on performance; Lifecycle cle costs (asset management);
5 Importance of Performance Monitoring Provide information on LID performance Meet compliance requirements Inform design standards Inform municipal i resolutions for LID implementation Provide solutions and procedures for maintenance Inform life-cycle costing
6 Monitoring LID: Why? Compliance Monitoring Environmental Compliance Approval (MOECC s requirement) SWM design standards Performance Monitoring To feed into future designs based off performance of existing sites
7 Monitoring LID: Why? Adaptive Monitoring Adapt to new questions, requirements and designs New needs with changing climate Develop new criteria and changes to current standards; demonstrate duty of care of our infrastructure Assumption Monitoring Monitoring to ensure site functionality prior to assumption


8 Elm Elm Drive Demonstration Site


9 Elm Drive: Demonstration Site Elm Dr. Site
10 Elm Drive Monitoring Station (ED-1)
11 Demonstration Site Implementation Ward councillor and School Board Trustee provided direction from top down; Key project partners included: the City of Mississauga Transportation & Works Department School principal PDSB Maintenance Manager CVC staff
12 Integration between Departments Within the City of Mississauga all departments were engaged to ensure integration; Ensured that the people responsible for planning, constructing and maintenance are all involved in the process from the beginning. i


13 Maintenance Responsibilities School Board and City agreed to terms for granting the city the use of school board property for SWM purposes; The right for the city to enter the school board property for construction and maintenance of the LID practices; The city assumed responsibility for the bioretention planters.


14 Monitoring i Data Collection System Underdrain Precipitation: Heated Shallow Well rain gauge Outflows: V-notch weirs Water levels: Deep Well observational wells Water Quality flow-proportioned composite samples 15 events/year general chemistry, TSS, nutrients, metals, temperature Weir Plate


15 Qualitative Observation: Observing a site during precipitation events is critical to identifying how the site is functioning/performing These observations can assist in the interpretation of monitoring data, and add to the overall information record of a site Lesson Learned : Observing precipitation events can provide insight into the functionality of the site that may not become apparent even with detailed monitoring.
16
17 Inflow and Outflow Hydrographs Total Rainfall = 27mm Volume Reduction = 79% Peakflow Reduction = ~87% B.A.U
18 Volume Reduction
19 Water Quality Performance Parameter Total Estimated Influent Load (g) Total Estimated Effluent Load (g) Estimated Load Reduction (%) NO 3 5,255 1,386 74% OP % Cd % Cu % Fe 11, % TKN 9, % Pb % Ni % TP 2, % TSS 457,899 30,235 93% Zn %


20 Water Quality and Treatment Train Performance in Low Infiltration Soils 90% of all rainfall events are filtered by LID 69% of all rainfall is detained and infiltrated Only 3-8 rainfall events produce runoff where 93% of Total Suspended Solids and 96% Total Phosphorus is removed Before After


21 Temperature Performance EMT = Event Mean Concentration
22 Operational Level of Service Metric Criteria Performance at Elm Criteria Met? Peak Flow Reduction 100 Year Post equal to Pre 60% Reduction N/A Runoff Volume Reduction 15 mm 21 mm TSS Removal 80% 93% Phosphorous Removal 80% 96% Effluent Cd Concentration 0.2 μg/l 0.10 Effluent Ni Concentration 25 μg/l 0.70
23 Operation & Maintenance


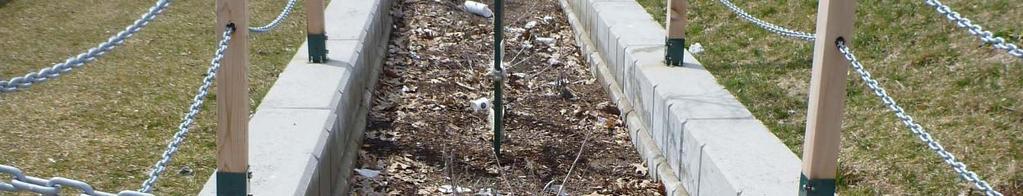
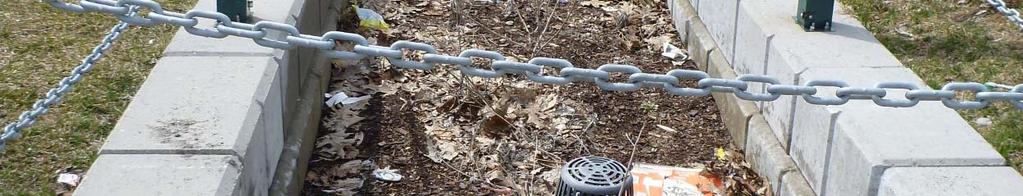
24 Issues & Challenges Excess salt clogging permeable pavement Garbage and debris collecting in bioretention cells
25 Issues & Challenges


26 TRCA Inspection & Maintenance Guide


27 O&M Design Considerations


28


29 O&M Contracts and Agreements Subdivision ision and site plan agreement Warranty period Assumption / Final Acceptance Long term maintenance


30 Visual Observations vs. Measured Performance Inspection of site condition and Photo logs


31 Common issues are erosion, inlet blockage, sediment accumulation, water ponding, and vegetation death. Maintenance issues can be tracked over time to see if they are design or site related Maintenance schedules will provide insight as to when issues are addressed, how frequently, and if they are resolved Routine maintenance will be more cost efficient in the long-term if small issues are addressed more frequently than leaving them to develop into larger problems


32 Visual issues are just as important as structural issues as the public wants to see an attractive feature. This is why it is important to both inspect structural features to ensure functionality as well as visual feature to ensure an attractive site is well maintained.


33 O&M Tasks


34 Asset Management


35 Education & Outreach
36 Lessons Learned: CVC Stormwater Management and LID Monitoring and Performance Assessment Guide p content/uploads/2015/08/monitoring -Guide_DRAFT.pdf
37 Lessons Learned Championing the project with municipal, school board and school staff works best when direction comes from top down. Demonstration site Water quantity and quality performance is meeting design criteria O& M is critical for the long term success and performance of green infrastructure O&M needs to be considered in the design and plan review stage Resources and guidance is available for O&M and performance monitoring of green infrastructure
38 Questions