Air Quality in the San Joaquin Valley
|
|
|
- Doreen Berry
- 5 years ago
- Views:
Transcription


1 Air Quality in the San Joaquin Valley

2 Core Values of the Valley Air District Protection of public health Active and effective air pollution control efforts with minimal disruption to the Valley s economic prosperity Outstanding customer service Open and transparent public processes Ingenuity and innovation Effective and efficient use of public funds Respect for the opinions and interests of all valley residents

3 Federal EPA Implements CAA through regulations Sets federal ambient air quality standards Identifies both criteria and hazardous air contaminants to be regulated Develops and certifies equipment, procedures and test methods Controls emissions from mobile sources (trains, ships, aircraft, etc.) California Air Resources Board Oversees implementation of SIP and state air pollution law Sets state ambient air quality standards Regulates emissions from vehicles operated in the state (mobile sources), from some off-road sources, and consumer products (spray paint, hairspray, cleaners, etc.)
 due to")

4 Local agencies influence land-use and transportation planning They can address and mitigate air quality impacts from increases in vehicle miles traveled (VMT) due to Valley population growth through actions such as Urban sprawl reduction Increase street connectivity Mixed use development Mass transit access Bike paths, sidewalks, trails
5 Responsible for regulating stationary sources such as power plants, manufacturing facilities, development and agricultural operations Develops plans and rules for reaching attainment of criteria pollutant standard levels Permits facilities Ensures compliance Comments on development projects through CEQA Provides Incentive funds Facilitates educational campaigns Works cooperatively with research entities to further air-quality research

6 Valley Air District Regional agency responsible for air quality management in eight counties San Joaquin, Stanislaus, Merced, Madera, Fresno, Kings, Tulare and the valley air basin portions of Kern Governed by a 15-member Board Board of Supervisor of all eight counties Five council members from Valley cities Two governor-appointed public members Regulates stationary sources
 run all the way through")
7 Surrounding mountains and meteorology create ideal conditions for air pollution formation and retention Chronic poverty and unemployment rates High rate of population growth I-5 and Hwy 99 (major transportation arteries) run all the way through Valley
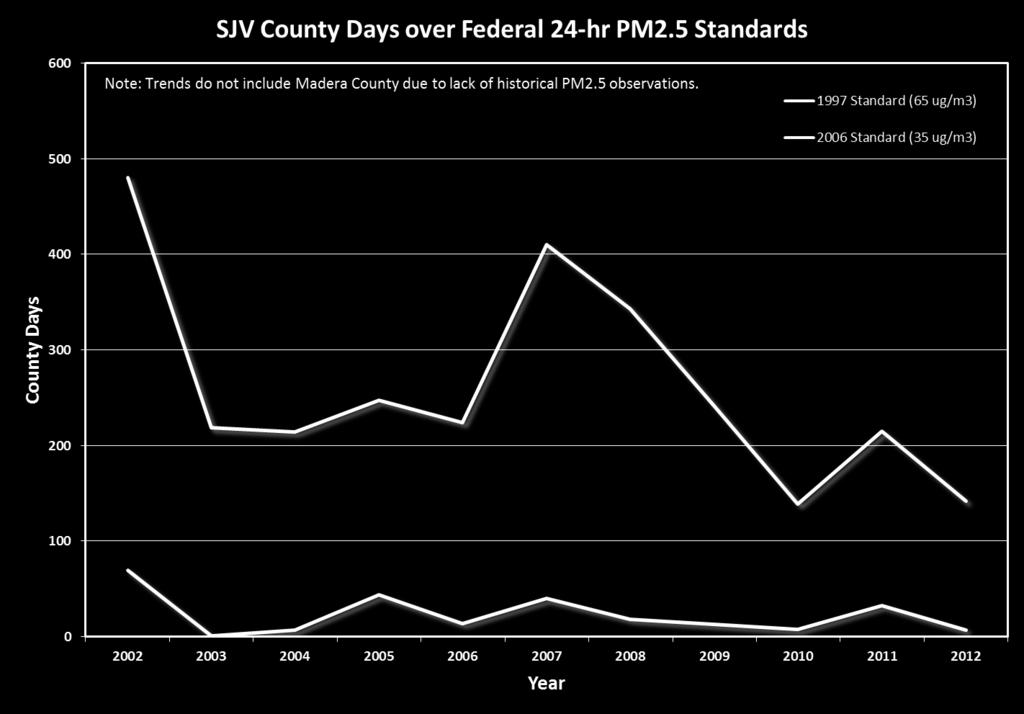
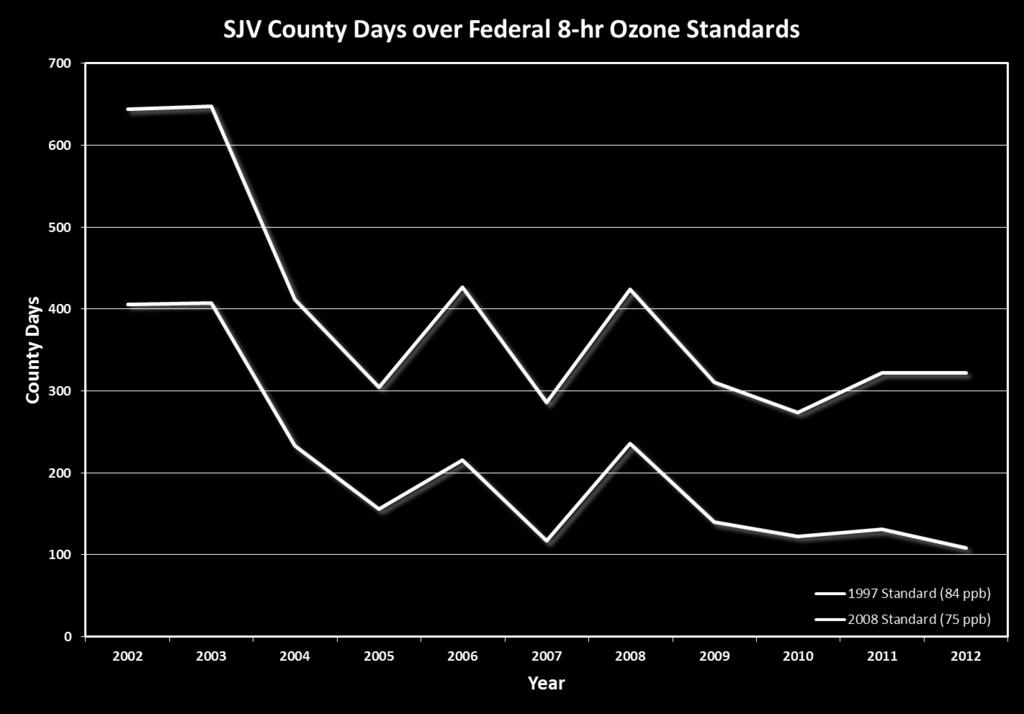
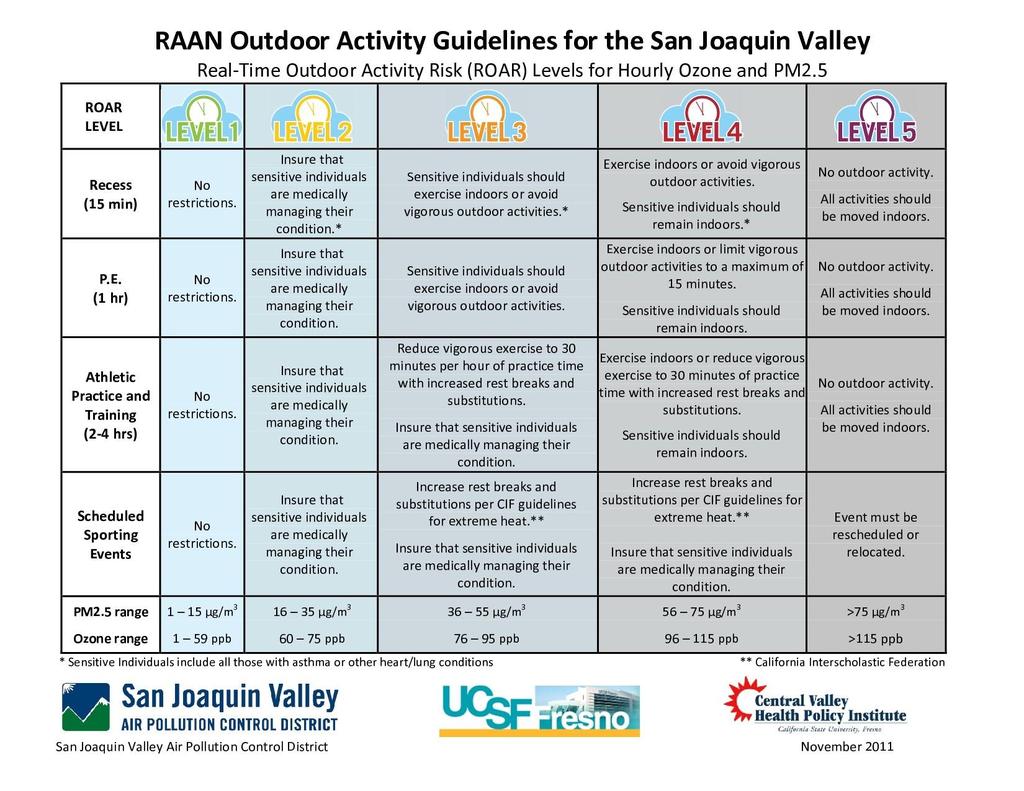
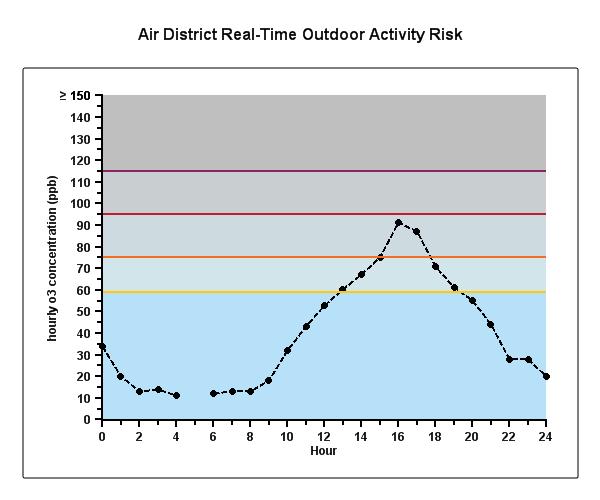
8 Particulate Matter Two sizes: 2.5 and 10 microns Ozone Averaged over eight-hour period (previously 1-hr) Two different pollutants with two different causes, seasons and health effects.

9 PM10 - Fall problem, mostly dust, larger particles. Also includes PM2.5 PM2.5 - Winter problem, emissions from burning, more dangerous than larger particles - In winter, wood burning can produce up to 17 tons of PM per day throughout the Valley. - Triggers heart attacks, aggravates asthma, bronchitis. Susceptibility to respiratory infections. Strong correlation between PM levels, hospital admissions and deaths.
, industrial processes, agriculture, consumer products (lawnmowers, paints and solvents, etc) Vehicle use accounts for up to 80 percent of smog problem")
10 Main component of summertime smog Odorless, colorless gas resulting from chemicals cooking in sunlight and heat Made up of nitrogen oxides (NOx) and volatile organic compounds (VOCs) Produced by internalcombustion engines (mobile sources), industrial processes, agriculture, consumer products (lawnmowers, paints and solvents, etc) Vehicle use accounts for up to 80 percent of smog problem
.")
11 Health impacts, each year 460 premature deaths 325 new cases of chronic bronchitis 3,230 cases of acute bronchitis in children 260 hospital admissions 23,300 asthma attacks 188,000 lost school days 3,000 lost work days $3 billion/year in health-related costs Source: Hall, Jane; Brajer, Victor; Lurmann, Frederick W. (March 2006). The Health and Related Economic Benefits of Attaining Healthful Air in the San Joaquin Valley. Institute for Economic and Environmental Studies, California State University Fullerton.
12 Federal mandates dictate District actions Federal Sanctions De-facto ban on new businesses and expansion of exiting businesses Loss of federal highway funds Federal takeover (FIP) loss of local control (sanctions will continue in the meantime) District goal to provide local control in meeting federal mandates Valley has already been fined $29 million annually until 1-hr ozone attainment is reached.
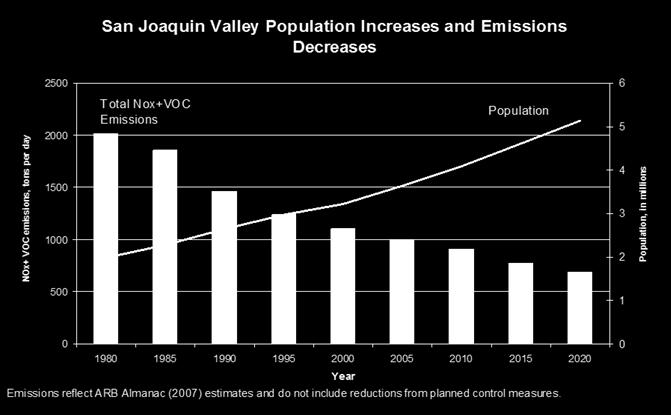
13
14
15
16
17


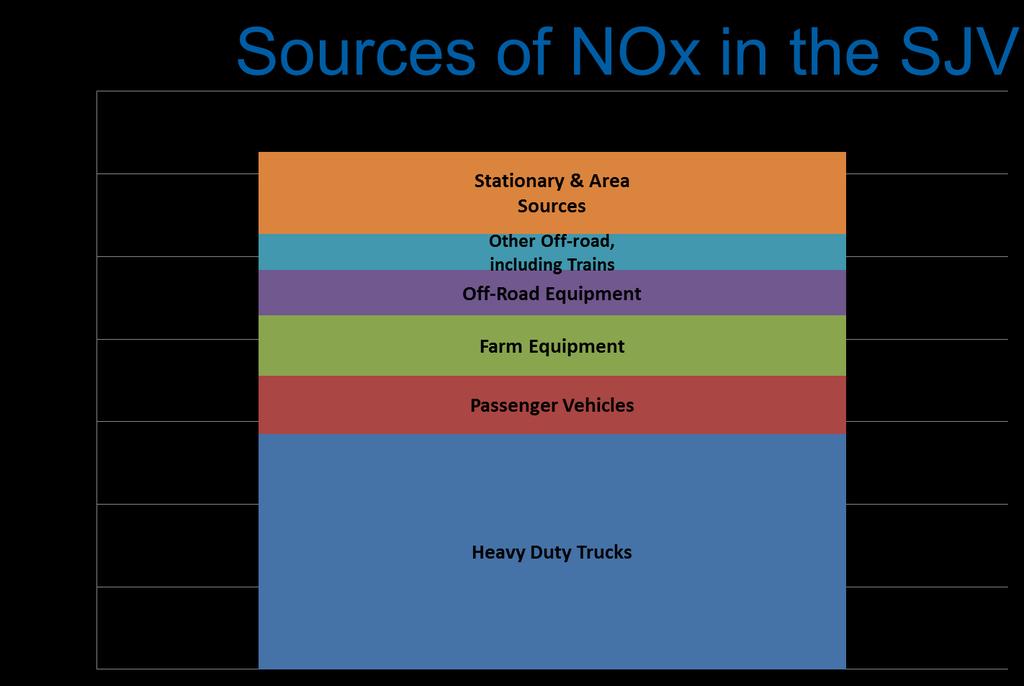
18 Annual average 2012 emissions: 313 tons per day Sources of Air Pollution
19 Annual average 2012 emissions: 355 tons per day Sources of Air Pollution


20 Sources of Air Pollution Annual average 2012 emissions: 75 tons per day

21 Bay Area, Sacramento, Los Angeles, Asia 25% to 5% of pollution in the Valley Increasingly important as goals become tighter Example of summer ozone transport


22 Major Rules and Regulations More than 500 rules and regulations implemented since 1992 Rule 4901, Wood Burning Fireplaces & Wood Burning Heaters Dust Control Rules Construction and Agriculture InDirect Source Review etrip Employer-based Trip Reduction Agricultural and Hazard Reduction Burning Confined Animal Facilities

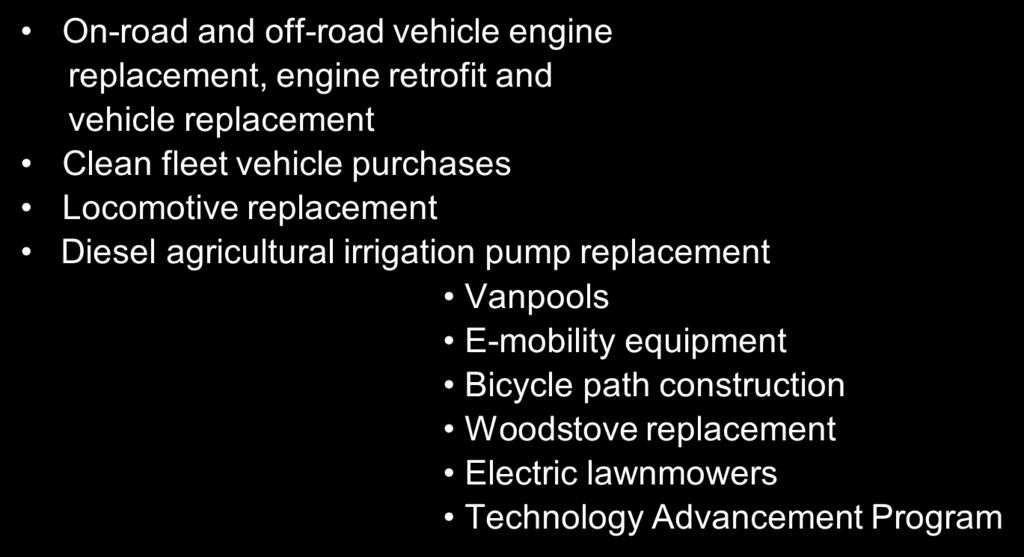
23 District Incentive Programs


24 Public Outreach Programs & partnerships

25 Goals Reduce Vehicle Miles traveled (VMT) by public Reduce emissions from high emitting equipment and processes Shift emissions from peak smog episodes Reduce emissions through energy efficiency and the use of cleaner fuels and/or equipment


26 Drive less, don t idle your vehicle Look for energy efficiencies at work and home Check Before You Burn Sign up for District list serve Tell my friends and family about Healthy Air Living Use air friendly lawn and BBQ equipment Become a Healthy Air Living Partner!
27
28
29
30 Thank You! Need more information? Contact Outreach and Communications Fresno office (559) Modesto office (209) Bakersfield office (661) For information on District rules and programs visit our websites: