Solids Management for Today s Wastewater Systems
|
|
|
- Ralf Webb
- 5 years ago
- Views:
Transcription


1 Solids Management for Today s Wastewater Systems EPA Region 4 Joseph Cantwell, PE April 26, 2012 N A T I O N A L S E C U R I T Y E N E R G Y & E N V I R O N M E N T H E A L T H C Y B E R S E C U R I T Y
2 Agenda Solids Management Energy Solids Conditioning And Thickening Digestion Aerobic Digestion Anaerobic Digestion Energy Saving Opportunities Questions


3 Solids Management Screens 0.0% Grit 1.4% Clarifiers 3.2% Wastewater Pumping 14.3% Lighting & Buildings 8.1% Chlorination 0.3% Aeration 54.1% Belt Press 3.9% Anaerobic Digestion 14.2% Gravity Thickening 0.1% Return Sludge Pumping 0.5% Electricity Requirements for Activated Sludge Wastewater Data derived from Water Environment Energy Conservation Task Force Energy Conservation in Wastewater Treatment
4 Solids Management Fats, oils, grease Grit Primary biosolids Secondary biosolids Digested biosolids oaerobic oanaerobic Chemical stabilization
5 Solids Assessment Biosolids conditioning and thickening o Gravity o DAFT o Gravity belt o Centrifuge o Rotary drum Biosolids dewatering o Centrifuge o Belt filter press o Pressure filter o Drying beds o Assisted drying beds
6 Solids Assessment (continued) Biosolid digestion oaerobic energy consumption oanaerobic energy production Chemical stabilization
7 Solids Digestion Types Aerobic oair present osmaller facilities o85% of plants (WI, NY) < 1 MGD Anaerobic oair absent olarger facilities oproduce biogas
8 Aerobic Digestion WDNR code 110 design requirements: Must have ability to provide 30 scfm per 1,000 ft 3 tank volume. Must meet oxygen or mixing requirement, whichever is greater. Most facilities operated to meet code. Equipment selected to meet code
9 Aerobic Digestion Energy Efficiency Opportunities Air flow rate o Blower capacity (ability to meet code) supply can be reduced o Adequate air supply for effective mixing ~ 0.25 cfm/sf < code requirement o Properly sized blower with VFD meets code, remains energy efficient because operational flexibility Aeration timing o Many locations achieve adequate mixing through periodic versus continuous air supply o Flexible membrane diffusers allow air supply to be turned off without clogging, up to 2.5% total suspended solids (TSS)
10 Aerobic Digestion Energy Efficiency Opportunities (continued) Flexible membrane, fine-bubble diffusers provide improved oxygen transfer Reduced air demand Higher O 2 volume delivered Longer rest time modified operation Mixing system modifications Reduced blower size Variable speed drives Rest times (decant)
11 Aerobic Digestion Energy Efficiency Opportunity Example Existing case: Tank dimensions 30 diameter, 15 side water depth Code requires 318 scfm (30 scfm x 10,597 ft 3 /1,000 ft 3 = 318 scfm) Discharge blower pressure 7.5 psig (15 / psig) required Blower draws 16.2 HP (12.1 kw) Continuous operation consumes 105,996 kwh annually
12 Aerobic Digestion Energy Efficiency Opportunity Example Proposed case: Mixing requires 177 scfm (707 ft 2 x 0.25 scfm/ft 2 ) Blower draws 8 BHP (5.9 kw) Periodic operation (50%) consumes 26,139 kwh annually Annual savings achieved = 79,856 kwh ($5,600 based on $0.07/kWh) Operate minimal time during on-peak electric rate
13 Anaerobic Digestion Biosolids reduced absence of oxygen Applied at larger facilities 62 installations in WI municipal facilities Improved volatile suspended solids (VSS) reduction oimprove biogas production oreduce biosolids disposal Utilize biogas beneficially heating, generating electricity, capture heat
14 Anaerobic Digestion Beneficial Modifications Mixing new mechanical technologies Heating (process) Grit removal Thicken feed solids concentration o Reduce water fed to digester oincrease VSS residence time oimprove VSS reduction/destruction Biogas conditioning (beneficial utilization)
15 Anaerobic Digestion Potential System Modifications Generation o o Electric production Heat capture, utilization (process and facility) Utilize gas production from digester o Condition biogas Load digester to design because capital is invested o o Assess auxiliary feedstock(s) Assess modified operation, for example, direct haul waste to digester Improve mixing Assess higher temperature digestion
16 Anaerobic Digestion Maximize biogas production Thicken prior to feeding digester Improve VSS reduction reduce liquid increase residence time Increase biogas production Reduce heating requirements Load to design conditions

17 Anaerobic Digestion (continued) Biosolid thickening reduce liquid entering solids stabilization processes
18 Anaerobic Digestion Example Plant has 4,500 ppd TSS to be processed at 2% solids Question: What does thickening do? Answer: 4,500 ppd/0.02 = 225,000 lb = 27,000 gal 4,500 ppd/0.04 = 112,500 lb = 13,500 gal 112,500 lb saved/day 112,500 lb/day x 1 BTU/ o F/lb x (98 o F 50 o F) = 5,400,000 BTUs 5,400,000 BTUs/100,000 BTU/therm = 54 therms
19 Anaerobic Digestion Example (continued) Improve VSS destruction: 4,500 ppd TSS x 0.60 VSS x 0.40(destroyed) = 1,080 lb 4,500 ppd TSS x 0.60 VSS x 0.60(destroyed) = 1,620 lb 540 lb VSS reduced 540 lb VSS x 14 ft 3 biogas/lb VSS x 650 BTU/ft 3 biogas = 4,914,000 BTU/day 4,914,000 BTU/day x 1 therm/100,000 BTU = 49 therms/day Total savings 54 therms + 49 therms = 103 therms/day
20 Anaerobic Digestion Example (continued) Improve VSS destruction: 4,500 ppd TSS x 0.60 VSS x 0.40(destroyed) = 1,080 lb 4,500 ppd TSS x 0.60 VSS x 0.60(destroyed) = 1,620 lb 540 lb VSS reduced 540 lb VSS x 14 ft 3 biogas/lb VSS x 650 BTU/ft 3 biogas = 4,914,000 BTU/day 4,914,000 BTU/day x 1 therm/100,000 BTU = 49 therms/day Total savings 54 therms + 49 therms = 103 therms/day 100 therms/day X $0.80 / therm = $80/day X 365 = $29,200/yr
21 Anaerobic Digestion (continued) Co-digestion (Auxiliary feed stocks) odairy osoft drink obakery ohigh organic content Co-digestion value?
22 Anaerobic Digestion Load-To-Design Conditions 1. Typical biogas production value = 14 CF biogas ppd VSS destroyed 2. Typical heat value for CF biogas = 650 BTU 3. Code design loading = 80 ppd VSS/1,000 CF of digester volume 4. 50,000 CF digester (~ 50 diameter, 25 depth) at 60% VSS destruction 5. 50,000 CF x 80 ppd/1,000 CF VSS x 60% x 14 CF/ppd x 650 BTU/CF = 4,000 ppd VSS x 0.6 (reduction) x 14 CF x 650 BTU = 21,840,000 BTU/day per 100,000 BTU/therm = 218 therms/day kw micro turbine-approximate fuel consumption = 140 therms/day kw micro turbine-approximate fuel consumption = 202 therms/day kw micro turbine, operated 90%/year will produce > 512,000 kwh annually plus 60 therms heat recovery

23 Estimated Energy Produced from Anaerobic Digesters 23

24 Installed Project
25 Municipal Wastewater Treatment Facility Activated sludge treatment system with existing flow of ~5.0 MGD Installed flexible membrane fine-bubble diffusers, Dissolved Oxygen control system, smaller capacity and new technology blowers Installed 2 65 kw micro turbines Aeration system energy supplied by the two micro turbines 100 kw, 876,000 kwh/year (reduced from 300 hp blower) Captured heat will be utilized on site for process and buildings Remaining power used for disinfection system

26 Existing Aeration Tank

27 Two Existing Blowers

28 Existing Blower

29 Flexible Membrane Diffusers

30 Biogas Conditioning System

31 Micro Turbine

32 Micro Turbine 32

33 New Technology Blower
34 Municipal Wastewater Treatment Facility Activated sludge treatment system with existing flow of ~3.0 MGD Installed flexible membrane fine-bubble diffusers, Dissolved Oxygen control system, smaller capacity and new technology blowers Installed new linear motion Installed a 180 kw generator Average demand at WWTF is 190 to 220 kw, offset majority of power Captured heat will be utilized on site for process and building heat

35 Generator and H2S System

36 Generator and H2S System

37 Biogas Conditioning System
38 Solids Management Summary Energy efficiency and renewable energy opportunities are available in biosolids management Opportunities exist in aerobic and anaerobic systems Assess your facility Opportunities are available in equipment and operation modifications Maximize the utilization of your solids handling system Address utilization of all biogas produced not just what is left over
39 Solids Management Summary Do not vent biogas or waste burn - - beneficially utilize! If install generation also capture heat Maximize loading to your anaerobic digester to maximize biogas production Be proactive seek having auxiliary feed stock brought directly to your facility
40 Questions?
41 Energy Bill
42 Questions Do you have energy consumption discussions other than when developing your yearly WWTF budget? Do you see your monthly energy bill(s)? Do you review your monthly bill for the valuable information provided? If not, these are actions items for you!
43 Electric Energy Bill Basics Typical monthly bill percentages: Energy (kwh) = 50% 70% Demand charges (kw) = 30% 50%
44 Electric Bill Description Amount Unit Rate Net Amount No. of Billing Days $0.00 METER 1 On Peak Demand Time - 4/26/ :15 Etime $0.00 On Peak Demand kw kw $0.00 Customer Demand kw 252 kw $0.00 Info Only - Average Cost/kWh 113, kwh $0.00 Facilities Charge - Daily $45.86 DEMAND CHARGES On Peak Demand kw $2, Customer Demand kw 1.76 $ Subtotal $3, ENERGY CHARGES On Peak Energy 40,914 kwh $3, Off Peak Energy 72,326 kwh $4, FCA On Peak Energy 38,942 kwh $97.74 FCA On Peak Energy (new) 1,972 kwh $12.19 FCA Off Peak Energy 66,855 kwh $ FCA Off Peak Energy (new) 5,471 kwh $10.39 Subtotal $10, Used with permission by the City of Port Washington
45 WWTF Energy Distribution Forecasted Energy Consumption at WWTF Process or Piece of Equip # Units HP of unit kw of unit # Units in Operation Hrs/yr in Operation Est. Power Consumption % Total Raw WW Pumps screw , , % Raw WW Pumps - submersible 0 Grit Paddle ,760 13, % Grit Removal pumps ,190 8, % Primary Clarifier ,760 13, % Primary sludge pump , % Aeration blowers PD , , % Aeration Blowers centrifugal , , % Channel aeration-aeration blower 0 0.0% Secondary clarifier ,760 13, % RAS pumps ,760 65, % WAS pumps ,380 32, % Final effluent peak pumps , % Anaerobic Dig recirculation pumps ,760 24, % Anaerobic digester mixing ,380 65, % Belt press ,080 15, % Effluent reuse pumps ,380 32, % Sludge transfer ,080 15, % Disinfection system ,380 87, % 1,359,191
46 Energy Value Why do utilities have an edge? Single shift = 8 hours/day x 5 days/week x 52 weeks/year = 2,080 hours/year Continuous = 24 hours/day x 365 days/year = 8,760 hours/year 8,760 hours/year / 2,080 hours/year = 4.2

47 Energy Benchmarking MGD = million gallons per day Source: Water & Wastewater Industry Energy Best Practice Guidebook
48 Energy Baseline Identify where you re at (baseline)... so you can figure out where you want to go (benchmark). Energy awareness leads to energy management.

49 Pumping Systems Screens Wastewater 0.0% Grit 1.4% Pumping Clarifiers 3.2% 14.3% Lighting & Buildings 8.1% Chlorination 0.3% Belt Press 3.9% Anaerobic Digestion 14.2% Aeration 54.1% Gravity Thickening 0.1% Return Sludge Pumping 0.5% Electricity Requirements for Activated Sludge Wastewater Data derived from Water Environment Energy Conservation Task Force Energy Conservation in Wastewater Treatment
50 Pumping System Components Pump Motor Drive, if applicable Controls Force main o Material o Diameter o Horizontal, vertical alignment o Age Material being pumped Appurtenances
51 Pumping System Influences Flow rate Head differential o Static o Friction (dynamic) Equipment efficiencies Force main o Material o Size o Wetted circumference Material being pumped Code requirements
52 Pumping System Efficiency 5 to 80%
53 Is Variable Speed Always Beneficial? Do you pump a wide range of flows? How much of system headloss is static? How much is dynamic? Can the existing pump accept a VSD? Will existing pump curve work well with speed variations? VSD is not always applicable a detailed assessment should be completed

54 Wasted Energy In Alternative Control Schemes Courtesy of Hydraulic Institute, Parsippany, NJ,
55 Pump System Opportunities Constant speed installation Extended shaft installation Self-priming Waste activated sludge Return activated sludge Final effluent Recycled final effluent Screw pumps Change in material pumped
56 Aeration For Today s Wastewater Systems
57 Recent Trends Moving away from: omechanical systems oceramic media Moving to: ofine-bubble, full-floor systems ofine-bubble, flexible membrane diffuser systems ohigher density fine-bubble layouts
58 Assessment Basics Organic loading o BOD o Ammonia Mixing o cfm/sf o 0.25 cfm/sf Capability meeting codes Number of diffusers (density) Blower selection flexibility Existing/design loading Detention time
59 Bubble Size Effect Smaller bubbles = larger area-to-volume ratio Smaller bubbles = slower bubble rise rate Smaller bubbles = more surface area and longer residence time in liquid = clean water oxygen transfer increases 2008 Science Applications International Corporation

60 Bubble Size Comparison 175 golf balls fit into the volume of a basketball So with the same volume of air you increase the surface area for O 2 transfer by ~ 5.6 times 2008 Science Applications International Corporation
 concentration")
61 Technical Best Practices Energy savings from dissolved oxygen (DO) concentration management
62 Energy Efficiency Opportunities Process sizing, equipment selection based on 20- year peak conditions No code for energy efficiency No requirement to meet existing low loadings Present worth cost effectiveness analysis not life cycle cost analysis Water conservation

63 Energy Utilization 2008 Science Applications International Corporation
64 Energy Efficiency Opportunities Replace coarse-bubble diffusers Install flexible membrane diffusers Reduce blower size Update blower technology Install variable speed drives Check sheave sizes on positive displacement blower Install dissolved oxygen monitoring, controls Idle an aeration tank
 BOD = 4,500 lb/day, NH 3 = 625 lb/day 50 ft")
 50 ft x 250 ft x 0.")
65 Aeration System Example (3.5 MGD) BOD = 4,500 lb/day, NH 3 = 625 lb/day 50 ft x 250 ft x 18 ft = 225,000 ft 3 at 20 cfm/1,000 ft 3 = 4,500 cfm (mixing) 50 ft x 250 ft x cfm/ft 2 = 1,563 cfm (mixing)


66 Aeration System Example (continued)


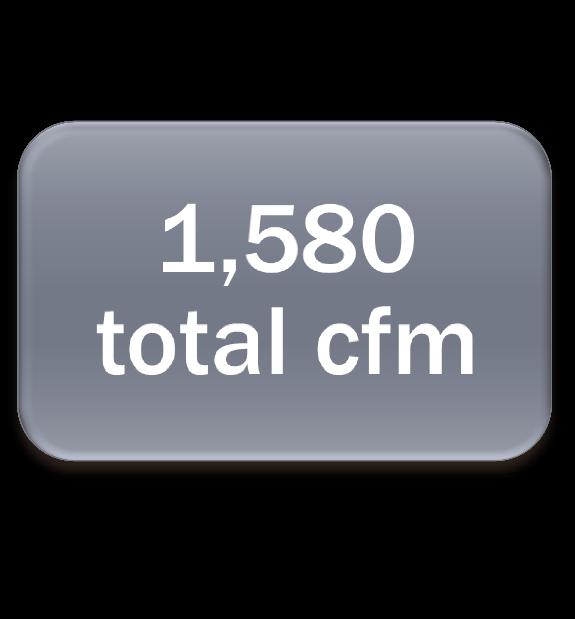
67 Aeration System Example (continued) Organic loading controlled at 1580 cfm Mixing (use 20 cfm/1000 ft 3 )
68 Fixed Growth For Today s Wastewater Systems
69 Energy Efficiency Opportunities Rotating biological contactors Energy efficient motors Building or covers Air assist o Weight control o Growth thickness Blower for air assist Weight sensors
70 Energy Efficiency Opportunities (continued) Bio towers and/or trickling filters Motor driven distribution arm Recycle rate Variability in recycle pump system Need for continuous pumping

71 Port Washington WWTF Electric Use Month Used with permission by the City of Port Washington

72 Port Washington WWTF Electric Use Week Used with permission by the City of Port Washington
73 Port Washington WWTF Electric Use Day Used with permission by the City of Port Washington
74 11/1/ :15 11/11/ :45 11/14/ :15 11/16/ :45 11/19/ :15 11/20/ :45 11/23/ :15 11/26/ :45 11/28/ :15 11/30/ :45 11/6/ :00 11/8/ :30 Demand (kw) Demand Graph (continued) WWTP - November 2008 Demand Data
75 Demand Graph (continued)
76 Demand Side Management Learn when demand is on-peak Review when changes in equipment occur Schedule maintenance/equipment tests Review maintenance operations (welding, pump station cleaning, filter backwashing) Treating hauled-in wastes Train staff
77 Operation Review What can you do? Blower & pump operation rotate lead - lag Repair and maintenance New equipment testing Bumping diffusers Review automatic controls (timing of change in operation) Mode of operation during storm events Sludge storage mixing
78 Implemented Opportunities

79 Installed Project
80 Wastewater Treatment Facility Activated sludge facility Not loaded at design but all aeration tanks aerated Annual electric consumption reduction forecasted at ~1,900,000 kwh City installed new flexible membrane, fine-bubble diffusion system in two tanks City reduced HP blowers to a 350 HP

81 Installed Project
82 Municipal Wastewater Treatment Facility Activated sludge facility Not loaded at design but both aeration tanks aerated Existing jet aeration system Assessment recommended City install new flexible membrane, fine-bubble diffusion system in one aeration tank Annual electric consumption reduction forecasted at 150 kw, 1,300,000 kwh/yr
83 What Should You Do? 1. Perform facilities assessment 2. Develop baseline for your facility 3. Identify, assess your energy efficiency opportunities 4. Develop your benchmark 5. Identify internal energy advocate 6. Secure management commitment 7. Implement energy efficient modifications 8. Develop continuous energy efficiency program
84 Thank You Joseph Cantwell, PE 1845 Derrin Lane Brookfield, WI Tel: Visit us at saic.com 84