Springfield, MO SSO Control Program: Using Big Data to Chart Progress
|
|
|
- Opal Patterson
- 5 years ago
- Views:
Transcription


1 Springfield, MO SSO Control Program: Using Big Data to Chart Progress 30 August 2017 Richard Hayslett & Josh Tedder

2 Springfield s Overflow Control Plan 10 year, $200 Million Phase 1 Foundation Projects 2016 to 2020 Phase 2 Advanced Action Projects 2021 to 2025 Phase 3 Reevaluation Pipe Renewal Allocation of Dollars Private I/I Abatement Priority SSOs WWTP Renewal MS4 Compliance Increase Maintenance Resources Program Costs Flow Monitoring/Reevaluation


3 Pipe Renewal Previous success Target high I/I areas Deteriorated pipe Efficiently identify sources


4 Private I/I Abatement Previous Success High I/I Areas Identify New Sources Efficiently Identify Sources


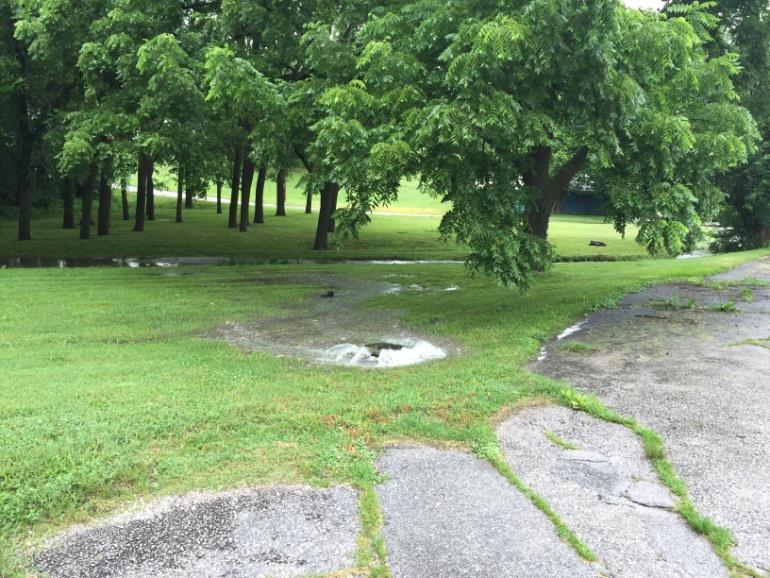
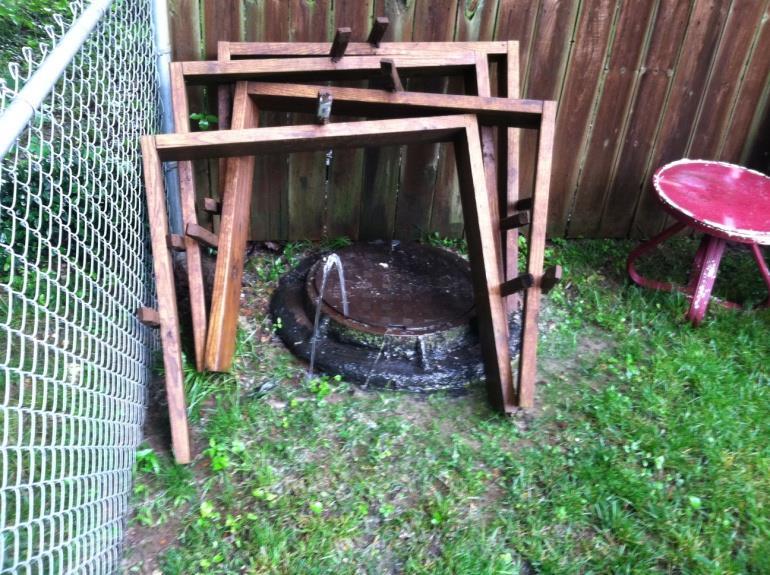
5 PRIORITY SSO PROJECTS Target SSOs in high use areas Parks Residential


6 TREATMENT FACILITY RENEWAL Digester Improvements Filter Project Equipment Renewal Equalization Basin Maintenance Flexibility Equipment Renewal
7 Monitoring Data Collection & Analyses 7

8 STATS OF THE SYSTEM Estimated population: 230,000 people Estimated growth rate: 1.5% per year 1,200 miles of sewer 8 pump stations 2 wastewater treatment facilities Much of the central portion of the system was constructed in the early 1900 s
9 GOALS OF THE OCP The elimination of wet-weather SSOs from the Wastewater Collection and Transmission System The elimination of wet weather bypasses at the Wastewater Treatment facilities Priorities of the current phase of the program are the following: I/I reduction through sewer rehabilitation including the addition of a private abatement program Use of an adaptive approach allowing Springfield to move to the biggest issues as more data is collected.
10 COLLECTION SYSTEM DATA SOURCES System Monitoring Data How does the system respond to wet weather? Rain gages, flow meters, and groundwater monitoring data Asset Management Data Where are the system assets and what s around them? Engineering drawing sets, databases, and various GIS datasets such as watersheds, sewersheds, streams, soils, etc. Condition assessment Are my assets working properly? Inspections, CCTV, and system work records
11 QUESTIONS BEING ADDRESSED WITH SYSTEM MONITORING High I/I is prevalent in Springfield s system, what portions of the system can be targeted for the highest return in terms of dollars spent for volume of I/I removed? How much flow reduction can be obtained by rehabilitation in Springfield s system? Flow responses seen in past years indicated that system could experience elevated flows for long duration after wet weather making it difficult to determine what level of service can be cost-effectively be provided. It is hoped that more data will lead to a better understanding of high flow frequency. Springfield is underlain with karst, groundwater issues have been suspected to contribute to both the magnitude and duration of high flows

12 MONITORING NETWORK DATA Wet weather response network: 33 permanent flow meters 40 rain gages 13 groundwater monitors Each spring, approximately 30 additional flow meters are added to the system to quantify the impacts of rehabilitation. These meters consist of: -Upstream rehab meters -Downstream rehab meters -Control basin meters
13 MONITORING DATASET GROWTH AND REVIEW Systematic data collection began in Each year since the data has grown by: Approximately 35,000 rainfall measurements 1,160,000 flow measurements from permanent meters 290,000 flow measurements from temporary meters 455,000 groundwater depth readings (began later) Flow data goes through an automated cleanup algorithm combined with a visual review to produce the final system data Rainfall Groundwater Levels Data Consolidation and Review Flows
14 FLOW DATA CLEANUP Raw flow data tends to have some erroneous measurements, data is processed using the following methods: Moving average of previous 1-hr measurements Data inference from typical scattergraph of meter s velocity and depth readings Monthly HTML data reports are produced to document the following: Dry weather and wet weather diagrams Flow hydrographs with rainfall measurements Scattergraphs with interrogation readings Comments to inform field crews of issues seen in the data review process Final data stored in the following formats: Comma delimited text files to use with data visualization software SSOAP-compatible Access database Text-based files to Database

15 BASE INFILTRATION For this analysis, base infiltration was considered to be the minimum 3-hr flow during dry weather Multiple dry weather periods were considered Base infiltration local to a flow meter was determined by subtracting contributing flow meter base infiltration Nightly flows from large industrial dischargers were removed

16 HIGH-GROUNDWATER INFILTRATION For this analysis, high groundwater infiltration was considered to be the difference between the average 24-hr flow preceding and following a rainfall event HGWI local to a flow meter was determined by subtracting the tributary flow meters Approximately 20 rainfall events were evaluated and HGWI estimates are the averages for those events.
17 17 GROUNDWATER DATA Groundwater wells were installed near sewers with known high groundwater to see how levels varied with flow
18 GROUNDWATER LEVELS RELATIONSHIP TO I/I FLOW For this analysis, the wet weather events and the subsequent 12-hr period were identified Those wet weather time periods were removed The average dry weather flow was subtracted from the flow data, leaving RDII flow The remaining groundwater level and the corresponding RDII flow data pairs were shown to be correlated
19 DURATION OF WET WEATHER RESPONSE Christmas of 2015, Springfield had a storm event of ~8 inches in 48 hrs No significant rain after the event Flow was elevated at the treatment plant for over three weeks from this one event
20 TRACKING REHABILITATION System rehabilitation is an incremental process, long-term flow meters can be used to demonstrate flow reductions following rehabilitation using a double mass curve approach As less flow enters the system due to upstream rehabilitation, the slope of the trendline is reduced

21 OPERATIONAL INSIGHT Using the database of flow velocities, low velocities can be a guide for a sewer cleaning program Also, the database can be queried to identify sewers that surcharge frequently indicating a flow restriction

22 Rehabilitation Effectiveness Data Analysis 22
23 Springfield Data Analysis I/I Driven Flow Meter Data Gathered for every basin CCTV Inspections performed All Pipes and laterals rehabilitated Private Rehabilitation 23
24 Springfield Rehabilitation Analysis Pre-Construction Flow Monitoring All Basins With Rehabilitation Scheduled Control Basin Post-Construction Flow Monitoring Same MH as pre-construction All Basins with rehab scheduled Same Control Basin Rehab Effectiveness = Basin Reduction (%) Control Basin Reduction (%) 24
25 Springfield Results I/I Reduction Results Public Rehab Project Avg Peak Reduction Avg Volume Reduction $/GPD $/Gallon Group 1 Public 32% 32% $1.26 $0.82 Group 2 Public 15% 23% $1.25 $1.03 Rehab Everything 22% 25% $1.28 $0.95 Group 3 - Lower Portion Mainline Only 54% 25% $0.24 $0.64 Group 3 - Lower Portion Mainline and Laterals 0% 34% - $0.98 Group 3 (Phase 1) Public - Average 25% 25% $1.71 $1.10 Total 21% 25% $1.56 $
26 Springfield Results I/I Reduction Results Public Rehab Key Take Aways Public Rehab averaged around 25% I/I Reduction Highest reduction was in SC07 75% I/I Reduction Dubbed the SWAMP by operators Higher level of reduction and more cost effective not to include laterals Laterals can be $ effective 26
27 Springfield Results I/I Reduction Results Public Rehab Group Avg Peak Reduction Avg Volume Reduction $/GPD $/Gallon Phase 1 Private 24% 24% $0.36 $0.66 Phase 2 Private* 38% 43% $0.21 $0.25 Total 31% 33% $0.27 $0.37 *Phase 2 private included lateral CCTV and rehab of defects Cost effectiveness numbers include inspection and defect removals 27
28 Springfield Results I/I Reduction Results Private Rehab Key Take-Aways More Effective and $ Effective than Public Phase 2 inspection costs decreased and $ effectiveness increased Public Outreach and scheduling large cost Lateral Repairs found to be cost effective (Under $1000) 28
29 Correlation Analysis Public Rehab Correlated results to: Peak Reduction Cost effectiveness ($/GPD) Volume Reduction Cost Effectiveness ($/Gallon) Number of Point Repairs per 1000/ft Volume Reduction (MG) Average Basin Plat Age 2013 Peak RDII Rate per 1000ft of pipe 2013 RDII Volume (7.5 Days) Local Groundwater Infiltration (Gallons/IDM) Peak Reduction (MGD) 29
30 Springfield Results Public Rehab Peak Flow Correlation Peak Flow Reduction Correlation Variable 1 Variable 2 Correlation Peak Reduction (MGD) Volume Reduction (MG) Peak Reduction (MGD) Groundwater Infiltration Peak Reduction (MGD) Number of Point Repairs Peak Cost Effectiveness ($/GPD) Plat Age Peak Cost Effectiveness ($/GPD) Number of Point Repairs Peak Cost Effectiveness ($/GPD) 2013 Peak RDII per 1000ft of Pipe Peak Cost Effectiveness ($/GPD) 2013 RDII Volume per 7.5 Days Peak Cost Effectiveness ($/GPD) Groundwater Infiltration
31 Springfield Results Public Rehab Volume Correlation Volume Reduction Correlation Variable 1 Variable 2 Correlation Volume Reduction (MG) Peak Reduction (MGD) Volume Reduction (MG) Groundwater Infiltration Volume Reduction (MG) Number of Point Repairs Volume Cost Effectiveness ($/Gallon) Plat Age Volume Cost Effectiveness ($/Gallon) Number of Point Repairs Volume Cost Effectiveness ($/Gallon) 2013 Peak RDII per 1000ft of Pipe Volume Cost Effectiveness ($/Gallon) 2013 RDII Volume per 7.5 Days Volume Cost Effectiveness ($/Gallon) Groundwater Infiltration
32 Correlation Analysis Public Rehab Key Takeaways Peak Reduction not correlated well to any data Volume Reduction $/Effectiveness to Groundwater infiltration 32
33 Correlation Analysis Private Rehab Correlated results to: Peak Reduction Cost effectiveness ($/GPD) Volume Reduction Cost Effectiveness ($/Gallon) Percent of Properties with Defects (%) Number of Defects Removed Volume Reduction (MG) Peak Reduction (MGD) Percent of Volume Reduction Percent of Peak Reduction Average Basin Plat Age 2013 Peak RDII Rate per 1000ft of pipe 2013 RDII Volume (7.5 Days) Local Groundwater Infiltration (Gallons/IDM) 33
34 Springfield Results Private Rehab Peak Correlation Peak Reduction Correlation Variable 1 Variable 2 Correlation Peak Reduction (MGD) Volume Reduction (MG) Peak Reduction (MGD) Groundwater Infiltration Peak Reduction (MGD) Number of Defects Removed Peak Cost Effectiveness ($/GPD) Plat Age Peak Cost Effectiveness ($/GPD) Percent of Properties with Defects Peak Cost Effectiveness ($/GPD) 2013 Peak RDII per 1000ft of Pipe Peak Cost Effectiveness ($/GPD) 2013 RDII Volume per 7.5 Days Peak Reduction % Percent of Properties with Defects Peak Reduction (MGD) Volume Reduction (MG)
35 Springfield Results Private Rehab Volume Correlation Volume Reduction Correlation Variable 1 Variable 2 Correlation Volume Reduction (MG) Peak Reduction (MGD) Volume Reduction (MG) Groundwater Infiltration Volume Reduction (MG) Number of Defects Removed Volume Cost Effectiveness ($/Gallon) Plat Age Volume Cost Effectiveness ($/Gallon) Percent of Properties with Defects Volume Cost Effectiveness ($/Gallon) 2013 Peak RDII per 1000ft of Pipe Volume Cost Effectiveness ($/Gallon) 2013 RDII Volume per 7.5 Days Volume Reduction % Percent of Properties with Defects Volume Cost Effectiveness ($/Gallon) Groundwater Infiltration
36 Correlation Analysis Private Rehab Key Takeaways Peak Reduction is not correlated to the number of defects removed Peak Reduction is not correlated to groundwater infiltration Peak Reduction was well correlated to Plat Age and Peak RDII Volume Cost Effectiveness was not related to Plat Age Volume Reduction was well correlated with the number of defects Volume Cost Effectiveness was weakly correlated with the 2013 RDII Volume 36


37 Questions? Josh Tedder, P.E Rich Hayslett, P.E Download paper at: 30 August 2017