Beyond Pipes to Watersheds
|
|
|
- Malcolm Walton
- 5 years ago
- Views:
Transcription

1 Beyond Pipes to Watersheds Research Based Stormwater System Design November, 2014


2 Agenda Introduction Stormwater Control Measures at the end of the pipe Site Level Case Studies Watershed Level Case Studies Not so-emergent Issues Discussion 2

3 University of New Hampshire Stormwater Center Providing Data to Protect Water Quality Since

4 What s the big deal?
5 Where are we today? Point source technology based standards have largely been successful. Water quality based standards (nonpoint source) have been difficult to achieve and enforce.


6 Chesapeake Bay November, 2014 Slide: Chesapeake NEMO
7 Land Conversion in the Great Bay Percent Impervious UNH earth systems research center (GRANIT)/ PREPP

8 Impact of Impervious Cover Adapted from Schueler


9 Source: Effects of Urbanization on Stream Quality at Selected Sites in the Seacoast Region in New Hampshire, , USGS 2005

10 Rasmussen, T.J., Poulton, B.C., and Graham, J.L.,
11 Bellucci, Becker, and Beauchene,

12 Stark, Hanson, Goldstein, Fallon, Fong, Lee, Kroening, and Andrews,


13 Why We re Here Goal of Clean Water Act is to delist Something isn t working Water Quality is Declining 13


14 Why the Center Was Created Three Year Study of Conventional Systems 14
15 Study Found That 34% Of the time systems offered some kind of treatment 26% Of the time systems did nothing 40% Of the time systems exported more pollutants Systems failed 2/3 of the time! 15


16 BMP Performance Monitoring Research Field Facility at UNH Tc ~ 19 minutes Watershed Boundary UNHSC Research Facility Bioretention Retrofit Tree Filter Porous Asphalt 16


17 BMP Performance Monitoring 17


18 BMP Performance Monitoring How We Evaluate Systems 18

19 BMP Performance Monitoring What We Look For 19


20 What We Do: Outreach Data Reports Web Resources BMP Fact Sheets Workshops Design Specs Journal Articles 20
21 Stormwater Outreach Can Be Challenging Because we don t always speak the same language Swale Permeable Retention Interlocking Pond Concrete Detention Pavers Pond Permeable Subsurface Permeable Interlocking Detention Interlocking Concrete Water Concrete Pavers Quality Inlet Pavers Permeable Interlocking Concrete Pavers Downstream Defender Bio-Swale Naturalized Basin Permeable Interlocking Permeable Concrete Interlocking Pavers Concrete Pavers Storm Trooper Vort-Sentry V2B1 Permeable Interlocking Permeable Interlocking Concrete Pavers Concrete Bay Pavers Saver Bioretention Permeable Permeable Interlocking Rain Interlocking Garden Concrete Concrete Pavers Tree Filter Pavers Filtera Sand Filter Delaware Austin ADS StormTech Permeable Interlocking Concrete Pavers Gravel Wetland Permeable Stormwater Interlocking Wetland Concrete Surface PaversWetland Pervious Permeable Concrete Interlocking Porous Asphalt Concrete Pavers Constructed Wetland 21

22 Imagine the Ultimate System Sonic Swirl Enforcer It Cleans! It Disinfects! It Will Get eliminating everything in it s path You the Job! 22


23 Now Consider Bioretention 23

24 No Need to Reinvent this Wheel Use Unit Operations & Processes (UOPs) Physical Operations Biological Processes Chemical Processes Hydrologic Operations 24


25 Physical UOPs Sedimentation Enhanced Sedimentation Filtration Screening


26 Biological UOPs Vegetative Process Microbial Process


27 Chemical UOPs Sorption Antibacterial Flocculation Coagulation


28 Hydrologic UOPs Flow Alteration Volume Reduction
29 Using UOPs to Meet Your Challenges Number of UOPs that can Sediment solve & associated ALL of pollutants your problems: Sedimentation, filtration Nitrogen Vegetative uptake & microbial processes Phosphorus Sorption & vegetative processes Water quantity management flow alteration, volume reduction 29
30 Combining UOPs within Systems Pollutant 1 Pollutant 2 Pollutant 3 Pretreatment/ Primary Treatment Secondary Treatment Tertiary Treatment 30
31 Systems We Will Cover Bioretention systems/tbf Subsurface gravel wetland Pervious pavements


32 Bioretention Systems tree filters bioretention 32


33 Bioretention System Design 33

34 Bioretention System Hydraulic Performance 34


35 35
36 Bioretention System Water Quality Treatment Bio I Bio II Bio III Bio IV % Removal Efficiency NA 36
37 Tree Filter System Water Quality Treatment % Removal Efficiency UNHSC Tree Filter MTD Tree Filter 37
38 Nitrogen is first flush weighted 38
39
40 Phosphorus Results
41 Breakthrough
42 Optimization
43 Bioretention System Report Card CATEGORY UOP TARGET GRADE Hydrologic Flow alteration Divert flow Volume reduction Physical Sedimentation Sediment Enhanced sedimentation Sediment Filtration Sediment Biological Microbial Nitrogen Vegetative Nitrogen/Phosphorus Chemical Sorption Phosphorus 43 43

44 Subsurface Gravel Wetland 44

45 Subsurface Gravel Wetland Components 45
46 Dissolved Oxygen in Gravel Wetland Effluent Flow Dissolved Oxygen 46
47 Subsurface Gravel Wetland Hydraulic Performance 47


48 Subsurface Gravel Wetland MedianRemoval Efficiencies 6 years of data with Influent EMC medians 48 48
49 Nitrogen Results DIN (mg/l)
50 Other Questions What is the max design ponding depth? A: It depends on chosen plant communities and the possibility of driving water vertically through the wetland soil. Preferably = 18 in. Is the WQV storage in the system static or dynamically sized? A: Static. Volume of storage above ground is equal to the WQV. Draindown is controlled by the restrictive outlet hydraulics 50
51 Other Questions How important is the 2 cell treatment approach? A: The primary benefit is the built in redundancy should one of the cells need repair or maintenance. Is there a specific reason for the 15 flow path? A: Some of our tests with a horizontal flow gravel sluice verified this sizing based on performance. 51

52 52


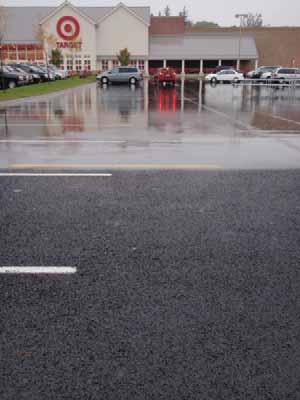
53 Pervious Pavements 53


54 Porous Pavements Design 54


55 Hydraulic Performance of Porous Pavements Porous Asphalt (HSG C) Pervious Concrete (HSG B) 55
56 Water Quantity Date Total Influent Volume (Vi) (gal) Total Effluent Volume (Vo) (gal) % Volume Reduction (Vr) n Average % Median % Standard Deviation Coefficient of Variation
57 Porous Pavement System Water Quality Treatment Porous Asphalt Pervious Concrete PICP % Removal Efficiency

58 Curve Number 58
59 Methods of Teasing CN from the Data 1. Method 1 Depth of Runoff: Measure P and Q, invert basic SCS equation 2. Method 2 Lag Method: Measure P and outflow hydrograph (q), measure lag, estimate CN from lag equations 3. Method 3 Graphical Peak Discharge: Measure Q and q p, estimate CN from peak discharge equations 59
60 Results CN Method 1 CN Method 2 Method A CN Method 2 Method B CN Method 2 Method C CN Method 3 Average Median Natural state for Hinckley-Charlton soil (HSG B/C) =


61 Temperature 61

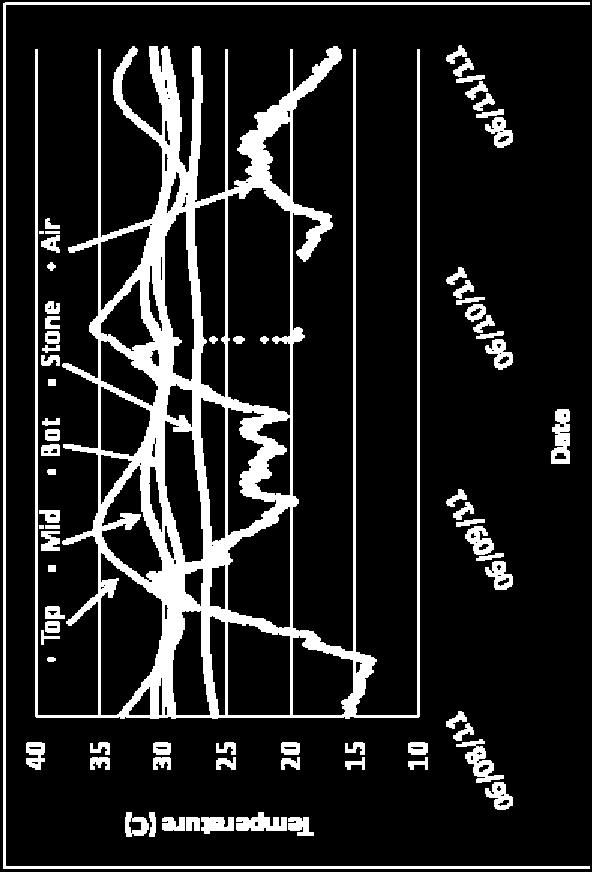
62 Summer Temperatures 62
63 Side by Side. How do they compare?
64 TSS Removal Efficiencies TSS % Removal Efficiency 0
65 DIN Removal Efficiencies DIN % Removal Efficiency 10 0
66 TP Removal Efficiencies TP % Removal Efficiency 10 0

67 Site Level Case Studies 67
68 Boulder Hills, Pelham, NH 2009 Installation of 900 of first PA private residential road in Northeast LID subdivision 55+ Active Adult Community Large sand deposit Cost 25% greater per ton installed
69 LID Design Conventional Site Design
70 Boulder Hills Built on 9% grade Avoided use of 1616 of curbing, 785 pipe, 8 catch basins, 2 detention basins, 2 outlet control structures 1.3 acres less of land clearing Conventional SWM=$789,500 vs LID SWM=$740,300, $49,000 savings (6.2%)
71 Comparison of Unit Costs 6% savings on total cost of SW infrastructure for a ~zero discharge site
72 Greenland Meadows Gold Star Commercial Development Cost of doing business near Impaired Waters/303D Saved $900k in SWM on costly piping and advanced SWM proprietary Brownfields site, ideal location, 15yrs Proposed site >10,000 Average Daily Traffic count on >30 acres
73 Greenland Meadows


74
75 Comparison of Unit Costs


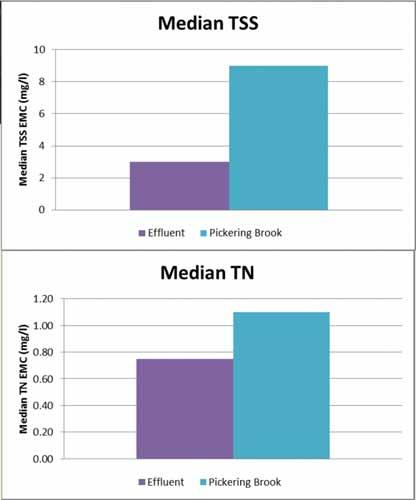

76 Median=0.50 mg/l TN
77 Watershed Level Case Studies
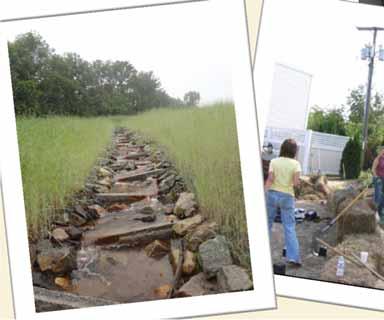
 Total Watershed 185 Pervious 129.4 Impervious Total 55.")

78 Berry Brook Watershed Overview Impervious Surfaces Surface Area (acres) Total Watershed 185 Pervious Impervious Total 55.3 (30%) Source: Adapted from Mapping Impervious Surfaces in the Berry Brook Watershed Complex Systems Research Center, August, 2011

79 79

80 80

81 Inside Slow Sand Filter 81

82 Demolition 82

83

84 Wetland Outlet Structure 84

85 Construction of Step Pools 85

86 Walls at Tightest Floodplain 86

87

88

89 Maintenance Solution

90

91

92


93 Part of the Solution Watershed approach all communities can access
94 Berry Brook
95 Berry Brook
96 Berry Brook
97 Direct Runoff (in) EIC Pre vs. Post (Lower Watershed Station) Pre Measured Post Measured Linear (Pre Measured) Linear (Post Measured) Rainfall Depth (in) 97
98
99


100
101 Interim Results EIC is approximating predevelopment hydrology we are moving toward hydrologic transparency! Data supports the use of EIC in general as a predictor of watershed health (strong for hydrology, developing for chemistry and aquatic health) Need more monitoring IC disconnection as a surrogate for water quality seems to be a very effective measure


102 Maintenance 102

103 1,000 Pound Gorilla Who has primary responsibility for maintenance? local governments or public agencies? States and the Federal Governments? Private property owners and associations?


104 What is Maintenance Often Maintenance only occurs when there is failure There is a perception that LID systems require more maintenance Conventional practices have a high degree of failure and significant cost impacts however we are familiar with it


105 Conventional Systems Detention Basin Retention Pond Stone Swale Low Impact Development Systems Veg Swale Porous Asphalt Gravel Wetland Sand Filter Bioretention Unit (3)
106 Maintenance Complexity is defined as: Minimal Stormwater Professional or Consultant is seldom needed Moderate Stormwater Professional or Consultant is needed half the time Simple Stormwater Professional or Consultant is occasionally needed Complicated Stormwater Professional or Consultant is always needed Erickson, et al, 2010
 Proactive Adapted from Reese, A.J., Presler, H.")
107 Reactive Episodic maintenance, cheap in short term, expensive in the long term Periodic/Predictive Science basis, schedulable activities, more cost effective ($) Proactive Adapted from Reese, A.J., Presler, H.H., Cost effective, preventative operations


108 But we design things to be low maintenance!

109


110
111
112
113


114 Tools of the trade


115 Tools of the trade

116 Tools of the trade

117
118 Components of a bestcase scenario: 1. Appropriate Design 2. Installation. Then Maintenance

119


120


121
122 Economics of Installation vs Maintenance Costs, normalized by area Parameter Vegetated Sand Gravel Porous Wet Pond Dry Pond Bioretention Swale Filter Wetland Asphalt Capital Cost ($) 12,000 13,500 13,500 12,500 22,500 21,550 21,800 Inflated 2012 Capital Cost 14,600 16,500 16,500 15,200 27,400 25,600 26,600 Maintenance and Capital Cost Comparison Personnel (hr/yr) Personnel ($/yr) 823 3,060 2,380 2,808 2,138 1, Subcontractor Cost ($/yr) Total Operational Cost ($/yr) 823 3,060 2,380 2,808 2,138 1,890 1,080 Operation/Capital Cost (%) 6% 19% 14% 18% 8% 8% 4%

123


124

125
126 A tale of two raingardens
127 Maintenance solved?


128 QUESTIONS??? 128