Dissolved Phase Stability Assessment of Benzene at a Downstream Petroleum Facility: A Case Study
|
|
|
- Lillian Copeland
- 5 years ago
- Views:
Transcription


1 Dissolved Phase Stability Assessment of Benzene at a Downstream Petroleum Facility: A Case Study Scott McKean, P.Eng., Stantec Consulting Ltd. Wenhui Xiong, Ph.D., P.Eng., Stantec Consulting Ltd. John Pogson, P.Geo., UFA Co-operative Limited October 15, 2015
2 Agenda 1 What is a stability assessment, importance and information needed? 2 What we did (and why). 3 Results & take away lessons!

3 1 What is a stability assessment? Stability does not imply lack of change, but rather change and variability within predictable and manageable limits over time frames of regulatory interest [1] Objective: Demonstrate that dissolved phase of the contaminant plume is stable and manageable with conventional remediation techniques.

4 Why is Stability Assessment Important? >50,000 abandoned wellsites [2] + >10,000 brownfield sites [3] x $100,000 / site = A $6 BILLION DOLLAR CHALLENGE FOR SOCIETY Source: AER 2014 [1]
5 1 What you need to conduct a stability assessment? Contaminant Info: What it is, Where it came from, Where it is, and Where it is likely going Hydrogeology: Aquifer Properties, Hydraulic Gradients (lateral and vertical) Modeling Data* Soil information (stratification, organic carbon, bulk density, source concentration, plume dimensions, nutrient bioavailability, and natural attenuation by-products)
6 2 What we did (and why). Begin at the beginning, the King said, very gravely, and go on till you come to the end: then stop. - Lewis Carroll, Alice in Wonderland

7 2 Contaminant Info What it is Diesel & Weathered Gasoline Where it came from Top Down Impacts, Primarily Gasoline Downward vertical migration through silty clays, followed by lateral migration through lower, higher permeability units Possible exacerbation due to long screen wells & total fluid recovery ( )
 Buried valley fill with fining upward stratigraphy [4] Downward & lateral (E-SE) hydraulic")
8 2 Site Lithology (Zone A) Two Hydrogeological Units: Fine-Grained Control in Zone A Coarse-Grained Control in Zone B (Zone B) Buried valley fill with fining upward stratigraphy [4] Downward & lateral (E-SE) hydraulic gradients


9 (A) (B)
10 2 Analysis Methods Source: Wade 2013 [5] Non-Parametric Analysis: Mann-Kendall Statistical Analysis using Pro-UCL Visual Plume Analysis: Surfer gridding and volume analysis with Ricker (2008) methods [6] Groundwater Model: 2-D BIOSCREEN-AT Model Benzene used as indicator contaminant
11 2 Mann-Kendall Trend Analysis Pro UCL [7] and ERIMS [8] database used to analyze relative variation (+/-) of data and trends - Easily applied to messy data to provide statistical quantification - Questionable results if near detection limit concentrations present and seasonality may need to be assessed Source: Gilbert 1987 [9]


12 Statistically Significant Confidence Interval


13 2 Visual Plume Analysis Methods
, and representative plume mass (zeroth moment) BUT limitations due to real world data")
14 2 Visual Plume Analysis Methods Calculated positive plume area, positive volume, centre of mass (first moment), and representative plume mass (zeroth moment) BUT limitations due to real world data exist.
15 2 BIOSCREEN-AT Methods BIOSCREEN was used to answer three questions: 1. How far will the plume migrate if we stop work? 2. How long will the plume persist? 3. Is natural attenuation stabilizing the plume? One model for each zone, using default (noncalibrated) inputs and a calibrate scenario to replicate field observations. No-Decay, First-Order Decay, & Instantaneous Reaction Models 2 Models (Zone A/Zone B)
16 3 Results & take away lessons! If there s a way to do it better... Find it" - Thomas Edison
17 3 Keep it Simple.
18 3 Mann-Kendall Results 90 Monitoring Wells Analyzed Upward (1 Significant) 19 Downward (3 Significant) Insufficient Data No Trend Detected Insignificant Trend Detected (70% - 95%) Statistically Significant Trend (>95%)


19 3 Mann-Kendall Results Well #1 statistically significant decreasing trend Well #2 is nearly statistically significant increasing trend due to one impulse


20 Same Data Three Results


21 2000 Time Slice 2006 Time Slice 2010 Time Slice 2014 Time Slice

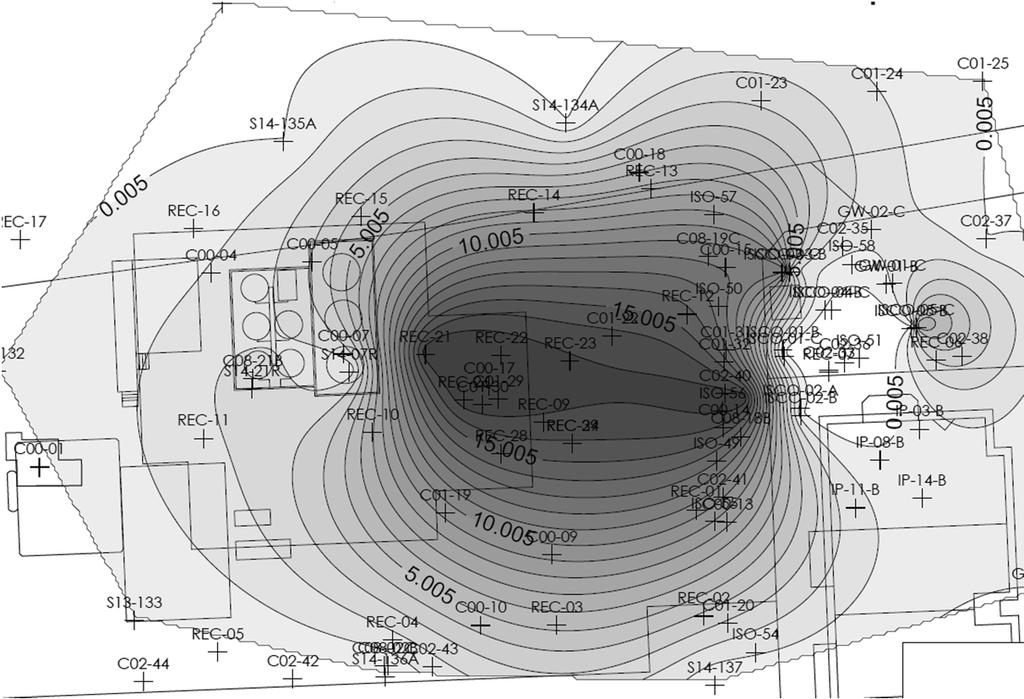
22 3 Visual Plume Analysis Results Main Results: Plume area increased 50% Benzene concentration variable, but stable Average plume mass increased 25% Centre of mass generally stable, moving 5 m east and 1m south in 14 years Mass calculated using grid mesh C01-26 Plume area calculated using zero bounds S14-135A C01-27 S14-134A C


23 3 BIOSCREEN-AT Zone A Results (Year 30) Concentration (mg/l) Uncalibrated Calibrated


24 3 BIOSCREEN-AT Zone B Results (Year 30) Concentration (mg/l) Uncalibrated (1,000 ft) Calibrated (Zoomed to 100 ft)


25 3 BIOSCREEN-AT Zone B Results (Forecasting) Calibrated No Degradation Zone A, Year 80 Slow continual migration due to infinite source Zone B, Year 80 Plume attenuates due to decreasing source No Degradation Calibrated
26 3 Summary Mann-Kendal indicated a generally decreasing or flat concentration trend with time Visual assessment indicated a larger plume area, but with a centre of mass that is barely moving (0.5 m/year) BIOSCREEN indicated that if remediation ceased, Zone B would attenuate and Zone A would migrate very slowly (0.5 m/year) Regulators have provided acceptance of this approach during meetings
27 3 Conclusions Statistics and physics have to play nice together. Consistency with both data analysis and monitoring/sampling programs is key. Calibrate your assumptions and conceptual understanding of your Site against reality!
28 Acknowledgments Innovative analysis and testing provided by: Other Key Contributors from Stantec and UFA: Nicole Sparks, P.Eng., UFA Co-operative Limited Chris Mathies, P.Eng., Stantec Consulting Ltd. Todd Suvan, Stantec Consulting Ltd. David Alberti, M.Sc., P.Geol., MBA., Stantec Consulting Ltd. Norlito Cezar, M.Sc., P.Eng., Stantec Consulting Ltd.
29 Questions? [1] Vanderford, M. (2010), A comprehensive approach to plume stability. Remediation, 21 [2] AER Alberta s Energy Regulator, Reclamation and Remediation, Kevin Ball, March 21, 2014 [3] De Sousa, C.A The Brownfield Problem in Urban Canada: Issues, Approaches and Solutions, A thesis submitted for Doctor of Philosophy, Graduate Department of Geography, University of Toronto. ISBN [4] HCL Hydrogeological Consultants Ltd Parkland County, Part of the North Saskatchewan and Athabasca River Basins, Parts of Tp 050 to 054, R 25, W4M to R 08, W5M, Regional Groundwater Assessment. Prepared for Parkland County. File No.: [5] L.G. Wade, 2013, Organic Chemistry, 8th Edition, Pearson, ISBN [6] Ricker, J A Practical Method to Evaluate Groundwater Water Contaminant Stability. Groundwater Monitoring and Remediation, Vol. 28, No. 4, Fall 2008 (pp ). [7] USEPA. 2013a. ProUCL Software. Version Published September [8] EnVIRsys LLC ERIMS [9] Gilbert, Statistical Methods for Environmental Pollution Monitoring