MISSISSIPPI MILLS WASTEWATER TREATMENT FACILITY 2012 ANNUAL REPORT. Prepared by Deborah Turner Process & Compliance Technician Ottawa Valley Hub
|
|
|
- Dortha Stafford
- 5 years ago
- Views:
Transcription


1 MISSISSIPPI MILLS WASTEWATER TREATMENT FACILITY 2012 ANNUAL REPORT Prepared by Deborah Turner Process & Compliance Technician Ottawa Valley Hub
2 Mississippi Mills Wastewater Treatment Plant Annual Report 2012 Please find below the 2012 Annual Performance Report and other supporting documents for the Mississippi Mills Wastewater Treatment Plant. This report is a requirement of the Environmental Compliance Approval (ECA) (formerly known as the certificate of approval (CofA)) Number DXR5U (issued February 16, 2011). The ECA allotted of the operation of both the lagoon treatment facility as well as the new wastewater treatment plant (WWTP). The new WWTP was brought into service on July 11, This report includes both the lagoon treatment as well as the treatment of the new WWTP. The Consulting Engineer s have listed the Substantial Completion date as July 25, The ECA provides for six (6) month window before new, more stringent, limits and objectives come into effect. Summary: Flow Exceedances: Two Raw Sewage Flow Exceedances to Lagoon: March 13 & 16. Three Lagoon Effluent Flow Exceedances: March 19, 20 & 21. Overflow Events: Two Overflow Events: March 16 and September Spills: Three raw sewage spills: two in February by the on-site contractor and one in September due to heavy rainfall. Effluent Compliance Limits LAGOON WWTP Parameter Compliance Limit Met? Compliance Limit Met? Concentration Loadings Concentration Loadings cbod YES YES YES YES Suspended Solids YES YES YES YES Total Phosphorus YES YES YES YES Total Ammonia YES NO YES YES Flow Assessment: Lagoon Influent Flow Limits: The ECA for the lagoon approves: The system to treat sewage at an average daily sewage flow of 3,020 m 3 /d and a peak sewage flow of 9,900 m 3 /d. The new WWTP ECA approves: A design average daily treatment capacity of 4,700 m 3 /d and a peak treatment capacity of 14,100 m 3 /d. Mississippi Mills Lagoon and WWTP Systems 2012 Annual Report
3 Average Day Flow: The ECA limits the annual average day volume of wastewater pumped from the Gemmill s Bay pumping station to the lagoon to 3,020 m 3 /d. In 2012, the annual average day flow was 2380 m 3 /d - this is/was 78.8 % of the lagoon system capacity. When flows are examined monthly, it is revealed that the 3020 m 3 /d limit was exceeded in March only. The limit of the new WWTP is 4700 m 3 /d. With an annual average day flow of 2380 m 3 /d, the new WWTP is at 35.9 % capacity. The chart below depicts the month average day flow from the Gemmill s Bay Pumping Station. Month Average Daily Flow WWT Influent (m3/d) Average Day Flow ECA Limit Jan Feb Mar Apr May Jun Jul Aug Sep Oct Nov Dec 2012 Peak Day Flow: The ECA limits the volume of wastewater pumped from the Gemmill s Bay pumping station to the lagoon to 9,900 m 3 on any one day. There were two (2) exceedances of this requirement in 2012: these days occurred on March 13 and March 16. The limit for the new WWTP is 14,100 m 3 /d. This limit has not been exceeded. Please refer to the attached Data Exceeded Compliance Range report for a list of dates when peak flow was exceeded and the corresponding volumes. The chart below depicts the peak flow rates from the Gemmill s Bay Pumping Station. Mississippi Mills Lagoon and WWTP Systems 2012 Annual Report 2 of 15
4 Peak Daily Flow: Influent(m3/d) Jan Feb Mar Apr May Jun Jul Aug Sep Oct Nov Dec Peak Day Flow ECA Limit 2012 Lagoon Effluent Flow Limits: The ECA limits: the maximum effluent discharge flow from the sewage works from September 1 to April 31 shall not exceed 5,500 m 3 /d. the maximum effluent discharge flow from the sewage works from May 1 to May 31 shall not exceed 17,300 m 3 /d. No effluent discharge from the sewage works shall be allowed between June 1 and August 31. There were three (3) days where effluent flow limits exceeded 5,500 m 3 /d. These days occurred in March. The May effluent flow limit of 17,300 m3/d was not exceeded. There was no lagoon effluent discharge after May 31, Please refer to the attached Data Exceeded Compliance Range report for a list of dates when the lagoon effluent flow was exceeded and the corresponding volumes. Capacity Assessment: Year Jan - Jul (Lagoon) 2012 Jul Dec (WWTP) Average Day Flow (m 3 /d) Maximum Day Flow (m 3 /d) Design Capacity (m 3 /d) % of capacity, based on average daily flows Mississippi Mills Lagoon and WWTP Systems 2012 Annual Report 3 of 15
5 In 2012 the average day flows (July Dec) was 1687 m 3 /d - this is 35.9 % of system capacity. (a) A summary and interpretation of all monitoring data and a comparison to the effluent limits including an overview of the success and adequacy of the Works Effluent Limits: The requirements of the ECA for the treatment system are as follows: Effluent Limits Parameter Non-Compliance Limits Non-Compliance Limits (September 1 to April 30) (May 01 May 31) Concentration Loading Concentration Loading BOD mg/l 75.5 kg/d 25.0 mg/l 534 kg/d Suspended Solids 25.0 mg/l 75.5 kg/d 25.0 mg/l 534 kg/d Total Phosphorus 0.5 mg/l 1.5 kg/d 0.5 mg/l 10.7 kg/d Total Ammonia 20.0 mg/l 60.4 kg/d 18.4 mg/l 393 kg/d *Based on monthly average concentration and monthly average loading LAGOON WWTP Parameter Compliance Limit Met? Compliance Limit Met? Concentration Loadings Concentration Loadings cbod YES YES YES YES Suspended Solids YES YES YES YES Total Phosphorus YES YES YES YES Total Ammonia YES NO YES YES Effluent Objectives The requirements of the ECA for the treatment system are as follows: Parameter Effluent Objectives Concentrations Loading BOD mg/l 45.3 kg/d Suspended Solids 20.0 mg/l 60.4 kg/d Total Phosphorus 0.3 mg/l 0.9 kg/d Ammonia + Ammonium Nitrogen E. Coli 15.0 mg/l 45.3 kg/d The monthly geometric mean density of E. Coli in effluent should not exceed 200 organisms per 100 ml Mississippi Mills Lagoon and WWTP Systems 2012 Annual Report 4 of 15
6 Effluent Objectives continued: LAGOON WWTP Treatment Objectives met? Treatment Objectives met? Parameter Concentration (mg/l) Loadings (kg/d) Concentration (mg/l) Loadings (kg/d) cbod YES YES YES YES Suspended Solids YES NO YES YES Total Phosphorus NO YES YES YES Total Ammonia NO NO YES YES E. Coli (geo-mean) NO N/A YES N/A Please note: During the WWTP start-up, a six month window of time is provided before more stringent effluent requirements come into effect. This provides operators an opportunity to establish the wastewater treatment process and learning the normal operating parameters. Please find attached a copy of OCWA s Performance Assessment Report (PAR) for the both the lagoon and the WWTP. This report summarizes flow and chemical analysis for samples taken throughout the year. A report for effluent ph, temperature and unionized ammonia is attached for both the lagoon and the new WWTP. A report on Acute Lethality testing for the new WWTP is included. RBT = Rainbow Trout and DM = Daphnia Magna test results. Mississippi Mills Lagoon and WWTP Systems 2012 Annual Report 5 of 15
7 Effluent cbod Month Average Effluent cbod Concentration (mg/l) Effluent cbod Effluent Limit Effluent Objectives 5 0 Jan Feb Mar Apr May Jun Jul Aug Sep Oct Nov Dec 2012 Compliance Limit: The lagoon and WWTP effluent met the compliance limits for cbod effluent concentration. Effluent cbod Objectives: The lagoon and WWTP effluent met the effluent objectives for cbod effluent concentration. Month Average Effluent cbod Loadings (kg/d) cbod Loadings Effluent Limit Effluent Objectives Jan Feb Mar Apr May Jun Jul Aug Sep Oct Nov Dec 2012 Compliance Limit: The lagoon and WWTP effluent met the compliance limits for cbod loadings. Effluent Objectives: The lagoon and WWTP effluent met the effluent objectives for cbod loadings. Mississippi Mills Lagoon and WWTP Systems 2012 Annual Report 6 of 15
8 Effluent Suspended Solids 30 Month Average Effluent Suspended Solids Concentration (mg/l) Suspended Solids Effluent Limit Effluent Objectives 5 0 Jan Feb Mar Apr May Jun Jul Aug Sep Oct Nov Dec 2012 Compliance Limit: The lagoon and WWTP effluent met the compliance limit for effluent suspended solids concentration. Effluent Objectives: The lagoon and WWTP effluent met the effluent objective for suspended solids concentration. Month Average Effluent Suspended Solids Loading (kg/d) Suspended Solids Compliance Limit Effluent Objectives Jan Feb Mar Apr May Jun Jul Aug Sep Oct Nov Dec 2012 Compliance Limits: The lagoon and WWTP effluent met the suspended solids loading requirement of the effluent limits. Effluent Objectives: The lagoon effluent did not meet the suspended solids loading effluent objective due to the increase discharge volume. The WWTP met the objectives. Mississippi Mills Lagoon and WWTP Systems 2012 Annual Report 7 of 15
9 Effluent Phosphorus 1 Month Average Effluent Total Phosphorus Concentration (mg/l) 0.5 Effluent Concentration Compliance Limit Effluent Objective 0 Jan Feb Mar Apr May Jun Jul Aug Sep Oct Nov Dec 2012 Compliance Limits: The lagoon and WWTP effluent met the Total Phosphorus treatment compliance limits. Effluent Objectives: The lagoon effluent did not meet the Total Phosphorus treatment effluent objective. The WWTP met the objectives. 12 Month Average Effluent Total Phosphorus Loading Concentration (kg/d) Effluent Concentration Compliance Limit Effluent Objective 2 0 Jan Feb Mar Apr May Jun Jul Aug Sep Oct Nov Dec 2012 Compliance Limit: The lagoon and WWTP effluent met the Total Phosphorus effluent loading compliance limit. Effluent Objective: The lagoon and WWTP effluent met the Total Phosphorus effluent loading objective. Mississippi Mills Lagoon and WWTP Systems 2012 Annual Report 8 of 15
10 Effluent Ammonia Concentrations 25 Effluent Ammonia Concentration (mg/l): Month Averages Effluent Ammonia Results Compliance Limits Effluent Objectives 5 0 Jan Feb Mar Apr May Jun Jul Aug Sep Oct Nov Dec 2012 Compliance Limit: The lagoon and WWTP effluent met the ammonia concentration compliance requirements.. Effluent Objective: The lagoon effluent did not meet the ammonia concentration objective requirements. The WWTP met the effluent objectives. 450 Month Average Effluent Ammonia Loadings (kg/d) Effluent Ammonia Loading Compliance Limits Effluent Objectives Jan Feb Mar Apr May Jun Jul Aug Sep Oct Nov Dec 2012 Compliance Limit: The lagoon effluent did not meet the ammonia compliance loading requirements. The WWTP met the effluent loading limits. Effluent Objective: The lagoon effluent did not meet the ammonia loading objective requirements. The WWTP met the effluent loading objectives. Mississippi Mills Lagoon and WWTP Systems 2012 Annual Report 9 of 15
11 Effluent Bacteriological (Escherichia coli) 400 EC Concentration: Geometric Mean Month Averages EC Geo-Mean Effluent Objectives Jan Feb Mar Apr May Jun Jul Aug Sep Oct Nov Dec 2012 Effluent Objective: The lagoon effluent did not meet the bacteriological objective requirements The WWTP met the effluent objectives. (b) A description of any operating problems encountered and corrective actions taken On September 08, 2012, the Almonte area received an unusual amount of heavy rainfall in a very short period of time. As a result there was a small raw sewage spill at the WWTP. The spill was because the plant is designed to divert a portion of influent flow to an existing lagoon cell (attenuation pond) in the event of high influent flows. Unfortunately, this portion of the new plant had not yet been commissioned and a pipe plug remained within the pipe leading from the manhole to the lagoon. As a result, the manhole overflowed. OCWA staff members, with agreement from the consulting engineers, removed the pipe plug. Removing the plug should prevent a re-occurrence of this type of manhole overflow spill. Higher than normal effluent total phosphorus results were recorded in the fall of This has been attributed to the attenuation pond and how the operators had been returning its contents back to the plant. Operators have now learned the flow limits of this process. March 19, 2012 a laboratory error failed to provide a requested ammonia test result. The laboratory is reviewing their procedures. Mississippi Mills Lagoon and WWTP Systems 2012 Annual Report 10 of 15
12 (c) summary of all maintenance carried out on any major structure, equipment, apparatus, mechanism or thing forming part of the Works Maintenance Summary OCWA During 2012 a total of 215 Work Orders were completed at the Mississippi Mills Waste Water Treatment plant. Note that up to July the work orders reflected work on the Lagoon System, after that on the new plant. A breakdown of this total is listed below; Corrective 56 Preventative 57 Weekly PM 36 Capital 18 Operational 48 Highlights of the some of the capital expenditures during the year are summarized below; Multiple requirements for both scheduled and emergency use of Vacuum Truck services. Update of the main SCADA system to reflect the changes in the sewage system. Blank Flanges for the 300mm Forcemain. Updated spill containment for Polymer totes. De-commissioning of all the Lagoon cell discharge chambers. Extra labor associated with the startup of the new sewage system. Sewage Pumping Stations During 2012 a total of 457 Work Orders were completed at the Mississippi Mills Sewage Pumping Stations. A breakdown of this total is listed below; Corrective 9 Preventative 50 Weekly PM 392 Capital 5 Operational 1 Highlights of the some of the capital expenditures during the year are summarized below; Camera work at Spring St. SPS Replacement of electrical components at Robert St SPS Replacement of Pump #1 at Hope and Glass SPS Spare impeller for Gemmill s Bay SPS Vac Truck services for various station failures and power outages. Mississippi Mills Lagoon and WWTP Systems 2012 Annual Report 11 of 15
13 Town of Mississippi Mills System Maintenance and Repairs Sewer Cleaning and CCTV work on approximately 7km of sanitary sewers in the Town s south west service quadrant bound by Bridge Street and the Mississippi River; Visual Inspection of all sewer manholes for I & I in Spring of 2012; Capital Investments / New Development Commissioned new $24M Extended Aeration sewage treatment plant North American Construction July 2012; Dewatering of Lagoon Cells B, C, and D Initiated Sludge Management Study Work for Lagoon Sludge Sean Stirling, Geofirma Completed Detailed Designs for Spring Street Sanitary Pump Station Upgrade Plans now at MOE for ECA review. November 22, 2012 Mill Run Phase 1A Subdivision put into service (Sadler Drive/Honeybourne Street); September and November 2012 Town contracted Colautti Construction to 220m of sanitary sewers on Bridge Street, High Street and James Street ranging in size from 200mm to 375mm. Risk Management / Emergency Planning Aug 20/12 (Reso ) Council authorized the Town to become a partner within the Ontario Water and Wastewater Agency Response Network (OnWARN); System Planning and Administration Feb 21/12 (Reso 51-12) Town Council approves the 2012 Water and Sewer Budget. Feb 21/12 (Reso 53-12) Town Council authorizes the municipality to enter into new contracts with the Ontario Clean Water Agency for the period of April 1, 2012 to March 31, First contract is for for Water Treatment/Sanitary Lift Stations and second contract is for new Wastewater Treatment Plant. Mar 19/12 (Reso 93-12) Town Council receives the 2011 Annual Report from OCWA for the Town s wastewater system as per requirements of the Ontario Water Resources Act; Aug 7/12 (Reso ) The Town received the final recommendations of the Water and Wastewater Infrastructure Master Plan by J. L. Richards & Associates dated May 30, This document is intended to guide the Town with infrastructure needs to serve growth through to Town staff have since been directed to modify other policy documents to align with recommendations.; Aug 20/12 (Reso ) Council approved the hiring of an additional Technologist/Compliance Officer commencing 2013 position will be allocated 50% to water and wastewater administration; Oct 15/12 (Reso ) Advancing design review for water replacements and sewer upgrades in the area of Spring / State and Clyde Streets awarded to J. L. Richards & Mississippi Mills Lagoon and WWTP Systems 2012 Annual Report 12 of 15
14 Associates. Driven from findings contained within Water and Wastewater Infrastructure Master Plan; Oct 15/12 (Reso ) Watson & Associates Economists Ltd. have been retained to update water and wastewater rate studies and financial plans findings to be available in early The Committee of the Whole approved the rate structure on Tuesday, January 29, 2013; Consumer Complaints 3 - Blocked/Partially Blocked Sewer Laterals (Private Plumbing Issue) 1 - Blocked/Partially Blocked Sewer Laterals (Public Lateral Repaired) 1 Report of Sewer Odour 1 Blocked Sanitary Sewer Debris from New Construction (d) A summary of any effluent quality assurance or control measures undertaken in the reporting period All sample analysis for compliance reporting are shipped to and analyzed by Accutest, an accredited laboratory in Ottawa. Quality Control & Compliance with Provincial Regulations OCWA uses internal compliance auditing techniques by teams from within the organization but not from within the facility work team. OCWA operates the Mississippi Mills Wastewater Treatment Plant in accordance with provincial regulations. Here is how we do it: Use of Accredited Labs. Analytical tests to monitor your water quality are conducted by a laboratory audited by the Canadian Association for Environmental Analytical Laboratories (CAEAL) and accredited by the Standards Council of Canada (SCC). Accreditation ensures that the laboratory has acceptable laboratory protocols and test methods in place. It also requires the laboratory to provide evidence and assurances of the proficiency of the analyst(s) performing the test methods. Operation by Licensed Operators. The wastewater treatment plant is operated and maintained by the Ontario Clean Water Agency s competent and licensed staff. The mandatory licensing program for operators of drinking water facilities is regulated under the Ontario Water Resources Act (OWRA) Regulation 129/04. Licensing means that an individual meets the education and experience requirements and has successfully passed the certification exam. Sampling and Analytical requirements. OCWA follows a sampling and analysis schedule required by the ECA. Adherence to Ministry Guidelines and Procedures. To ensure the protection of the Public s health and operational excellence, OCWA adheres to the guidelines and procedures developed by the Ministry of Environment Mississippi Mills Lagoon and WWTP Systems 2012 Annual Report 13 of 15
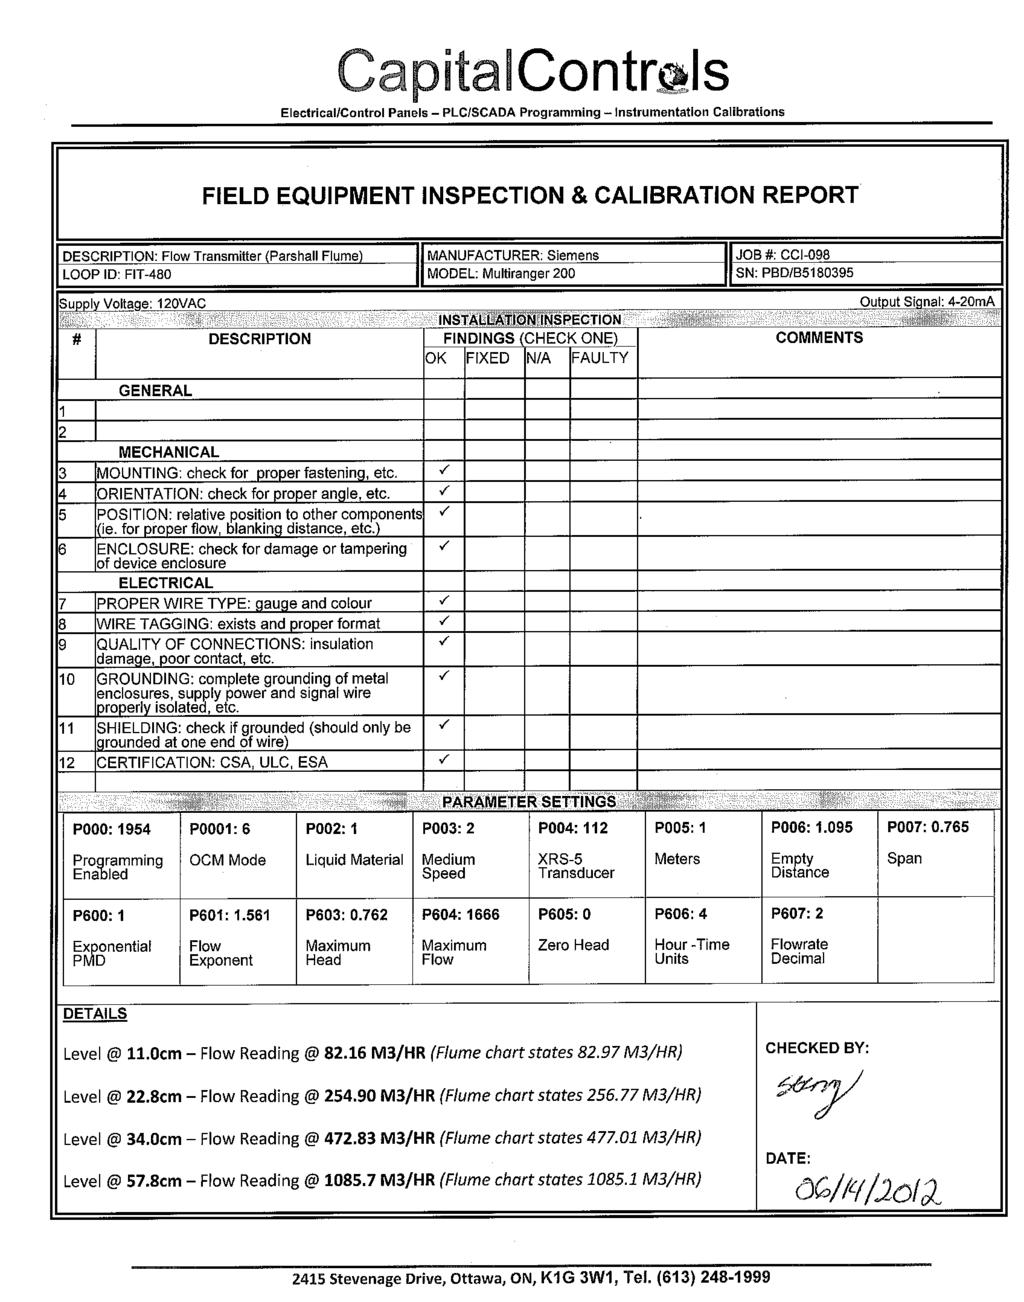
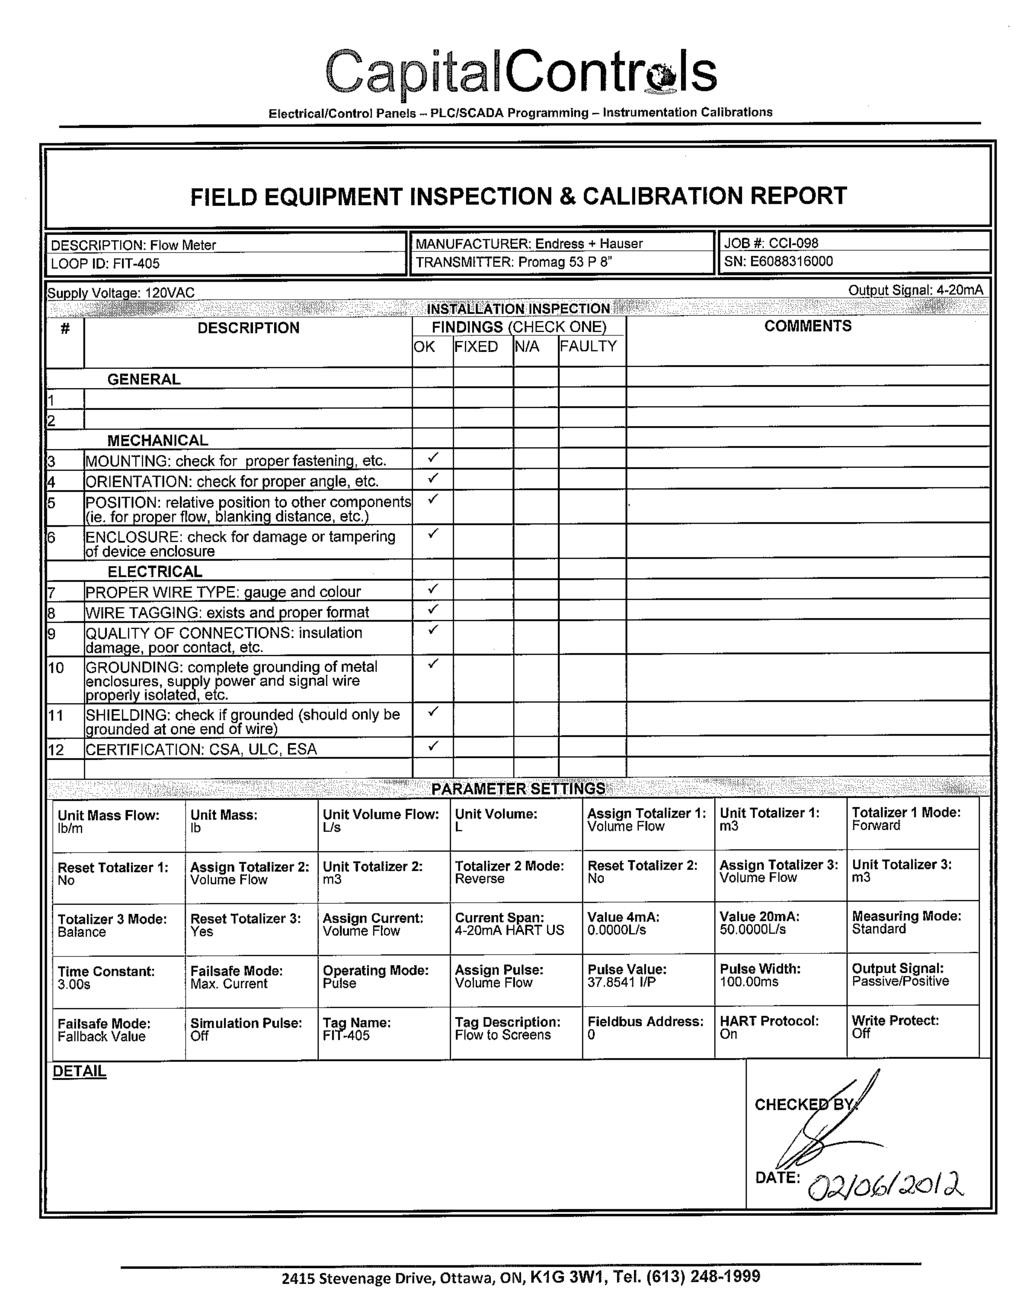
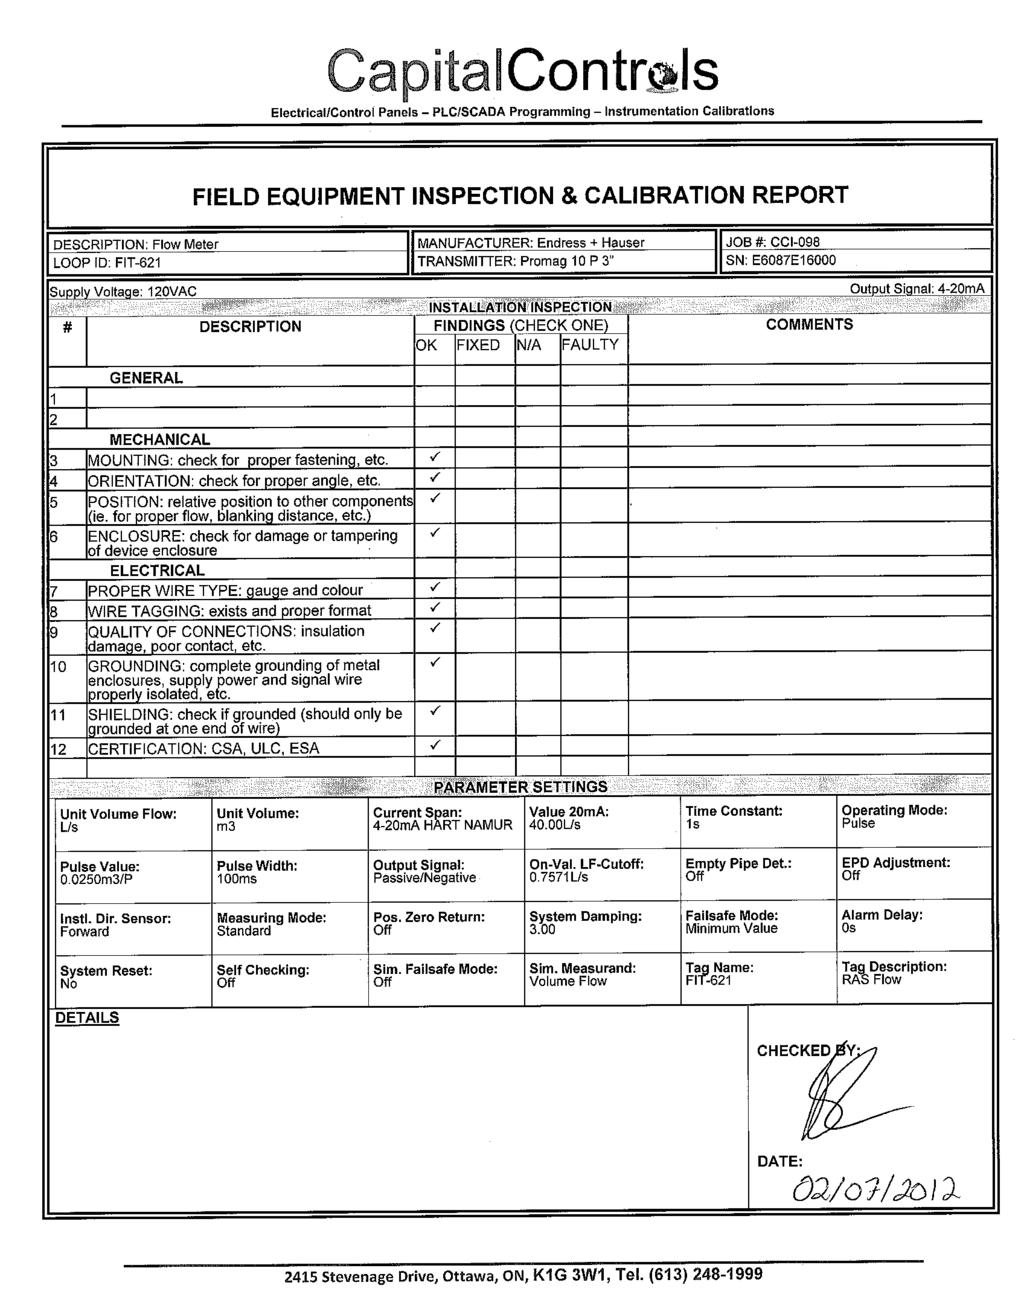
15 (e) A summary of the calibration and maintenance carried out on all effluent monitoring equipment Ensuring the annual calibration of the flow meters is the responsibilities of OCWA s Instrumentation Technician. I have attached a copy of the annual calibration reports for review. (f) A description of efforts made and results achieved in meeting the Effluent Objectives Please refer to previous sections for information on effluent objectives for cbod, Suspended Solids, Total Phosphorus, Ammonia and Bacteriological. (g) A tabulation of the volume of sludge removed from the Works during the reporting period and a summary of the location to where the sludge was disposed Sludge will be removed from the lagoon as part of the decommissioning process. (h) A summary of any complaints during the reporting period and any steps taken to address the complaints The operating authority is not aware of any complaints for the wastewater treatment system. (i) A summary of all by-pass, spill or abnormal discharge events Overflow Events: There were two (2) overflow events during this reporting period. March 16, 2012: m3 released. September 08, 2012: volume unknown as the overflow meter had been decommissioned. Attached are two reports of the Overflow Event (labeled as Bypassing report please remember these are overflow events). Mississippi Mills Lagoon and WWTP Systems 2012 Annual Report 14 of 15
16 Spills: The on-site contractor reported two raw sewage spills. One on Feb 10, 2012 and another on Feb 15, OCWA reported a raw sewage spill on September 08, September 8, 2012: As previously noted, the Almonte area received an unusual amount of heavy rainfall in a very short period of time. As a result, both an overflow event and a spill event occurred. Abnormal discharge As noted previously, there were exceedances of the lagoon effluent flow limits. List of Attachments Data Exceeded Range: Lagoon: first report lists the raw wastewater flow greater than 9900 m3/d Data Exceeded Range: Lagoon: lists the effluent discharge flow greater than 5500 m3/d PARs: Lagoon Performance Assessment Report PARs: WWTP Performance Assessment Report Customized Report: Lagoon: Effluent ph, Temperature and Unionized Ammonia Customized Report: WWTP: Effluent ph, Temperature and Unionized Ammonia Customized Report: WWTP Acute Lethality: Daphnia magna (DM) and Rainbow Trout (RBT) Meter Calibration Reports Bypass / Overflow Daily Report: Lagoon Bypass / Overflow Daily Report: WWTP END Mississippi Mills Lagoon and WWTP Systems 2012 Annual Report 15 of 15
17 Data Exceeded Compliance Range or Normal Operation Range Page 1 of 1 2/8/2013 d_daily_exceeded Facility: Works: Period: Parameter [5678] - Mississippi Mills Wastewater [ IA] - Mississippi Mills Wastewater Lagoon 1/1/2012 to 12/31/2012 << Compliance Range >> <----- Value -----> <--- From - --> <----- To -----> 03/13/2012 Raw Sewage/Flows [ Raw - ] Raw Flow: Peak (m3/d) 10, , /16/2012 Raw Sewage/Flows [ Raw - ] Raw Flow: Peak (m3/d) 16, ,900.0
18 Data Exceeded Compliance Range or Normal Operation Range Page 1 of 1 2/9/2013 d_daily_exceeded Facility: Works: Period: Parameter [5678] - Mississippi Mills Wastewater [ IA] - Mississippi Mills Wastewater Lagoon 1/1/2012 to 4/30/2012 << Compliance Range >> <----- Value -----> <--- From - --> <----- To -----> 03/19/2012 Final Effluent/Flows [ Eff - ] Final Eff. Flow: Sum (m3/d) 5, , /20/2012 Final Effluent/Flows [ Eff - ] Final Eff. Flow: Sum (m3/d) 5, , /21/2012 Final Effluent/Flows [ Eff - ] Final Eff. Flow: Sum (m3/d) 5, ,500.0
19 Ontario Clean Water Agency Performance Assessment Report Wastewater/Lagoon From 01/01/2012 to 12/31/2012 Printed: 2/8/2013 Page 1 of 3 d_par_wwt_wwl_rpt Facility: Works: [5678] - Mississippi Mills Wastewater [ IA] - Mississippi Mills Wastewater Lagoon 01/ / / / / / / / / / / /2012 <-- Total --> <-- Avg. --> <-- Max. --> <-- Criteria--> Flow: Raw: Total Flow 1000 m3 Raw: Avg. Day Flow 1000 m3/day Raw: Max. Day Flow 1000 m3/day Eff: Total Flow 1000 m3 Eff: Avg. Day Flow 1000 m3/day Eff: Max. Day Flow 1000 m3/day Discharge Duration (day/mnth) Biochemical O2 Demand: Raw: Avg. BOD5 (mg/l) Raw: Number of Samples BOD Eff: Avg. BOD5 (mg/l) < < Eff: Number of Samples BOD BOD Loading (kg/d) < < BOD5 Percent Removal < Carbonaceous Biochemical Oxygen Demand: Raw: Avg. CBOD5 (mg/l) Raw: Number of Samples CBOD5 Eff: Avg. CBOD5 (mg/l) Eff: Number of Samples CBOD5 CBOD5 Loading (kg/d) CBOD5 Percent Removal Suspended Solids: Raw: Avg. SS (mg/l) Note: 1. The Total, Average, Max and Criteria summaries are not included in the wastewater XML files submitted to the MOE. 2. The annual average concentrations are calculated by taking the arithmatic mean of the monthly average concentration in the effluent calculated for any particular calendar year. Parameters List: OCWA PDC - MEWS CBOD5 - Carbonaceous Biochemical Oxygen Demand 5 Day; BOD5 - Biochemical Oxygen Demand, 5 Day, Total Demand; Suspended Solids - Residue, Particulate; NH3 + NH4 as N - Ammonium + Ammonia, Total Unfil. Reac. ; TKN - Nitrogen,Total Kjeldahl Unf. Tot; Nitrate as N - Nitrate, Unfiltered Reactive; Nitrite as N - Nitrite, Unfiltered Reactive; E coli - Escherichia Coli MF Legend: Tag group: Eff,Raw Total Phosphorus - Phosphorus, Unfiltered Total Seasonal Compliance Limit: [ Eff ] Final Eff. Flow: Sum (m3/d) = Winter: Jan 1 - Apr 30, Criteria: ; [ Eff ] Final Eff. Flow: Sum (m3/d) = Spring: May 1 - May 31, Criteria: ; [ Eff ] Final Eff. Flow: Sum (m3/d) = Fall: Jun 1 - Dec 31, Criteria:
20 Ontario Clean Water Agency Performance Assessment Report Wastewater/Lagoon From 01/01/2012 to 12/31/2012 Printed: 2/8/2013 Page 2 of 3 d_par_wwt_wwl_rpt Facility: Works: [5678] - Mississippi Mills Wastewater [ IA] - Mississippi Mills Wastewater Lagoon 01/ / / / / / / / / / / /2012 <-- Total --> <-- Avg. --> <-- Max. --> <-- Criteria--> Suspended Solids: Raw: Number of Samples SS Eff: Avg. SS (mg/l) Eff: Number of Samples SS SS Loading (kg/d) SS Percent Removal Phosphorus: Raw: Avg. Phos (mg/l) Raw: Number of Samples Phos Eff: Avg. Phos (mg/l) Eff: Number of Samples Phos Phos. Loading (kg/d) Total Phos Percent Removal Nitrogen Series: Raw: Avg. NH3 + NH4 (mg/l) Raw: Number of Samples NH3 + NH4 Eff: Avg. NH3 + NH4 (mg/l) Eff: Number of Samples NH3 + NH4 NH3 + NH4 Loading (kg/d) Raw: Avg. TKN (mg/l) Raw: # of SamplesTKN Eff: Avg. TKN (mg/l) Eff: # of SamplesTKN Eff: Avg. Nitrate (mg/l) Note: 1. The Total, Average, Max and Criteria summaries are not included in the wastewater XML files submitted to the MOE. 2. The annual average concentrations are calculated by taking the arithmatic mean of the monthly average concentration in the effluent calculated for any particular calendar year. Parameters List: OCWA PDC - MEWS CBOD5 - Carbonaceous Biochemical Oxygen Demand 5 Day; BOD5 - Biochemical Oxygen Demand, 5 Day, Total Demand; Suspended Solids - Residue, Particulate; NH3 + NH4 as N - Ammonium + Ammonia, Total Unfil. Reac. ; TKN - Nitrogen,Total Kjeldahl Unf. Tot; Nitrate as N - Nitrate, Unfiltered Reactive; Nitrite as N - Nitrite, Unfiltered Reactive; E coli - Escherichia Coli MF Legend: Tag group: Eff,Raw Total Phosphorus - Phosphorus, Unfiltered Total Seasonal Compliance Limit: [ Eff ] Final Eff. Flow: Sum (m3/d) = Winter: Jan 1 - Apr 30, Criteria: ; [ Eff ] Final Eff. Flow: Sum (m3/d) = Spring: May 1 - May 31, Criteria: ; [ Eff ] Final Eff. Flow: Sum (m3/d) = Fall: Jun 1 - Dec 31, Criteria:
21 Ontario Clean Water Agency Performance Assessment Report Wastewater/Lagoon From 01/01/2012 to 12/31/2012 Printed: 2/8/2013 Page 3 of 3 d_par_wwt_wwl_rpt Facility: Works: [5678] - Mississippi Mills Wastewater [ IA] - Mississippi Mills Wastewater Lagoon Nitrogen Series: Eff: Number of Samples Nitrate 01/ / / / / / / / / / / /2012 <-- Total --> <-- Avg. --> <-- Max. --> <-- Criteria--> Eff: Avg. Nitrite (mg/l) < 0.1 < 0.26 < < < Eff: Number of Samples Nitrite Disinfection: Eff: Geometric Mean E. Coli per 100 ml 3, , < < < 3, Eff: Number of Samples E. Coli per 100 ml Note: 1. The Total, Average, Max and Criteria summaries are not included in the wastewater XML files submitted to the MOE. 2. The annual average concentrations are calculated by taking the arithmatic mean of the monthly average concentration in the effluent calculated for any particular calendar year. Parameters List: OCWA PDC - MEWS CBOD5 - Carbonaceous Biochemical Oxygen Demand 5 Day; BOD5 - Biochemical Oxygen Demand, 5 Day, Total Demand; Suspended Solids - Residue, Particulate; NH3 + NH4 as N - Ammonium + Ammonia, Total Unfil. Reac. ; TKN - Nitrogen,Total Kjeldahl Unf. Tot; Nitrate as N - Nitrate, Unfiltered Reactive; Nitrite as N - Nitrite, Unfiltered Reactive; E coli - Escherichia Coli MF Legend: Tag group: Eff,Raw Total Phosphorus - Phosphorus, Unfiltered Total Seasonal Compliance Limit: [ Eff ] Final Eff. Flow: Sum (m3/d) = Winter: Jan 1 - Apr 30, Criteria: ; [ Eff ] Final Eff. Flow: Sum (m3/d) = Spring: May 1 - May 31, Criteria: ; [ Eff ] Final Eff. Flow: Sum (m3/d) = Fall: Jun 1 - Dec 31, Criteria:
22 Ontario Clean Water Agency Performance Assessment Report Wastewater/Lagoon From 01/01/2012 to 12/31/2012 Printed: 2/8/2013 Page 1 of 3 d_par_wwt_wwl_rpt Facility: Works: [5678] - Mississippi Mills Wastewater [ ] - Mississippi Mills WWTP (new) 01/ / / / / / / / / / / /2012 <-- Total --> <-- Avg. --> <-- Max. --> <-- Criteria--> Flow: Raw: Total Flow 1000 m3 Raw: Avg. Day Flow 1000 m3/day Raw: Max. Day Flow 1000 m3/day Eff: Total Flow 1000 m3 Eff: Avg. Day Flow 1000 m3/day Eff: Max. Day Flow 1000 m3/day Biochemical O2 Demand: Raw: Avg. BOD5 (mg/l) Raw: Number of Samples BOD Eff: Avg. BOD5 (mg/l) < 4.5 < < 1.0 < 1.2 < < 3.95 < Eff: Number of Samples BOD BOD Loading (kg/d) < < < < < < BOD5 Percent Removal < < < < < Carbonaceous Biochemical Oxygen Demand: Raw: Avg. CBOD5 (mg/l) Raw: Number of Samples CBOD Eff: Avg. CBOD5 (mg/l) < 1.0 < < 1.0 < 1.2 < 1.5 < 1.75 < 2.95 < Eff: Number of Samples CBOD CBOD5 Loading (kg/d) < < < < < < < CBOD5 Percent Removal < < < < < < Suspended Solids: Raw: Avg. SS (mg/l) Raw: Number of Samples SS Note: 1. The Total, Average, Max and Criteria summaries are not included in the wastewater XML files submitted to the MOE. 2. The annual average concentrations are calculated by taking the arithmatic mean of the monthly average concentration in the effluent calculated for any particular calendar year. Parameters List: OCWA PDC - MEWS CBOD5 - Carbonaceous Biochemical Oxygen Demand 5 Day; BOD5 - Biochemical Oxygen Demand, 5 Day, Total Demand; Suspended Solids - Residue, Particulate; NH3 + NH4 as N - Ammonium + Ammonia, Total Unfil. Reac. ; TKN - Nitrogen,Total Kjeldahl Unf. Tot; Nitrate as N - Nitrate, Unfiltered Reactive; Nitrite as N - Nitrite, Unfiltered Reactive; E coli - Escherichia Coli MF Legend: Tag group: EFF-Effluent,RAW-Raw Sewage Total Phosphorus - Phosphorus, Unfiltered Total
23 Ontario Clean Water Agency Performance Assessment Report Wastewater/Lagoon From 01/01/2012 to 12/31/2012 Printed: 2/8/2013 Page 2 of 3 d_par_wwt_wwl_rpt Facility: Works: [5678] - Mississippi Mills Wastewater [ ] - Mississippi Mills WWTP (new) Suspended Solids: 01/ / / / / / / / / / / /2012 <-- Total --> <-- Avg. --> <-- Max. --> <-- Criteria--> Eff: Avg. SS (mg/l) < 3.0 < 2.0 < 3.25 < 2.6 < 4.5 < < Eff: Number of Samples SS SS Loading (kg/d) < < < < < < < SS Percent Removal < < < < < < Phosphorus: Raw: Avg. Phos (mg/l) Raw: Number of Samples Phos Eff: Avg. Phos (mg/l) Eff: Number of Samples Phos Phos. Loading (kg/d) Total Phos Percent Removal Nitrogen Series: Raw: Avg. NH3 + NH4 (mg/l) Raw: Number of Samples NH3 + NH Eff: Avg. NH3 + NH4 (mg/l) < 0.05 < < 0.02 < 0.02 < < < Eff: Number of Samples NH3 + NH NH3 + NH4 Loading (kg/d) < < < < < < 0.08 < Raw: Avg. TKN (mg/l) Raw: # of SamplesTKN Eff: Avg. TKN (mg/l) Eff: # of SamplesTKN Eff: Avg. Nitrate (mg/l) Eff: Number of Samples Nitrate Note: 1. The Total, Average, Max and Criteria summaries are not included in the wastewater XML files submitted to the MOE. 2. The annual average concentrations are calculated by taking the arithmatic mean of the monthly average concentration in the effluent calculated for any particular calendar year. Parameters List: OCWA PDC - MEWS CBOD5 - Carbonaceous Biochemical Oxygen Demand 5 Day; BOD5 - Biochemical Oxygen Demand, 5 Day, Total Demand; Suspended Solids - Residue, Particulate; NH3 + NH4 as N - Ammonium + Ammonia, Total Unfil. Reac. ; TKN - Nitrogen,Total Kjeldahl Unf. Tot; Nitrate as N - Nitrate, Unfiltered Reactive; Nitrite as N - Nitrite, Unfiltered Reactive; E coli - Escherichia Coli MF Legend: Tag group: EFF-Effluent,RAW-Raw Sewage Total Phosphorus - Phosphorus, Unfiltered Total
24 Ontario Clean Water Agency Performance Assessment Report Wastewater/Lagoon From 01/01/2012 to 12/31/2012 Printed: 2/8/2013 Page 3 of 3 d_par_wwt_wwl_rpt Facility: Works: [5678] - Mississippi Mills Wastewater [ ] - Mississippi Mills WWTP (new) Nitrogen Series: 01/ / / / / / / / / / / /2012 <-- Total --> <-- Avg. --> <-- Max. --> <-- Criteria--> Eff: Avg. Nitrite (mg/l) < 0.1 < 0.1 < Eff: Number of Samples Nitrite Disinfection: Eff: Geometric Mean E. Coli per 100 ml < 10.0 < 10.0 < < 10.0 < < 10.0 < < Eff: Number of Samples E. Coli per 100 ml Note: 1. The Total, Average, Max and Criteria summaries are not included in the wastewater XML files submitted to the MOE. 2. The annual average concentrations are calculated by taking the arithmatic mean of the monthly average concentration in the effluent calculated for any particular calendar year. Parameters List: OCWA PDC - MEWS CBOD5 - Carbonaceous Biochemical Oxygen Demand 5 Day; BOD5 - Biochemical Oxygen Demand, 5 Day, Total Demand; Suspended Solids - Residue, Particulate; NH3 + NH4 as N - Ammonium + Ammonia, Total Unfil. Reac. ; TKN - Nitrogen,Total Kjeldahl Unf. Tot; Nitrate as N - Nitrate, Unfiltered Reactive; Nitrite as N - Nitrite, Unfiltered Reactive; E coli - Escherichia Coli MF Legend: Tag group: EFF-Effluent,RAW-Raw Sewage Total Phosphorus - Phosphorus, Unfiltered Total
25 Ontario Clean Water Agency Monthly Process Data Report Page 1 of 1 Printed on: 2/13/2013 d_monthlyprocessrep Municipality: Facility: Works: Classification: Receiver: Town of Almonte [5678] - Mississippi Mills Wastewater [ IA] - Mississippi Mills Wastewater Lagoon Class 3 Wastewater Treatment Mississippi River Period: 01/01/2012 to 12/31/2012 Serviced Population: 4,910 Total Design Capacity(m³/day): 0 Final Effluent\Effluent NH3 + NH4 as N (mg/l) ph Jan/2012 Feb/2012 Mar/2012 Apr/2012 May/2012 Jun/2012 Jul/2012 Aug/2012 Sep/2012 Oct/2012 Nov/2012 Dec/2012 <-- Summary --> Avg Max Min Un-ionized Ammonia (NH3) (mg/l) Max Temperature (C) Max Min Note:? Calculation not verifiable. At least one result reported as < and at least one result reported >.
26 Ontario Clean Water Agency Monthly Process Data Report Page 1 of 1 Printed on: 2/13/2013 d_monthlyprocessrep Municipality: Facility: Works: Classification: Receiver: Town of Almonte [5678] - Mississippi Mills Wastewater [ ] - Mississippi Mills WWTP (new) Class 3 Wastewater Treatment Mississippi River Period: 01/01/2012 to 12/31/2012 Serviced Population: 4,910 Total Design Capacity(m³/day): 0 Jan/2012 Final Effluent\Effluent - Effluent Un-ionized Ammonia (NH3) (mg/l) Max Feb/2012 Mar/2012 Apr/2012 May/2012 Jun/2012 Jul/ Aug/ Sep/ Oct/ Nov/ Dec/ <-- Summary --> Min ph Max Min Temperature (C) Max Min Note:? Calculation not verifiable. At least one result reported as < and at least one result reported >.
27 Ontario Clean Water Agency Monthly Process Data Report Page 1 of 1 Printed on: 2/13/2013 d_monthlyprocessrep Municipality: Facility: Works: Classification: Receiver: Town of Almonte [5678] - Mississippi Mills Wastewater [ ] - Mississippi Mills WWTP (new) Class 3 Wastewater Treatment Mississippi River Period: 01/01/2012 to 12/31/2012 Serviced Population: 4,910 Total Design Capacity(m³/day): 0 Jan/2012 Final Effluent\Effluent - Effluent DM effl. conc) Max Feb/2012 Mar/2012 Apr/2012 May/2012 Jun/2012 Jul/2012 Aug/2012 Sep/ Oct/2012 Nov/2012 Dec/ <-- Summary --> 0 Min Secondary Effluent\Effluent - Effluent RBT (% 100% effl.) Max Min Note:? Calculation not verifiable. At least one result reported as < and at least one result reported >.
28
29
30
31
32
33
34
35
36
37
38
39
40
41
42
43
44
45
46
47
48
49
50
51
52
53
54
55
56
57
58 Tel:61arle12toOttawaValeyHub2PocnPO atlaFteceaxrs,:6nN,3CrK25es7C74PentCCalibration / Inspection Check Project: MISSISSIPPI MILLS WWTP Description METER FLOW LAGOON EFFLUENT 7Project: Equipment ID: Make: MILL Technician: Tom K. Model# : OCMIII Type: Parshall Flume Serial# : Project Org.: 5678 Signature: _ INT.DIA: 12 " Work Order Ref.: _ Cal. FS: _ liter/s Range: m^3/d Date: 13/04/12 Customer FS: _ liter/s Sensor Factors: _ No. V. Setting (m/sec) P(psi) Head (cm) Head (m/w.c) Flow (m^3/d) CAL. Standard Display Before Display After Display error (%) O/P. Theo (madc) O/P. Before CAL.(mAdc) O/P. After CAL.(mAdc) O/P Bef. %Err (%F.S) O/P Aft. %Err (%F.S) ##### % 0.00% ##### % 0.62% ##### % 1.19% ##### % 1.75% ##### % 0.06% % Error Calibration Characteristic 2.00% 1.50% 1.00% 0.50% 0.00% -0.50% -1.00% -1.50% -2.00% 0% 25% 50% 75% 100% Output, Display (% F.S) O/P Aft. %Err (%F.S) O/P Bef. %Err (%F.S) Display error (%) Comments:
59
60
61
62
63
64
65
66
67
68
69
70
71
72
73
74
75
76

77
78

79
80
81

82

83

84
85 Ontario Clean Water Agency Recording of Bypassing Daily Report Page 1 of 1 2/13/2013 d_bpr_daily Facility: Works: Year: [5678] - Mississippi Mills Wastewater [ IA] - Mississippi Mills Wastewater Lagoon 2012 Date Location Type Station Start Time (hh:mm) Duration Hours Volume m3 Disinfect Reason BOD5 (mg/l) SS TP E.Coli (mg/l) (mg/l) (# / 100mL) 03/16/2012 SPS Primary PrBy 04: Yes Heavy Precipitation ,000 Definitions: Primary Effluent - The discharge of raw sewage subject to no treatment except grit removal and/or chlorination. Secondary Effluent - The discharge of sewage that has undergone solids removal and bypassed the secondary treatment process. Legend: Station:
86 Ontario Clean Water Agency Recording of Bypassing Daily Report Page 1 of 1 2/13/2013 d_bpr_daily Facility: Works: Year: [5678] - Mississippi Mills Wastewater [ ] - Mississippi Mills WWTP (new) 2012 Date Location Type Station Start Time (hh:mm) Duration Hours Volume m3 Disinfect Reason BOD5 (mg/l) SS TP E.Coli (mg/l) (mg/l) (# / 100mL) 09/08/2012 SPS Primary PRBY 00: Yes Heavy Precipitation ,590,000 Definitions: Primary Effluent - The discharge of raw sewage subject to no treatment except grit removal and/or chlorination. Secondary Effluent - The discharge of sewage that has undergone solids removal and bypassed the secondary treatment process. Legend: Station: PRBY - Overflow: Gemmills Bay SPS