The Environmental Footprint of Shipping by 2050
|
|
|
- Penelope Page
- 5 years ago
- Views:
Transcription


1 The Environmental Footprint of Shipping by 2050 Nikolaos P. Ventikos Associate Professor, NTUA School of Naval Architecture and Marine Engineering Laboratory for Maritime Transport

2 What is this presentation about? 2050??? TODAY 2

 Water Ballast")
3 The impact of shipping Accidental Oil spills Air Emissions Garbage Other oil spills (fuel transfer, tank cleaning) Water Ballast Sludges 3
4 The impact of shipping Why do we care about emissions when shipping accounts for such a small amount of the global emissions? International Council on Clean Transportation 4
5 The impact of shipping Shipping is one of the most energy efficient industries, but is this enough for the goals of 2050? IMO, 3 rd GHG Study (2014) 5
 C O 2 emmissions/transport work -40% GHG emissions +27% in energy efficiency baseline 2008 By 2050-70% ave.")
6 The regulatory context (limit rise in global temperature by o C) By % ave. By 2030 (All sectors) C O 2 emmissions/transport work -40% GHG emissions +27% in energy efficiency baseline 2008 By % ave. By 2050 (Transport) C O 2 emmissions/transport work -60% GHG emissions baseline % in GHG emissions (MEPC 72, 2018) (2030 EU Climate & Energy Framework) (2050 EU Low Carbon Economy) 6


7 The regulatory context DCS MRV Sulphur Cap Sulphur Cap The ultimate goal for shipping should be: EEDI, EEOI, EVDI To create the right path towards decarbonization by utilizing new technologies Invest not / simple promote and LNG temporal solutions!!! What about speed limit and slow steaming? 7

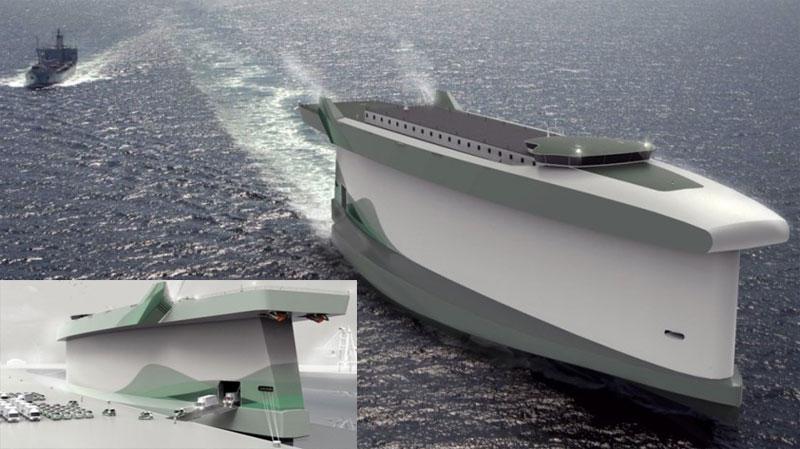
8 Options towards decarbonization Effort Phase How? Indicative Technologies Reduced Emissions Vessels Reduced Consumption Vessels Zero Emissions Vessels By filtering HFO emissions By using mature alternative fuels with lower emissions By changing how ships are designed to increase hull, propulsion, and machinery efficiency By using assistive zero emissions technologies By changing the main power source from fossil fuels Scrubbers LNG, LPG, Methanol Hull optimization, Waste heat recovery, Air lubrication Hybrid propulsion Electric propulsion, Fuel Cells, Hydrogen Renewable energy sources: Solar and Wind 8

9 Options towards decarbonization LNG and alternatives Is LNG really cleaner than oil? What about methane slip? LNG 1 ton of HFO burned in a ship s engine produces 3.11 tons of CO 2 1 ton of LNG burned in a ship s engine produces 2.75 tons of CO 2 LNG is a temporary solution What about synthetic BIO-FUELS? 9
, the most promising")
 Solid Oxide FC (SOFC)")

10 Options towards decarbonization Fuel Cells According to EMSA (2017), the most promising Fuel Cell technologies are: Proton Exchange Membrane FC (PEMFC) Solid Oxide FC (SOFC) Criteria included: cost, power output, flexibility, maturity, size, safety, efficiency etc. 10


11 Options towards decarbonization Zero Emissions Vessels Electric propulsion may either be supported by batteries or fuel cells powered by liquid hydrogen. Existing projects are limited to small Ro-Pax Ferries! 11

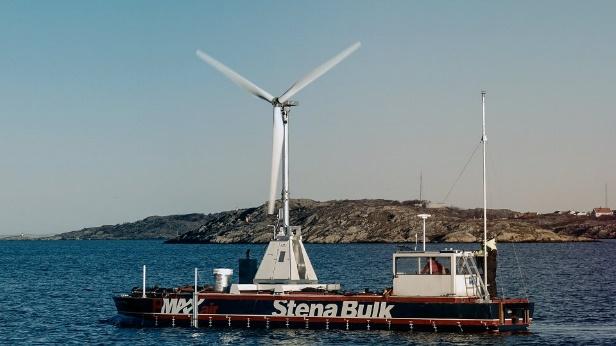
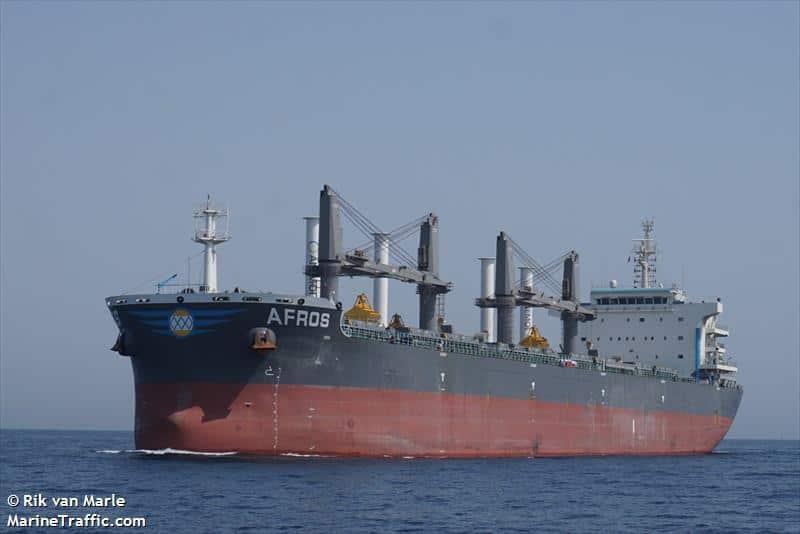
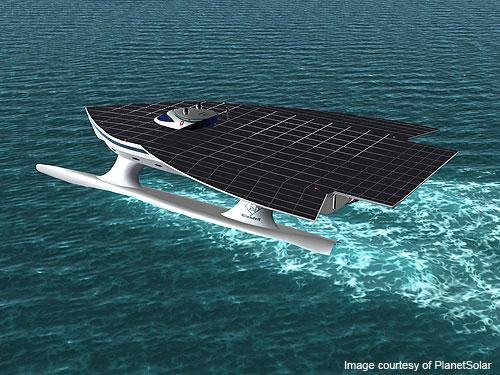
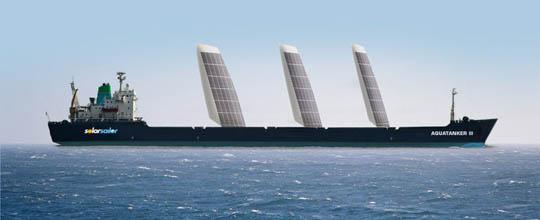
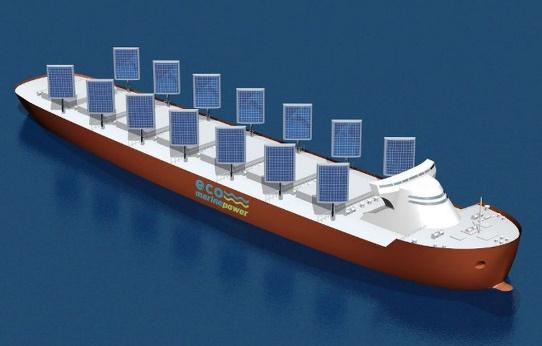
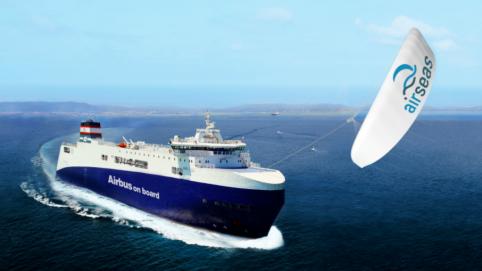
12 Options towards decarbonization Zero Emissions Vessels There is an abundance of wind power concepts (CE Deflt, 2016) And pioneering applications BluePlanet s Bulk Carrier retrofitted with Rotors. But solar power may be an option too 12


13 Options towards decarbonization Barriers for decarbonization Externalities of carbon-heavy technologies Capability of fleet renewal and retrofits (Halim et al., 2018) Zero Emissions Technologies are not costeffective (LR, 2017) Incentives Cost-Effectiveness Complexity Uncertainty Relationship to crew competence (DNVGL, 2017) Actual Environmental Performance Can we apply solutions without considering their effects on the system life cycle? 95% of current Hydrogen production comes from LNG! 13
14 Environmental Footprint by 2050 Phase Indicative Technologies Savings Source Reduced Emissions Vessels Scrubbers LNG, LPG, Methanol Maybe -20% in GHG emissions DNVGL (2017) Reduced Consumption Vessels Hull optimization, Waste heat recovery, Air lubrication Hybrid Propulsion Up to -25% in total energy (combined) Over 10% in fuel Foreship (2016), DNVGL (2017), Halim et al. (2018) Zero Emissions Vessels Electric propulsion, Fuel Cells, Hydrogen Renewable energy sources: Solar and Wind No fossil fuel No emissions? 14

15 Environmental Footprint by 2050 We are very uncertain of what might happen by 2050! Different possible combinations of reduction measures outline different decarbonization paths with different expected impacts. By 2035 we may be able to achieve up to -95% in CO 2 if we apply different strategies. (Halim et al., 2018) 15
16 Environmental Footprint by 2050 The vision of Sustainable Shipping The ability to obtain or have access to desired goods, services, etc. Accessibility Resource constrains The acceptance of natural (e.g. for fossil fuels) and social constraints (e.g. in safety) Equity The balanced distribution of transport benefits and costs among people 16

17 Environmental Footprint by 2050 The vision of Sustainable Shipping Sustainable A Maritime Maritime Transport Transportation System is sustainable System is when the safe, it has secure, the capability efficient to and offer reliable and maintain transport non-declining of goods across and the efficient world, while accessibility minimising by observing pollution, the principles maximising of equity energy and resource efficiency constraints and ensuring resource conservation (Chatzinikolaou and Ventikos, (IMO, 2013) 2011) Every action should be assessed with sustainability criteria! 17

18 Environmental Footprint by 2050 Realistic, Large-Scale Implementation Need for radical change! 18

19 Thank you very much for your attention! Nikolaos P. Ventikos 19