Evaluating Water Quality from Source to Tap: Using Hydraulic Modeling, Statistical Analysis and Other Tools to Improve Water Quality
|
|
|
- Juniper York
- 5 years ago
- Views:
Transcription
1 Evaluating Water Quality from Source to Tap: Using Hydraulic Modeling, Statistical Analysis and Other Tools to Improve Water Quality Phil Brandhuber PhD 2014 HDR, all rights reserved Surface Water Treatment Workshop
2 Topics Overview of Distribution System Water Quality Tools for Evaluating Distribution System Water Quality Example Combining Distribution System Modeling and Water Quality Analysis 2014 HDR, all rights reserved.


3 The Point of this Talk Quality of water leaving plant Quality of water at customer tap
4 TTS Three Characteristics of Distribution Systems That Cause Changes in Water Quality Characteristic Description Implication T Time Water resides for hours to days Slow chemical reactions are important T Temperature Water temperature adjusts to match ground conditions Chemical reactions proceed at different pace than plant Effects change by seasons S Surfaces Large surface areas for water to contact Reactions at pipe/tank surfaces can dominate water quality Smallest pipes closest to consumer Treatment disturbs chemical equilibrium the distribution system ties to restore chemical equilibrium
colored water (Fe/Mn) o Slim/biogrowth o Opportunistic pathogens o Taste")
5 Examples of TTS Time o DPB formation o Free chlorine decay o Chloramine decomposition Temperature o Nitrification o Calcium carbonate scaling Surface o Lead/copper release o (Dis)colored water (Fe/Mn) o Slim/biogrowth o Opportunistic pathogens o Taste and odor
6 Time is Key Factor in TTHM Formation
7 When Temperature Increases so can Nitrification Temperature Total Cl 2 :Nitrite

8 A Lot Goes on at a Pipe s Surface Center for Biofilm Engineering Montana State University

9 Features of Hydraulic Design Impact Distribution System Water Quality Get water to consumer Match supply to demand Deliver adequate pressure Provide fire flow Unlike wine, water does not get better with age More storage Greater water age Reduced water quality

10 Maintaining Water Quality in Distribution Systems is not a New Concept. Pompeii Drinking Water Distribution System AD 79 (Ref C.K. Rasmussen 2017)

11 But we All Know What Happened to Rome
12 Overview of Distribution System Water Quality Tools for Evaluating Distribution System Water Quality Combining Distribution System Modeling and Water Quality Analysis 2014 HDR, all rights reserved.

13 Tools for Distribution System Water Quality Analysis Water quality mapping o Min/max/average o Box and whisker diagrams Cumulative distribution diagrams Formation and decay studies Hydraulic modeling o Water age o Source trace/blend ratio

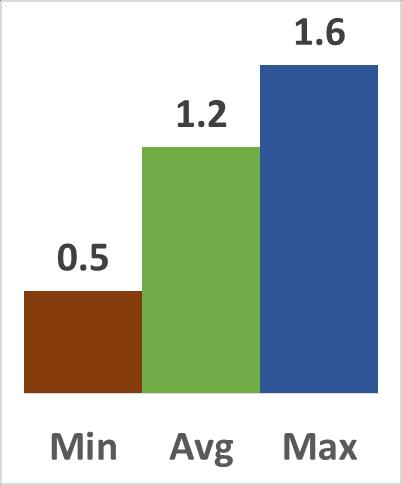
14 Min/Max/Average Water Quality Maps Total chlorine (mg/l)

15 Box & Whisker Water Quality Diagram Maximum 90 th percentile Average Medium 10 th percentile Minimum
16 Cumulative Distribution Water Quality Diagram X-Axis Y-Axis Lowest Average Site 0% Sites in between Highest Average Site 100% Chloramine system Sites with possible nitrification
17 Average Cl 2 Residual at Distribution System Sampling Sites Lower residual Greater water age More storage Greater Cl 2 demand Cl 2 mg/l
18 Average Cl 2 Residual at Distribution System Sampling Sites Greater residual Less water age Less storage Reduced Cl 2 demand Cl 2 mg/l
19 Formation and Decay Studies Useful Studies Chlorine demand/decay Chloramine demand/decay Chloramine decomposition DPB formation o Formation potential (FP) o Simulated distribution system (SDS) o Uniform formation potential (UFP)

20 Hydraulic Modeling (EPANET Example) From EPA Website Compute friction head loss Calculate minor head losses Model constant or variable speed pumps Compute pumping energy and cost Model various types of valves, Account for any shape storage tanks Consider multiple demand And so on.
21 Overview of Distribution System Water Quality Tools for Evaluating Distribution System Water Quality Combining Distribution System Modeling and Water Quality Analysis 2014 HDR, all rights reserved.

22 Colorado Case Study Serve 1.3 million people o 350 MGD summer demand o 130 MGD fall demand 3 WTPs 160 Pressure Zones 26 Pump Stations 35 Storage Reservoirs o 375 MG Storage Free chlorine disinfection Chloramine residual
23 Project Scope Conduct system-wide tracer test Complete system-wide water quality evaluation Using improved model recommend improvements for areas of nitrification and low chlorine residual
24 The Process Calibrate Hydraulic Model Historic Water Quality Data Analysis Laboratory Analysis Total Cl 2 Decay Identify Problematic Sites Out of Family Sites
25 The Process Calibrate Hydraulic Model

26 Tracer Chemical Fluoride Considered and Rejected o Background concentration too high Calcium Chloride Selected o Chloride easily measured by conductivity o Acceptable to Colorado Department of Health X

27 Tracer Make-up NSF-approved/food grade gallon tanker trucks Targeted dose to provide 3X background conductivity o Background µs/cm o Dose µs/cm Check for localized CaCO 3 precipitation Taste test before release!

28 Tracer Monitoring Locations 37 Permanent Locations + 26 Temporary Locations 63 Total Locations
29 Tracer Slug Release Performed in Fall MGD Demand o 100 MGD from WTP#1 o 30 MGD from WTP#2 o WTP#3 offline Released over 3.5 hours from Tank at WTP#1 CaCl 2 Introduced Pulse Released
30 Tracer Results 7 hour travel time site
31 Comparing Model to Tracer 7 hour travel time site Approximately 7 hours following release of Primary Pulse Approximate Pulse Length = 3.5 hours Approximately 4.5 days later emptying of remaining tracer from Reservoir No. 3 into system
32 Comparing Model to Tracer: 24 hour travel time site Excellent match time of travel
33 Comparing Model to Tracer 24 hour travel time site Conductivity not as good
34 Example SCADA Error: valve indicated closed when open Valve actually open Valve erroneously indicated closed

35 Calibrated Model - Baseline Water Age Results

36 Baseline Total Chlorine Residual Results
37 The Process Historic Water Quality Data Analysis
38 Cumulative Percentage (%) Cumulative Distributions of Average Total Chlorine Residual at Distribution System Sample Points 100% 90% 80% 70% 60% 50% 40% 30% 20% 10% 0% Total Cl2 (mg/l)
39 Identification of Problematic Distribution Sample Sites Characteristic The lowest average total chlorine concentration (< 10 th percentile) for the entire system The lowest individual samples of total chlorine concentration (< 10 th percentile) for the entire system Greatest variability (difference between lowest and greatest) in total chlorine concentration over the course of the year Indication of Consistently high water age Very high water age Nitrification Large variation in age of water provided to site Nitrification Impact of reactive flushing or other system operations targeted at WQ
40 The Process Laboratory Analysis Total Cl 2 Decay

41 Treated Water Total Chlorine Decay Tests Two Conditions (2015) o June (run-off) o September (baseflow) 4 treated waters o WTP#1, o WTP#2, o WTP#3 o WTP #2/#3 blend 240 hour test length Results fitted to second order decay curve
42 Inherent Bulk Water Residual Decay Test June Run-off
43 The Process Identify Problematic Sites Out of Family Sites
44 Residual Decay due to Distribution System Basis of Out of Family Analysis
45 Combining Decay Study and Model

46 Identification of Problematic Total Cl 2 Sample Sites

47 Locations of Excessive Residual Decay Out of Family Analysis
48 Additional Recommendations Made by Study Accelerate schedule for seasonal removing tanks from system Seasonally reduce levels in tanks Seasonal deep cycling of tanks Rerouting for some flows to improve mixing Modify nitrification monitoring program Consider base loading WTP#3 rather than WTP#1 during late fall Add/modify location of sample points Better characterize inherent residual decay rates from each plant

49 Wrapping - up Water quality leaving plant quality at customer tap Tools exist for evaluating changes to water quality caused by the distribution system Combining hydraulic modeling and water quality analysis improves customer water quality
50 Questions? Phil Brandhuber Kathryn Jones Patrick Haney Brian King