Application of SEBAL for Western US Water Rights Regulation and Planning
|
|
|
- Randolf Hines
- 5 years ago
- Views:
Transcription

1 Application of SEBAL for Western US Water Rights Regulation and Planning ICID Workshop on Use of Remote Sensing of Crop Evapotranspiration for Large Regions, September 17, 2003, Montpellier, France Richard G. Allen, Univ. Idaho Tony Morse, Idaho Dept. Water Resources M. Tasumi, Univ. Idaho with cooperation by James L. Wright, USDA-ARS


2 Irrigation Water Management: Water to feed the World

3 ET mapping with SEBAL Surface Energy Balance Algorithm for Land Dr. Wim Bastiaanssen, WaterWatch, The Netherlands Applied in Idaho with Landsat 5 and Landsat m pixel size
4 Energy Balance for ET ET is calculated as a residual of the energy balance R n H ET Basic Truth: Evaporation consumes Energy ET = R - G - H n G The energy balance includes all major sources (R n ) and consumers (ET, G, H) of energy
5 Reasons for Selecting SEBAL ET predictions can be internally calibrated to known ET rates or conditions at the ground No need to apply extensive atmospheric corrections (because of internal calibration)
6 Magic of SEBAL Sensible Heat by near surface dt: H = ( ρ c p )(T ns -T a ) / r a T ns = Near Surface Temperature air temperatures Linear dt vs. Ts function T a r a H (T ns -T a ) T ns Surface Temperature

7 Idaho from Landsat Major Irrigated areas in SE Idaho

8 300 km 2 million ha with 30 m resolution


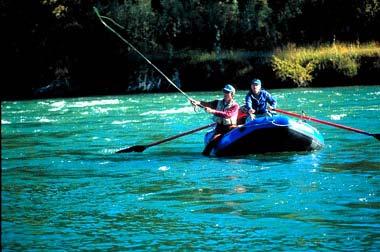
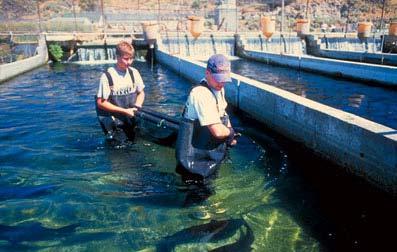
9 Nature Recreation Aquaculture Agriculture

10 Snake River Plain and Aquifer Yellow dots are ground-water wells Junior Irrigators from Aquifer ~1960 Senior Irrigators from River ~1900 Junior consumption from Aquifer Injures Senior River Rights
11
12 Need for ET Maps in Idaho Quantify Net Depletion from Ground-water Pumping Comparison of ET with Water Rights Calculate Natural and Irrigation-Induced Recharge to Aquifers Determine Actual ET for Developing better Crop Coefficient Curves 10/15/03
13 The Water Balance Surface Diversions + Precipitation Pumpage Evaporation + Transpiration?? Surface Returns Root zone Soil Water Storage?? Ground Water River Spring Discharge Evapotranspiration is used to predict Aquifer Recharge and to Extend GW Pumping Data

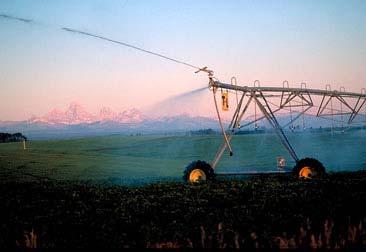
14 Why use High Resolution Imagery? ET for individual Fields is Critical for Water Rights, Water Transfers, Farm Water Management Oakley Fan, Idaho


15 Path 40: Minidoka - 24-hour ET 8/14/00
16 Validation of ET maps
17 Confirmation of ET from Remote Sensing with Independent Measurements is Essential Validation can be done anywhere in the world ( physics are physics everywhere) But Ground data MUST be Accurate ( No Data are better than Bad Data ) 12/17/01

")
18 Confirmation with Lysimeter Measurements: Lysimeter at Kimberly (Wright) 12/17/01
19 ET r F = Fraction of ET r --Consistency through the day ET, mm/hour (ET r F = K c ) Kimberly Lysimeters - July 07, 1989 Sugar Beets Time of Day Lysimeter 2 data by Dr. J.L. Wright, USDA-ARS ETrF ETrF ETr Daily Average ETrF
20 Validation in the Snake River Basin ET during period, mm Impact of using Kc from a single day to represent a period: Kimberly 1989 Sugar Beets, 1989 Kimberly, Idaho 0 04-May 21-Jun 20-May 07-Jul 18-Apr 05-Jun 23-Jul 25-Sep Lys. Kc on Sat. date x sum ETr SEBAL ET for period Sum. all lysimeter meas. (Truth) Lysimeter data by Dr. J.L. Wright, USDA-ARS
21 ET - April-Sept., mm - Kimberly, 1989 Sugar Beets mm 714 mm Total Lysimeter SEBAL
22 Application to the Bear River Basin Scale Km Compliments of IDWR Bear River Compact Three USA States Need ET maps for: Total depletion by each state Total hectares of development Monitoring
23 Validation in the Bear River Basin ET by Lysimeters and SEBAL Montpelier, Idaho Ratio of ET to Reference ET hay cut lysimeter = 7 day averages, only July August Sept. Oct. Lysimeter SEBAL Day of Year Avg. Etc/Etr by lysimeter Ratio of Etc to Etr by SEBAL
24 ET - July-Oct., mm - Montpelier, 1985 Meadow Hay mm 405 mm Total Lysimeter SEBAL
25 Other Products and Applications of ET maps
26 Rangeland Petroleum Tanks 1,200 1, Seasonal ET in Boise Valley of Idaho during 2000 from SEBAL (Kramber and Morse, 2002) Wetland Water Recreation Perennial Irrigated Crops Canal Rights of Way Urban Residential Rural Residential Farmstead New Subdivision Sewage Treatment Public Other Agriculture Dairy Cattle Feedlots Junk Yard Abandoned Agriculture Idle Agriculture Transportation Commercial and Industrial Barren Unclassified Evapotranspiration, mm
27 Aggregation of ET over fields Seasonal ET Bryce Contour, Univ. Idaho

28 Aggregation of ET for pumping entities Blue dots are wells IDWR Arcview field and ownership boundaries American Falls Reservoir T.Morse, IDWR

29 Aggregation of ET for pumping entities Seasonal ET IDWR Arcview field and ownership boundaries American Falls Reservoir T.Morse, IDWR
30 WIMS PumpageMMGROW vs. SEBAL ET, 2000 WIMS Pumpage in mm WIMS Pumpage, mm/season :1 w/ 200 mm Precip shift SEBAL ET in mm SEBAL ET, mm/season Depleted Soil Moisture? MMGROW Questionable Pumping Records T.Morse, IDWR

31 Crop Coefficients over Large Populations of Fields from SEBAL Twin Falls Kimberly Research Center Kimberly, Idaho USDA-ARS / Univ. Idaho Research Center
32 Potato 717 fields Kc Day of Year
33 Potato 717 fields Kc NDVI Potato Vegetation Index Day of Year Day of Year
34 S.Beet 516 fields Kc Day of Year
35 W.Grain 564 fields Kc Day of Year
36 Alfalfa 325 fields Kc Day of Year
37 Crop Coefficient (ETrF) Potato Fields, June NDVI
38 Crop Coefficient (ETrF) Potato Fields, June 19 June NDVI
39 Crop Coefficient (ETrF) Potato Fields, June 19 June 21 July NDVI
40 Crop Coefficient (ETrF) Potato Fields, 2000 basal K c June 19 June 21 July NDVI
41 Crop Coefficient (ETrF) Potato Fields, 2000 basal K c mean K c June 19 June 21 July NDVI
42 1.2 Corn Kc 3/1/00 3/31/00 4/30/00 5/30/00 6/29/00 7/29/00 8/28/00 9/27/00 10/27/00 SEBAL Allen&Brockway (1983) (Original alfalfa-based K c curve is also in ASCE Manual 70)
43 Corn Kc 3/1/00 3/31/00 4/30/00 5/30/00 6/29/00 7/29/00 8/28/00 9/27/00 10/27/00 SEBAL Agri Met (Original alfalfa-based K c curve is also in ASCE Manual 70)
44 1.2 Sugar Beet SEBAL Allen&Brockway (1983) Kc 3/1/00 3/31/00 4/30/00 5/30/00 6/29/00 7/29/00 8/28/00 9/27/00 10/27/00 (Original alfalfa-based K c curve is also in ASCE Manual 70)
45 Sugar Beet Kc 3/1/00 3/31/00 4/30/00 5/30/00 6/29/00 7/29/00 8/28/00 9/27/00 10/27/00 SEBAL Agri Met (Original alfalfa-based K c curve is also in ASCE Manual 70)
46 Potato Kc 3/1/00 3/31/00 4/30/00 5/30/00 6/29/00 7/29/00 8/28/00 9/27/00 10/27/00 SEBAL Agri Met (Original alfalfa-based K c curve is also in ASCE Manual 70)
47 Top of Field vs. Bottom of Field: Variations in ET Southern California Do bottoms of Irrigated Fields suffer lower ET?
 and low elevation quarter (blue)")
48 Close up showing field outlines (green) and high elevation quarter (red) and low elevation quarter (blue) for fields
49 Ratios of ET from high quarter of field to ET of low quarter for 4600 fields sampled (for 10 April, 2003 image) ET (mm/d) High Qtr Low Qtr Visible Harvest effects No Visible Harvest effects Wheat Alfalfa
50 ET maps in Hydrologic Applications

51 24-hour Evapotranspiration - July 10, 1999 Agriculture Water (Gulf of Mexico) The brighter the pixel, the greater the Evapotranspiration Forests + Wetlands Tampa Bay City Tampa Bay, Florida: Impact of Groundwater pumping by City on Natural Vegetation

52 Aggregation of ET for Hydrologic SEBAL: Tampa Bay area, Florida July, 1999 ET, inches/week units Use ArcView, etc., to aggregate the ET for an area of interest
53 Conclusions ET maps by SEBAL have good accuracy in Southern Idaho ET maps are valuable for Ground-water management, Water Rights Conflicts Crop Coefficient Development Sugar Beet 0.8 Kc SEBAL Allen&Brockway (1983) Scale 3/1/00 3/31/00 4/30/00 5/30/00 6/29/00 7/29/00 8/28/00 9/27/00 10/27/ Km

54 Twin Falls, Idaho Come Visit!!!