January 9, Bill Rose Gary Bousquet
|
|
|
- Myron Maxwell
- 5 years ago
- Views:
Transcription


1 January 9, 2014 Bill Rose Gary Bousquet

2 Status of BDCP Design Role of Water Authority Review Schedule
3 July August Board Review Process Background & Options to Review Review Update September Costs and Funding Comparison of Estimated Export Yields October Environmental Process Review Implementation Process and Portfolio Alternative Analysis November Overview: Supply and Demand Reliability Assessment
4 Description of Proposed Facilities Cost Estimates Review Process Gate Process Initial List of Concerns
5 Description of Proposed Facilities Cost Estimates Review Process Gate Process Initial List of Concerns

6
7
8

9
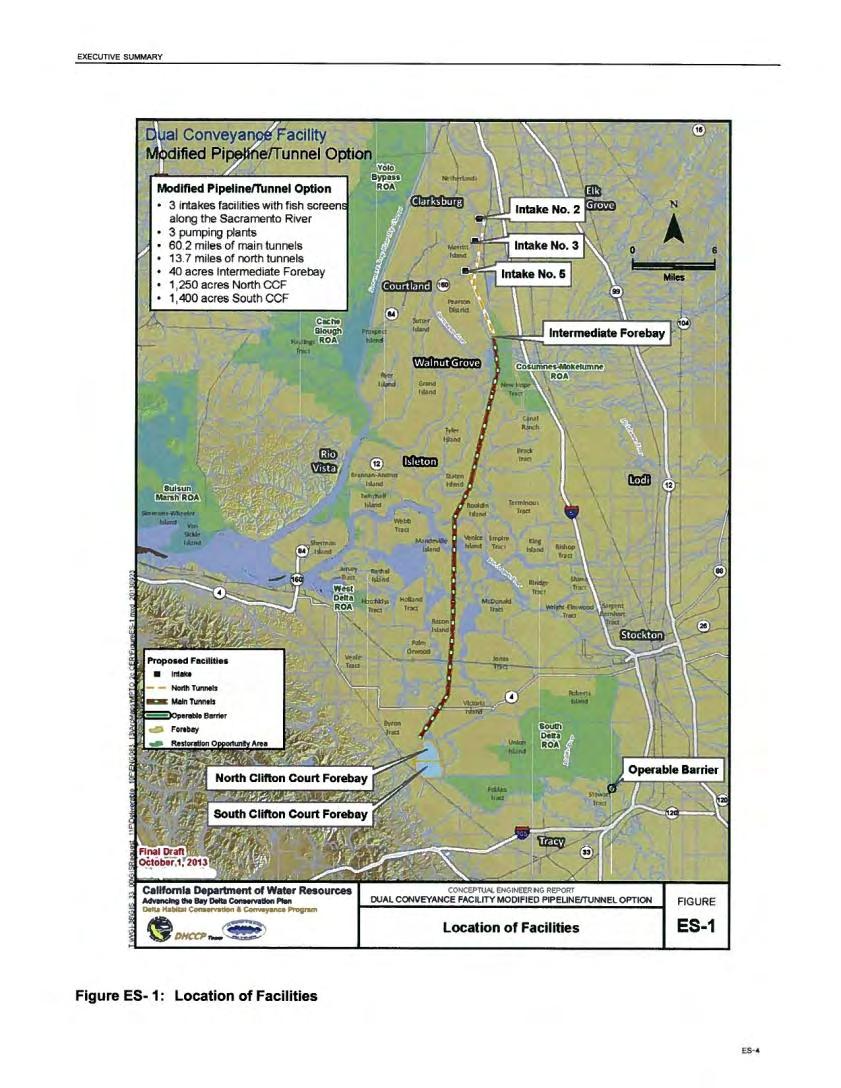
10 BDCP Preferred Alternative: 9,000 cfs pipeline/tunnel No Action Alternative NRDC Portfolio Concept Delta Vision BDCP Plus Concept
11 3-3,000 cfs intakes off Sacramento River w/ sedimentation basins and pumping plants 3 North tunnels 20/29 feet diameter, ~14 miles between pumping plants and intermediate forebay 1 40 acre intermediate forebay connected to main conveyance tunnels

12

13
14 2 40 feet diameter 30 mile long tunnels between intermediate forebay and modified Clifton Court forebay 5 tunnel launch/retrieval shafts Clifton Court forebay split into 2, north and south forebays Relocation of roads and utilities Temporary and permanent power
15 Tunnel and forebay muck disposal Approximately 15 years from preliminary engineering to start-up

16
17 Description of Proposed Facilities Cost Estimates Review Process Gate Process Initial List of Concerns
18 Tunnel Options Construction Costs Estimated Costs Dual Tunnels 3,000 cfs 6,000 cfs BDCP Proposed 9,000 cfs 15,000 cfs Construction $9.4B $11.4B $12.4B $14.5B Engineering, project/construction management $1.4B $1.7B $1.9B (~15%) $2.3B Total $10.8B $13.1B $14.3B $16.8B Notes: 1. BDCP revised cost of single bore tunnel is $8.6B per November 12, 2013 web post. 2. Costs are stated in 2012 dollars. Source: BDCP, Table 9.B-6, November 2013
19 River Intake Structures Forebays & flow control structures Tunnels and pipelines Controls and communications Utilities and power delivery Contingency ~ 36 percent * Based on May 2013 BDCP, Appendix 9.B needs updating per revised costs.
20 Project Management Engineering Design Costs Construction Administration Currently 15% included for these items
21 Description of Proposed Facilities Cost Estimates Review Process Gate Process Initial List of Concerns

22 Gate Process What is a Gate? Gate Group Composition


23 Planning Gate 1: Project Initiation (20 deliverables) Design Gate 2: Design Initiation (10 deliverables) Gate 3: Preliminary Design (6 deliverables) Gate 4: Mid-Point Design (6 deliverables) Gate 5: Final Design (12 deliverables) Construction Gate 6: Beneficial Occupancy (5 deliverables) Gate 7: Approval - Go to Board for NOC (9 deliverables) Post-Construction Gate 8: Project Closeout (15 deliverables)
24 Planning Gate 1: Project Initiation (20 deliverables) Design Gate 2: Design Initiation (10 deliverables) Gate 3: Preliminary Design (6 deliverables) Gate 4: Mid-Point Design (6 deliverables) Gate 5: Final Design (12 deliverables) Construction Gate 6: Beneficial Occupancy (5 deliverables) Gate 7: Approval - Go to Board for NOC (9 deliverables) Post-Construction Gate 8: Project Closeout (15 deliverables)
25 Gate 1 Project Initiation: Planning Study Final Report Project Delivery Plan Preliminary Project Schedule Project Budget Risk Management Plan Public Outreach Consultant Support Value Engineering Study for Pipeline Projects
26 Gate 1 Project Initiation: Planning Study Final Report Project Delivery Plan Preliminary Project Schedule Project Budget Risk Management Plan Public Outreach Consultant Support Value Engineering Study for Pipeline Projects
27 Project Delivery Plan Team members Project objectives Schedule milestones Budget Key Issues Stakeholder coordination Anticipated Board actions
28 Project delivery plan that examines and explores various options to execute the project. Examples: Design/Bid/Build Design/Build Design/Build/Operate Pre-purchase of equipment Staged construction
29 Project scope Schedule Desired level of owner involvement Tolerance for risk Resources and capabilities


30 Gate 1 - Risk Management Plan Identify Update Manage Risks During All Project Phases Analyze Monitor Mitigate Project Initiation and Design Phases
31 Gate 2 Deliverables: Life Cycle Cost Analysis Preliminary Design Report Draft Environmental Impact Report Right-of-Way Acquisition Plan
32 Gate 3 Preliminary Design: Updated Construction Cost Estimate Adopted Final Environmental Impact Report Updated Project Delivery Plan
33 Review Documents BDCP EIR/EIS Conceptual Engineering Report Geotechnical Data Report Examine through lens of Water Authority Gate Process

34 Description of Proposed Facilities Cost Estimates Review Process Gate Process Initial List of Concerns
35 Tunnel Muck Removal Electric Car, fuel driven cars, conveyors Tunnel Muck Disposal Where?, alternate uses? Ventilation Design
36 Project delivery method Construction contract requirements Bonding, owner controlled insurance, project labor agreement, local labor Ability to get Tunnel Boring Machines and operators Temporary Power project generation air quality
37 Permanent Power multiple power providers system control Unknown if enough suitable borrow material Natural gas wells existing and abandoned Infiltrated Water Removal
38 Relocation of roads and utilities Price escalation beyond estimates for 15- year project Dewatering intermediate shaft sites Geotechnical Unknown subsurface conditions Harder/softer ground
39 Historical Data Collected from other Delta area projects such as levees and highways Field Explorations borings, cone penetration tests, geophysical surveys, and laboratory testing Identifying soils types, hardness, groundwater elevations, cobbles
40
41
42
43
44 Channel Tunnel (United Kingdom/France) Alaska Way Viaduct (Seattle)
45 Review Updated Engineering Conceptual Design Report Ongoing Engineering Assessment of BDCP Costs Estimates February 2014 Comment Letter April 2014


46 Presented by: Ken Weinberg, Director of Water Resources Dana Friehauf, Principal Water Resource Specialist Special Meeting of the Imported Water Committee January 9, 2014
47 BDCP update Summary of previous SWP supply reliability analyses Risk assessment Permitting Schedule Implementation Supply Demand Summary/Observations 2


48 Public draft of BDCP and EIR/EIS released December 13, day formal review period Public meeting scheduled for February 6, 2014 in San Diego at the Convention Center, 3 pm 7pm Staff evaluating public draft and will discuss substantive changes with the Board in February Projected export yields are consistent with administrative draft documents 3
49 Objective: Provide Board with assessment of which proposal is most consistent with Board s Bay-Delta Policy Principles Reliability and diversification goals in Water Authority s 2010 UWMP Water Authority has not endorsed a preferred Delta fix solution Four options being evaluated 1. BDCP preferred alternative (9,000 cfs) 2. BDCP Plus (DVF) (6,000 cfs) 3. Portfolio Alternative (NRDC) (3,000 cfs) 4. No action (existing conveyance) 4
50 Scope of review driven by BDCP timeline and available resources High-level review based on perspective of a recipient and purchaser of Delta exports Review based on available published data with professional judgment Not intended to recreate modeling results Deliverables: 1. Comment letter through BDCP environmental review process 2. Assessment of project reliability, financing and impact on rates, including risk assessment for Board consideration 5

51 Several policies related to supply reliability, financing and other topics The guiding statement is that: The Water Authority Board of Directors supports a Bay-Delta solution that will meet the co-equal goals and provide San Diego County with a reliable, highquality supply of affordable, imported water consistent with the Water Authority s Urban Water Management Plan and Regional Facilities Optimization and Master Plan. 6
52
53 Conveyance Option Operating Scenario Conservation Measures 1: Water Facilities and Operations 8
54 South Delta 4.2 North Delta Average Annual Exports (MAF) % 41% % % 28% % Proposed Action 9,000 cfs 6,000 cfs Alt 3,000 cfs Alt Existing Conveyance Average Annual Exports Early Long-Term (2025) Source: BDCP Chapter 9, Table

55 From in-delta only perspective, 9,000cfs Delta option provides the most SWP yield on average The greater the amount of north Delta diversions the greater the improvement in SWP water quality Lower salinity and organics SWP California Aqueduct Greater reliance on south Delta diversion creates more risk Increasing restrictions to protect fish species cause uncertainty over export yields Uncertainty regarding reliability during levee failure, other catastrophic events 10

56 Addresses one of Board s Policy Principles that the Delta solution should: Improve the ability of water-users to divert water from the Delta during wet periods, when impacts on fish ecosystem are lower and water quality is higher From the perspective of best managing shortage risk Inability to model MWD system puts and takes to storage Evaluated volume and frequency of wet-year SWP deliveries for puts into storage MWD s Diamond Valley Lake 11
57 Alternative Frequency Proposed Action (9,000 cfs) 30% (3 out of 10 years) 6,000 cfs 20% (2 out of 10 years) 3,000 cfs 10% (1 out of 10 years) Existing Conveyance 1% (1 out of 100 years) Big gulp critical to replenishing storage reserves 1.5 MAF is an indicator of wet-year delivery Allows MWD and Water Authority to put supplies into storage Delta conveyance facility improves ability to provide wet-year deliveries into storage compared with existing conveyance 12
58 Adequate MWD and Water Authority dry-year supplies are key to SWP supply reliability Dry year reliability of SWP supplies needs to be seen as both yield and stored water Frequency and volume of wet-year SWP deliveries is critical to replenishing storage A north Delta conveyance facility provides best opportunity to ensure big gulp Addresses Water Authority s policy principle Larger conveyance size provides more opportunities to put SWP supplies into storage 13
59
60 Previous evaluations focused on imported water supply reliability from SWP This assessment evaluates potential for additional local projects and south of Delta storage to improve overall reliability with smaller conveyance Consistent with NRDC and DVF proposals What are the risks associated with these options compared with BDCP Proposed Action? Reliability assessment does not take into account costs or financial impacts Evaluated at future meetings 15
61 In-Delta Conveyance Habitat Restoration Levee Improvements Out-Of-Delta Local Projects South of Delta Storage Projects/Programs 16

 2010 CALFED Surface Storage Investigations, Progress")
62 NRDC and DVF proposed integrated components as comprehensive Delta solution In October 2013 Governor released draft Water Action Plan, recognizing importance of an integrated approach to address state water issues Components developed individually by state, federal, regional and local agencies Other statewide planning efforts place additional focus on integration 2009 State Water Plan Delta Reform Act (2013 Delta Plan) 2010 CALFED Surface Storage Investigations, Progress Report 17

63 Proposed to be evaluated as standalone alternative in BDCP process, including EIR/EIS Inconsistent with current BDCP Project Objectives and Plan Area Unclear if all components could be under a single environmental document and permit Need to assess how best to complete environmental processes on various components 18

64 NRDC/DVF proposals did not identify specific local projects More risk relying on other water agencies state-wide to develop additional local projects Supply projects are identified in UWMPs Assess potential of additional local project development in San Diego Region, rather than statewide, to offset risk in SWP deliveries from MWD Water Authority/member agencies develop additional projects Less risky approach, provides for local control Projects offset decrease in dry-year supplies from MWD due to less storage reserves, which resulted from smaller conveyance 19
65 Potential Additional Planned Supply Projects 1 Estimated Yield (AF) Member Agency Additional Planned Projects 68,000 Recycled Water and Brackish Groundwater 14,000 City of San Diego Indirect Potable Reuse Project 2 34,000 Otay WD Rosarito Beach Desalination Project 3 20,000 Water Authority Regional Seawater Desalination Facility (Pendleton) 56, ,000 Total Estimated Yield from Potential Projects 124, ,000 1 Projects and estimated yields based on 2010 UWMP, with updated numbers for City of San Diego and Otay Water District proposed projects 2 Derived from the City of San Diego s 2012 Long-Range Water Resources Plan. Doesn t include Phase 3, 56,000AF Harbor Drive Facility, which if built would be beyond Yield from Otay Water District s 2010 UWMP and is identified as conceptual project in plan 20
66 TAF TAF (P.R. w/ 1.8 MAF Supplies) 243 TAF (P.R. w/ 1.3 MAF Supplies MWD Carryover Storage SBX7-7 Eliminate reliance on MWD stored water MWD supply availability of 1.3 MAF in dry-year 800TAF CR 500 TAF SWP Verifiable Local Projects Enhanced Local Projects Local Supply (Additional Planned) Local Supply (Existing & Verifiable) Carlsbad Desalination Project QSA Develop approx. 100 TAF of additional new local supplies in San Diego County Reduce dry-year demand on MWD to 243 TAF under preferential rights 21
67 Permitting Risk Ability to obtain major permits to construct and operate all components necessary to provide water supply Schedule Risk Probability that proposal doesn t increase likelihood of supply shortages by as identified in Draft Master Plan Implementation Risk Complexity and difficulty of implementing supply and environmental components of proposal Supply Risk Likelihood of proposal, if implemented, achieving the desired yield of water supply Demand Risk Likelihood there is insufficient demand to take SWP yield identified in each proposal 22

68 General Approach The more uncertainty and lack of definition the more risk The more components of an alternative and the more parties depended upon to fully implement the more risk The more reliant on external parties for implementation the more risk to San Diego County supply reliability Larger the project, the greater the implementation risk Assessing only generalized risk, not whether the cost is worth the reduced risk Integrate cost into future analysis 23
69 NRDC/DVF modified portfolio approach contains two components In-Delta (conveyance and habitat protection) Out-of-Delta (south of Delta storage and San Diego region local projects) Modified option assumes focus on San Diego projects instead of statewide No specific storage projects identified in NRDC or DVF proposals Difficult to analyze permitting, schedule and implementation risks Included in supply risk assessment Existing conveyance option not evaluated in this supply reliability risk assessment As demonstrated in previous analysis, doesn t meet Board s supply reliability policy principles 24

70 In-Delta (Conveyance and Habitat Restoration) BDCP Proposed Action less risky because permitting agencies involved in developing conservation measures NRDC option more risky due to lower proposed habitat restoration acreage 40,000 acres compared with 153,000 acres in BDCP Less direct mitigation Unclear proposal will satisfy permitting requirements without wildlife agencies accepting completely revised approach DVF option did not provide specific acreage amount 25
71 Opposition and potential litigation poses greatest schedule risk Opposition from in-delta users and other stakeholders for 9,000 cfs alternative Likely opposition from exporters to 3,000 cfs option Uncertainty regarding financing and payment commitments is greatest implementation risk Risk exists for all options Cannot obtain permits without demonstrating financing Reduced scheduling risk with smaller single tunnel 3,000 cfs facility due to less construction time than two-tunnel options 26

72 Actual Recycled Water Use Compared with Water Authority UWMP Targets 60,000 50,000 40,000 30,000 20, UWMP Projections 2005 UWMP Projections (verifiable) 2010 UWMP Projections (verifiable) Actual Recycled Water Use FY Local projects have not always developed as planned Portfolio proposal requires additional planned projects beyond 2010 UWMP verifiable projects Risks associated with implementation Political, financial, institutional, regulatory Risks lower if proposed project developed locally Local control 27

73 In-Delta (SWP Reliability) In-Delta facilities perspective, 9,000 cfs Delta option provides: Most SWP average yield Better export water quality Better operational redundancy SWP Banks Pumping Plant Greatest reliability if Delta levees fail Greater ability to take big gulp in wet years to replenish storage to meet dry-year demands Supply risk associated with reliance on Decision- Tree Process to select initial operating criteria Initial average estimated to be between 4.7 and 5.6 MAF Future yield dependent on success of restoration efforts 28

74 Out-of-Delta (San Diego Region Local Projects) Increase San Diego Region supply reliability Further reduce dependence on MWD dry-year deliveries beyond 2010 UWMP Build upon current successes in local supply implementation Achieved through development of additional planned projects identified in 2010 UWMP Examples include potential Camp Pendleton desalination and City of San Diego Indirect Potable Reuse Estimated total yield from additional planned projects 124, ,000AF Uncertainties associated with project development Most projects still in initial planning stages City of San Diego Water Purification Demonstration Project 29
75 Delta Flows 30

76 Delta Flows and Conveyance Capacity Limit South of Delta Storage
77 Out-of-Delta (South of Delta Storage) Increase San Diego Region supply reliability Potentially increasing amount of SWP deliveries for all alternatives Contribute to dry year reliability BDCP EIR/EIS Appendix 1B included initial analysis on potential increase in total exports with 1 MAF new storage Average of 150,000 AF 9,000 cfs conveyance for fed/state contractors Approx. average of 50,000 AF increase in total yield with 3,000 cfs Increase occurs in wet-years Modest Improvement to average SWP yield High Delta outflow criteria and limited wet-year take capacity limit ability to store water South of Delta Storage cannot make-up difference in average yields Potentially more value with low outflow criteria 32
78 Current Average Deliveries Compared with Estimated Export Yields (2025) 5 4 Current Average CVP/SWP Project Deliveries Growing water demands statewide SWP serves as core source of supply MAF BDCP DVF 9,000 cfs 6,000 cfs High Outflow Operating Scenario NRDC 3,000 cfs BDCP not providing significant new supply, improving reliability of current deliveries Increased local projects and use efficiency satisfy growing demands 33
79 MWD RUWMP SWP Target Compared with Estimated Deliveries under BDCP Proposed Action (2035) MAF MWD RUWMP SWP Target 400,000AF Difference Projected SWP from BDCP Proposed Action Source: BDCP EIR/EIS appendix 30B, Water Contractor Profiles Projected BDCP SWP deliveries 400,000 AF less than MWD 2010 RUWMP SWP Target 2010 RUWMP identified more total supplies (incl. local) than projected demand MWD excluding some verifiable member agency projects (e.g., Carlsbad Desalination Project) MWD SWP target could decrease in 2015 RUWMP Overall drop in demands Increase in projected local supply development Greater drop in MWD demand = higher risk of price increases NRDC smaller conveyance would be 34 less risky
80 Risk assessment conducted from solely water resources perspective Focus on water supply reliability for California and San Diego region Separate analysis will be conducted evaluating costs and financing risks Involvement of Regulatory agencies in BDCP improves likelihood of obtaining ESA permitting of Proposed Action Must complete process and demonstrate funding NRDC approach to restoration significantly different that reflected in BDCP documents Unclear whether it can meet biological objectives of permitting agencies and obtain species coverage under current NCCP/HCP process 35
81 Risk of reduced yield if species recovery goals not met during operation BDCP proposing strategies to minimize risk to SWP yield Some actions could impose cost on MWD to maintain yields Under high outflow criteria and limited conveyance capacity, new south of delta storage provides limited benefit to increasing SWP yield Cannot make up for entire reduced yield from smaller conveyance capacity Filling MWD storage and Water Authority storage more important to imported water reliability New south of delta storage may have more yield benefits under relaxed regulatory standards Successful restoration and species recovery 36
82 Risk of SWP supply reliability best managed through local supply development in San Diego County Water Authority and member agencies have proven track record in developing local supplies Relying on State or other water agencies to develop local supplies more risky Local control allows risk to be managed more effectively Still has significant unknowns and risk Key question is costs and improvement in reliability 37
83 Meeting Imported Water Committee/Board Activity 7/25/2013 Provide input on scope of proposed Water Authority analysis of BDCP alternatives; provide input on policy questions to be addressed 8/8/2013 Special Meeting Overview of Bay-Delta and proposals for Delta fix, including description of alternatives 8/22/2013 Review of technical analysis demand assumptions; alternative project yield assumptions; projected costs 9/12/2013 Special Meeting BDCP economic study on cost-benefit of BDCP preferred alternative 9/26/2013 Review of technical analysis (cont.), including yield review 10/24/2013 Information: Review of technical analysis (cont.), including baselines; BDCP timeline and processes impacting implementation 11/14/2013 Special Meeting Supply and demand evaluation and analysis
84 Meeting 1/9/2014 Special Meeting Imported Water Committee/Board Activity Identification of BDCP Physical features and facilities; supply/demand risk assessment 1/23/2014 Preliminary cost estimates and risk assessment to Water Authority 2/13/2014 Special Meeting Engineering assessment of BDCP cost estimates 2/27/2014 Identification of issues to be addressed in the EIR/EIS comment letter; economic sensitivity analysis 3/13/2014 Special Meeting Summary presentation of BDCP issues. Review of draft EIR/EIS comment letter 3/27/2014 Action: Consider action on final EIR/EIS comment letter 4/24/2014 Revise BDCP schedule; discuss outstanding policy issues; timeline for future board meetings