Climate Change Vulnerability Assessment for Madhya Pradesh Executive Summary May 2017
|
|
|
- Ezra Henderson
- 5 years ago
- Views:
Transcription


1 Climate Change Vulnerability Assessment for Madhya Pradesh Executive Summary May 2017 Empowered lives. Resilient nations.
2
3 Document Control Prof. A.K. Gosain Dr. Sandhya Rao Ms. Shradha Ganeriwala Ms. Puja Singh Ms. Anamika Arora Mr. Ankush Mahajan Disclaimer The data and information used for preparing this report have been sourced from secondary sources including state government departments, published sources of Government of India, and climate change assessment made by the consultants. While due care has been taken to ensure authenticity of the data and other information used, any inadvertent wrong data or information used is regretted. We are not liable to any legal or penal responsibilities arising from this and also from the use of this report by anyone.
4
5 Anupam Rajan, Principal Secretary IAS Government of Madhya Pradesh Department of Environment Mantralaya, Vallabh Bhawan, Bhopal (MP.) Tel. : (0755) Preface The study to assess the climate change risks and vulnerabilities of Madhya Pradesh was taken up under the collaborative project of the Ministry of Environment, Forest & Climate Change, Swiss Agency for Development & Cooperation, United Nations Development Programme (UNDP) and Government of Madhya Pradesh on Strengthening State Strategies for Climate Actions, understanding that Adaptation is the State s key concern with respect to Climate Change. Realizing that Vulnerability Assessment (VA) would support in formulating robust adaptation strategies for climate actions and in integrating climate change concerns in sub-national planning processes, the State Government agreed to undertake this study. This study incorporates recent advancements in climate science and the latest emission scenarios adopted by the Intergovernmental Panel on Climate Change (IPCC) in its 5th Assessment report. Two key challenges before embarking on such a comprehensive State Level assessment was ensuring participation from stakeholders and collecting requisite data from different sectors for different timelines. Uncertainties and constraints of modelling, availability of data across sectors and different timelines, projections for different time scales etc. added to the complexities. Nevertheless, I believe, a genuine effort has been made to overcome these aspects and meaningful inferences have been drawn from the Vulnerability Assessment study. Translating this academic activity into informed practices and establishing this as connect between science, policy and actions would be the task ahead for us. I am aware that there are ample scopes for further improvement and refinement of this report as the knowledge is ever evolving. Despite all the barriers and limitations, I am sure that this report will serve the purpose of looking at the Climate Change related developmental issues in a congruent manner. I thank MoEFCC, SDC, EPCO and UNDP for taking up this study for Madhya Pradesh. Anupam Rajan
6
7 P.Narahari Executive Director Environment Planning & Coordination Organisation (An Autonomous organisation, under Govt. of M.P.) Paryavaran Parisar, E-5 Sector, Arera Colony, Message The impacts of climate change are increasingly being felt around the world. In the context of Madhya Pradesh, it may become a major environmental threat to the State s development progress in the coming decades as it could have adverse impacts on food security, natural resources, human health and economic activities. With most of the population dependent on the climate sensitive sectors such as agriculture and forestry for livelihood, any adverse climatic impacts on these sectors will undermine the development efforts of the State. Hence, it becomes imperative to first develop a better scientific understanding of the climate change risks, vulnerability & associated impacts. In this context, I hope that the current vulnerability assessment study is an important milestone towards enhancing the understanding of climate change and its impacts on the key sectors which would assist the policymakers and other stakeholders in developing a range of adaptation options in the future. I appreciate SKMCCC and UNDP for taking this initiative in developing this vulnerability assessment report. P.Narahari
8
9 Acknowledgement The Climate Change Vulnerability Assessment Report for Madhya Pradesh represents a collaborative effort, made possible by the input and feedback received from experts in the field of climate change and from National and State Level Government partners working on issues to combat climate change. This report has undertaken climate change vulnerability assessment of select sectors of Water, Forest, Agriculture & Health for the state of Madhya Pradesh. The main purpose of vulnerability assessment is to identify and prioritize the regions and sectors which are likely to be adversely impacted by climate change so as to enable development of adaptation practices and strategies to help mainstream the climate change in to the broader developmental programs and projects. The report has been prepared under the project Strengthening State Strategies for Climate Actions being implemented by UNDP in partnership with MoEFCC and supported by Swiss Agency for Development and Cooperation (SDC). UNDP extends special thanks to Mr. Ravi Shankar Prasad (IAS), Joint Secretary, MoEFCC, Mr. Anupam Rajan (IAS), Principal Secretary, Environment Department, Govt. of Madhya Pradesh, for their insights and guidance. UNDP take this opportunity to also thank Mr. P. Narahari (IAS), Executive Director, Environmental Planning and Coordination Organisation (EPCO), Govt. of Madhya Pradesh, for his guidance and support in finalising the report. This report could not have completed in this form without the support of Mr. Lokendra Thakkar, Coordinator, SKMCCC, EPCO, Government of Madhya Pradesh. Special thanks to the staff of Madhya Pradesh State Knowledge Management Centre on Climate Change (SKMCCC) Saransh Bajpai, Pratik Barapatre, Ramratan Simaiya, Ravi Shah and Raashee Abhilashi for their inputs and support in finalizing the report. UNDP acknowledges the key role played by UNDP State and National teams for leading the process and hosting a number of workshops and meetings which facilitated collaboration and partnerships. UNDP acknowledges the work of the key authors of the report Professor A.K.Gosain, IIT Delhi and Dr. Sandhya Rao, Integrated Natural Resource Management Consultants (INRM) and her team in carrying out the vulnerability assessment study and report writing.
10
11 Climate Change Vulnerability Assessment for Madhya Pradesh About the Project Climate change vulnerability assessment of select sectors of water, forest and agriculture has been taken up for the state of Madhya Pradesh. The main purpose of vulnerability assessment is to identify and prioritize the regions and sectors which are likely to be adversely impacted by climate change so as to enable development of adaptation practices and strategies to help mainstream climate change in to the broader developmental programs and projects. Madhya Pradesh- Brief Profile o Madhya Pradesh lies between latitudes 21 o o o 04 N and N, longitudes E and E. It covers an area of 3,08,245 sq. km. and is the second largest state by area in India. The state is bordered on the west by Gujarat, on the northwest by Rajasthan, on the northeast by Uttar Pradesh, on the east by Chhattisgarh, and on the south by Maharashtra. Climate: Madhya Pradesh has a subtropical climate. It has a hot dry summer (April June), followed by monsoon (July September) and a cool and relatively dry winter. The average rainfall is about 1,371 mm and has large spatial variability. Rainfall decreases from east to west and south-eastern districts experience the heaviest rainfall. Water Resources: Ten of the major rivers in India originate from Madhya Pradesh. However, the State can be divided into six major river basins namely, the Ganga, Narmada, Godavari, Tapi, Mahi and Mahanadi basins. Chambal, Sindh, Betwa, Ken rivers join Yamuna and river Sone joins river Ganga directly. Narmada is the longest river in Madhya Pradesh and it flows westward. Forest: Madhya Pradesh (MP) has the largest forest area in India, it is one of the forest rich states in India with more than 27% of its geographic area falling under the forests and tree cover. Forests of MP are a rich repository of the diversity in flora and fauna. Forests of Madhya Pradesh can generally be categorized as Southern Dry Mixed Deciduous Forest (33%), Dry Teak forest (27%), Northern Dry Mixed Deciduous Forest (12%), Moist Peninsular Sal Forest (5%), and Dry Peninsular Sal Forest (5%). It is estimated that the forests in MP stored a 1 total of. 682 million tonnes of carbon in the year 2004 (about 10% of India total forest carbon). Agriculture: There are 11 Agro-climatic zones in Madhya Pradesh reflecting the climatic diversity due to the large size of the state. Major land use in Madhya Pradesh is agriculture (52%), Forest (25%) and wasteland (about 10%). Agriculture is the mainstay of economy of Madhya Pradesh. About 74% population is rural, which directly or indirectly depends on agriculture. Agriculture and allied services contribute about 31% share in state economy and 71% of its working force is directly engaged in agriculture. About 72% of cultivated area is subject to rain-fed agriculture. Wheat is the main crop of Rabi season. The other main crops are pea, oilseeds, and gram. Madhya Pradesh is the highest producer of oilseeds and pulses in the country. The most vulnerable group in the society is the rural poor as they often depend on natural resources for livelihoods such as agriculture and forestry. The impacts of climate change have been projected to manifest as increase in water stress, decline in yields from rain-fed 1 Forest Survey of India, Ministry of Environment, Forests & Climate Change. (2011). Carbon Stock in India's Forests. Dehradun. 1
12 grain crops, and increase in number of extreme weather events such as droughts and floods. Evidence based scientific assessment of climate change impacts and vulnerability combined with best practices and local knowledge from different sectors can lead to customized interventions to cope with the specific risks in different regions. Methodology Overview The study involves a series of systematic steps taken as follows. Climate Data Analysis To start with, analysis of past historical meteorological data from obtained from India Meteorological Department has been done so as to understand its characteristics in time and space over the State of Madhya Pradesh. This has been followed with a similar analysis performed for the projected climate data for the future. This projected meteorological data for the future is the outcome of using the Regional Climate M o d e l s ( R C M s ), w h i c h s i m u l ate t h e atmosphere after formulating various plausible scenarios of GHG emissions. Latest IPCC AR5 RCP scenarios, namely, RCP4.5 (corresponding to moderate global emission s c e n a r i o ) a n d R C P 8. 5 ( a s c e n a r i o corresponding to comparatively high global greenhouse gas emissions) have been used. There have been a large number of RCM models that have generated RCP4.5 and RCP8.5 climate scenarios for the future. Some of these models perform reasonably well to simulate the baseline, whereas, some other may not be performing well for the same region. In the present case, ensemble mean with three regional climate models (RCMs) from CORDEX South Asia (with total of 10 experiments) having grid resolution of 50 kmx50 km has been used. Ensemble mean reduces model related uncertainties, and in the present case, is found to be closer to observed climate than any individual model. The future is represented by two time slices, namely, mid-century (MC) represented by period from and end-century (EC) representing period from A RCM also simulates weather conditions of the past period, those have already been captured through observations. This period is called control or baseline (BL) period and in the present case, it has been taken as The predicted weather data for the BL period is a good indicator of the validity of the RCM. If the data predicted for the meteorological variables for the BL matches closely with the actual observed one for the same period then it can be assumed that the predictions made by the model for the future should also be reliable. If the difference between the control (BL) and the observed data is more, then, predictions of the baseline are corrected for the bias and the similar bias correction is also applied to the future predictions of MC and EC. Impact Assessment The next step after validating the predicted data and analyzing the same for spatial and temporal variability over the state of Madhya Pradesh was to perform impact assessment using these meteorological variables for selected sectors, namely, water resources, forest, agriculture and health to identify the vulnerability of climate change to these sectors as well as their regional (districts) variability. Climate change impact assessment has been carried out using distributed biophysical models which are best suited for each of the sectors under consideration. An assessment of the impact of projected climate change on water resources has been simulated using the hydrological model SWAT(Soil and Water Assessment 2
13 Tool). The model is capable of quantifying the impacts of climate change on various components of water balance such as stream flow, actual evapotranspiration (crop water demand), ground water recharge, soil moisture, etc., which, in turn, have been used to evaluate the severity of floods and droughts with their spatial and temporal character over Madhya Pradesh. The impact of projected climate change on forest ecosystems has been assessed based on the changes in area under different forest types and shifts in boundary of forest types. This assessment is based on: (i) spatial distribution of current climatic variables, (ii) future climate projected by climate change scenarios, and (iii) vegetation types as simulated by the Lund- Potsdam-Jena (LPJ) dynamic vegetation model (DGVM). An assessment of the impact of projected climate change on agriculture has been made using InfoCrop crop model for the major crops (rice, wheat, soybean and gram) of Madhya Pradesh. Impact on crop yield and crop water demand on account of climate change has been evaluated. An assessment of the impact due to projected heat stress on human health, livestock (cattle/milk yield), etc., has been derived through universally well established equations using temperature and relative humidity. Vulnerability Analysis Impact assessment is accomplished by generation of collective vulnerability in various districts of Madhya Pradesh for identified sectors namely, water resources, forest, agriculture and health by compiling Composite Vulnerability Index (CVI) using the indicators derived from the projected climate and simulated impact assessment. District vulnerability profile for Madhya Pradesh has been derived and presented for current vulnerability as well as for projected future vulnerability due to climate change under two climate scenarios for mid-century and endcentury. Finally these districts are categorized into very low, low, moderate, high, very high and extremely high vulnerable categories for appropriate formulation and implementation of adaptation options in different areas of the state. KEY INFERENCES The key inferences that can be derived from various segments of the study are: Climate Analysis Analysis has been made using the historical IMD gridded daily temperature (maximum and minimum) and rainfall data from (63 years) for the districts of Madhya Pradesh. Mean annual maximum temperature for Madhya Pradesh is 32.3 C with a range varying from 31.0 C 33.5 C. Mean annual minimum temperature is 18.7 C with a range varying from 17.7 C 19.8 C. Average annual rainfall of Madhya Pradesh State is mm with a range varying from mm mm. The south west monsoon (JJAS months) rainfall contributes the maximum to annual rainfall amounting to approximately 91% for Madhya Pradesh State. The analysis on temperature shows that there have been positive trends for both, annual maximum and annual minimum temperature for the state of Madhya Pradesh that is statistically not significant (low confidence). Similar analysis on annual rainfall shows negative trend for the period , both for annual rainfall and rainy days. The negative trend for annual rainfall is statistically not significant while the negative trend for rainy days is statistically significant. This implies that 3
14 the amount of rainfall received has been slightly decreasing over Madhya Pradesh whereas this rainfall has been received in fewer days over the period. Both of these trends have huge implications in terms of more severe floods, failure of rain-fed crops, lesser groundwater recharge, enhanced soil erosion, etc. Similar analyses have been performed on the projected daily temperature and rainfall under climate change scenarios. Following are the major inferences of the analyses using ensemble mean of 3 RCMs. Mean annual maximum temperature for IPCC AR5 RCP4.5 scenario is projected to 0 increase by about 1.3 C by mid-century 0 and by 2.0 C by end-century while for IPCC AR5 RCP 8.5 scenario it is projected to 0 increase by about 1.6 C by mid-century 0 and 4.3 C by end-century for the State of Madhya Pradesh. Mean annual minimum temperature for IPCC AR5 RCP4.5 scenario is projected to 0 increase by about 1.4 C by mid-century 0 and by 2.6 C by end-century while for IPCC AR5 RCP 8.5 scenario it is projected to 0 increase by about 1.8 C by mid-century 0 and 5.3 C by end-century. Mean annual rainfall for IPCC AR5 RCP4.5 scenario is projected to decrease marginally by about 0.1% towards midcentury and increase by about 4.4% towards end-century while for IPCC AR5 RCP8.5 scenario it is projected to increase marginally by about 0.2% towards midcentury and increase 5.8% towards endcentury for the State. Thus, projected change in rainfall is marginal for both the climate scenarios. General implications of temperature increase can include heat stress related health impacts, increase in energy demand for cooling, additional evaporation and evapotranspiration losses resulting in enhanced irrigation water requirement for crops. Increase in intensity of rainfall events may lead to floods, urban storms, vector borne diseases, loss of work, transport disruption, additional cost for flood proofing factories and warehouses. (Reference: Technical Report on Current Climate and Future Climate Change Projections). Climate Change Impact Assessment Climate change impact assessment on different sectors has been carried out through biophysical models using climate data of the present (BL) and future (MC and EC). Following is the brief description of the impact assessment for Madhya Pradesh for water and health sectors. Water Resources The SWAT hydrological model for various rivers and its tributaries in Madhya Pradesh has been run using climate scenarios for mid- and endcentury periods ( , , respectively) without changing the land use. Under the moderate emission scenario (RCP4.5) for south west monsoon season (JJAS), increase in precipitation of 1% and 5% is projected in mid-century and end-century respectively. Marginal to 11% increase in precipitation and marginal to 8% decrease in precipitation are projected towards midcentury for different districts. Marginal to 21% increase in precipitation and marginal to 8% decrease in precipitation are projected towards end-century for different districts. For north east monsoon season (OND) decrease in precipitation by 17% is projected in midcentury and increase in end-century by 15% respectively. Under the moderate emission scenario (RCP4.5), projected drought condition is likely 4
15 to increase or decrease for different districts. Possibility of increase in drought conditions in some parts of Madhya Pradesh (parts of Morena, Sheopur, Tikamgarh, Shivpuri, Gwalior and Datia districts) towards midcentury and end-century is likely. Districts of West Nimar, Indore, Dewas and Dhar are projected to improve in drought conditions towards mid-century and end-century as compared to baseline. Under the high emission scenario (RCP8.5), for south west monsoon season (JJAS), increase in precipitation of 1% and 5% is projected in midcentury and end-century respectively. Marginal to 11% increase in precipitation and marginal to 8% decrease in precipitation are projected towards mid-century for different districts. Marginal to 21% increase in precipitation and marginal to 8% decrease in precipitation are projected towards endcentury for different districts. For north east m o n s o o n s e a s o n (O N D) i n c re a s e i n precipitation in end-century by 26% is projected. Under the high emission scenario (RCP8.5), drought condition in parts of Madhya Pradesh is likely towards mid-century and end-century. In districts of Burhanpur, Sidhi, Singrauli, Rewa, Satna and Ratlam, drought situation escalates towards mid-century and improves toward end-century. The magnitude of peak discharge is projected to increase towards end-century scenario as compared to the mid-century scenario. Projected peak discharge is higher under high emission scenario. Flood discharge is likely to increase in district of Indore under both the scenarios towards mid- and end-century. Stream flow at 75% and 90% dependability towards end-century is projected to increase as compared to mid-century. Under high emission scenario, significant increase in dependable flow under 75% and 90% dependability is projected as compared to marginal increase under moderate emission scenario. Projected decrease in dependable flows for districts of Singrauli and Gwalior is likely for all scenarios, while district of Burhanpur is likely to have increase in dependable flows. Likely reduction in the projected flow to some of the reservoirs like Ban Sagar, Gandhi Sagar, Harsi, Lachura, Pagara, Tons, Daudhan of Ganga basin has been envisaged. Large reservoirs like Gandhi Sagar, Indira Sagar, Omkareshwar, Rani Avanti Bai Sagar Bargi, Tawa may not have much reduction at the 75% dependable flow level for IPCC AR5 RCP4.5, however, marginal reduction in flow dependability at 90% is projected towards mid-century in some locations. Forest The outcome of the vegetation simulation suggests that ongoing climate change as well as the projected climate change presents both an opportunity and a threat to the forests of Madhya Pradesh. The opportunity comes by the way of increased net primary productivity in different parts of the state. Dry Teak Forests are the most vulnerable to impact of climate change followed by southern dry mixed deciduous forest and northern dry mixed deciduous forest in both the scenarios. Model-based projections of climate change and its simulated impacts on vegetation distribution in the forests of Madhya Pradesh indicates that vegetation or forest type will undergo changes under projected climate change. The forests in the district of Bhopal are projected to be least vulnerable; forests in districts of Bhind, Datia and Gwalior are 5
16 extremely vulnerable to climate change impacts under RCP4.5 towards mid-century. Similarly, the forests in district of Umaria are least vulnerable to climate change under RCP8.5 towards mid-century, but eight districts are projected to be impacted by climate change. The forests in the district of Dindori are projected to be least vulnerable to climate change under both RCP4.5, and 8.5 towards end-century, forests in 17 districts will be impacted by climate change under RCP4.5 towards end-century and 22 districts out of 50 are likely to be impacted by climate change under RCP8.5 towards end-century. Under low emission scenario (RCP4.5) about 18% of the total forested grids are least vulnerable, followed by 37% with medium vulnerability, 21% with high vulnerability, 2% grids with very high vulnerability and 22% of the forested grids under extremely high vulnerability towards mid-century. Under high emission scenario (RCP8.5) about 17% of the total forested grids are least vulnerable, followed by 36% with medium vulnerability, 19% with high vulnerability, 2% grids with very high vulnerability and 27% of the forested grids under extremely high vulnerability towards mid-century. Under low emission scenario (RCP4.5) about 15% of the total forested grids are least vulnerable, followed by 33% with medium vulnerability, 16% with high vulnerability, 1% grids with very high vulnerability and 36% of the forested grids under extremely high vulnerability towards end-century. Under high emission scenario (RCP8.5) about 13% of the total forested grids are least vulnerable, followed by 27% with medium vulnerability, 14% with high vulnerability, 1% grids with very high vulnerability and 46% of the forested grids under extremely high vulnerability towards end-century. The simulations further suggest an increase in NPP towards mid-century. Increased NPP and increased biomass has the potential to increase the supply of both timber and nontimber forest products (NTFPs) as well as it can further enrich the soil carbon and productivity by additional litter-fall. The heat stress conditions are likely to exacerbate, particularly, in the months of May, June, July, August and September for the districts of Madhya Pradesh under both emission scenarios. Thus, extreme caution is needed to avoid sunstroke, heat cramps and heat exhaustion which are possible with prolonged exposure and/or physical activity. None of the districts are projected to be in the danger stress level of THI (Temperature Humidity Index) where the potential livestock mortality can occur for any of the months. The impact on animals is projected to increase in the months of July, August and September towards mid-century and end-century. Agriculture Projected changes in temperature and rainfall are likely to affect the crop productivity and crop water demand (evapotranspiration). Decline in production of wheat and to some extent, chickpea is likely under both scenarios. Significant increase in rice yield is projected for all the rice growing districts. Wheat yield is projected to decline by 10% to 25% in the state for various climate scenarios at different periods. Chickpea yield is projected to decrease marginally towards mid-century and gain towards end century, the increase is likely in the range of 3% to 15%. Soybean yield is projected to increase by 12% to 65% in the state for various climate scenarios at different periods. Under RCP8.5, higher increase in crop yield is projected than under RCP4.5 scenario. Seasonal agriculture stress, especially, during 6
17 Rabi cropping season is projected, which would call for additional irrigation water supply during critical growth period of the crops. Health Heat stress on human: The heat stress conditions are likely to exacerbate, particularly in the months from April to September for the districts of Madhya Pradesh under both emission scenarios. Thus, extreme caution is needed to avoid sunstroke, heat cramps and heat exhaustion which are possible with prolonged exposure and/or physical activity. Under RCP8.5 scenario the heat stress conditions are likely to exacerbate, including, in the months of March and October. Central part of Madhya Pradesh is likely to experience higher heat stress reaching danger level towards mid-century, for duration ranging from 7-14 days. Under RCP4.5 scenario, towards mid-century, months of June, July and August all the districts are projected to have days under extreme caution zone except parts of Dindori, Anuppur, Shahdol, Betul, Chhindwara, Indore, Ujjain and Shajapur. Situation is likely to worsen towards end-century. Under RCP8.5 scenario, month of May is likely to have extreme heat stress conditions in the north eastern part of Madhya Pradesh. Heat stress on livestock: Months from April to September are significant on account of either high temperature or high humidity. The situation is likely to deteriorate towards midcentury and end-century under RCP8.5 scenario with number of days having severe animal stress level being projected to increase during the months of April, May and June. Projected increase in number of days under moderate and severe is likely in the months of May, June, July and August. Impact on the dairy animals is projected to be the highest in the districts of Sidhi and Shahdol. During the months of May, June, July, August and September, the number of days under moderate Temperature Humidity Index (THI)are higher for Bhind and Datia. Severe THI stress level mainly observed in the month of June and is projected to be higher for Bhind and Datia. The projected impact in mid-century is also harmful for the animals for some days of the months, but, not as much as in end-century as temperatures during end-century are expected to worsen. (Reference: Technical Report on climate change impacts on select sectors) Current and Projected Vulnerability Profile for the Districts of Madhya Pradesh District is the most used administrative unit for various actions at the state level. This can also be a useful unit for implementation of the adaptation options for coping with the implications of climate change. Therefore, vulnerability on account of climate change in Madhya Pradesh has been assessed at the district level. The vulnerability analysis has been based on Composite Vulnerability Index (CVI) performed using multivariate analysis for current and projected climate (under RCP4.5 and RCP8.5 climate scenario under mid- and end-century). The IPCC working definition of vulnerability as a function of exposure, sensitivity, and adaptive capacity has been used. In all 72 indicators have been identified from various sectors and have been categorized with respect to adaptive capacity, sensitivity and exposure. Accordingly, five sec toral vulnerability indices for social, economic, water resources, forest and agriculture have been generated. The indices would facilitate the identification of districts, which are vulnerable to climate change and need special attention towards adaptation. 7
 Agriculture Vulnerability (15 indicators) Indicator 1 Indicator 1 Indicator 1 Indicator 1 Indicator 1 Indicator 1 : : : : : : : : : : : : Indicator n Indicator n")
18 Composite Vulnerability Index 72 Indicators Social Vulnerability (31 indicators) Economic Vulnerability (5 indicators) Climate Vulnerability (8 indicators) Water Vulnerability (8 indicators) Forest Vulnerability (5 indicators) Agriculture Vulnerability (15 indicators) Indicator 1 Indicator 1 Indicator 1 Indicator 1 Indicator 1 Indicator 1 : : : : : : : : : : : : Indicator n Indicator n Indicator n Indicator n Indicator n Indicator n Schematic of Composite Vulnerability Index Current Composite Vulnerability Analysis The Composite Vulnerability Index (CVI) across the 50 districts of Madhya Pradesh has been constructed using 72 indicators taken from social, economic, water resources, forest and health sectors along with some extreme climate indicators. With respect to the present climate, eight districts namely, Singrauli, Jhabua, Barwani, Panna, Morena, Sidhi, Rewa and Alirajpur fall in Very High vulnerability category followed by 17 districts namely, Dindori, Ashoknagar, Shivpuri, Umaria, Sheopur, Chhatarpur, Tikamgarh, Khargone (West Nimar), Bhind, Damoh, Guna, Satna, Dhar, Katni, Sagar, Mandla and Rajgarh. Under high vulnerability 11 districts namely, Current Composite Vulnerability for Madhya Pradesh Districts 8

19 Shahdol, Burhanpur, Ratlam, Khandwa (East Nimar), Shajapur, Balaghat, Betul, Seoni, Vidisha, Mandsaur and Datia fall under moderate vulnerability and 11 eleven districts namely, Hoshangabad, Harda, Narsinghpur, Gwalior, Dewas, Neemuch, Ujjain, Sehore, Chhindwara, Anuppur and Raisen under low vulnerability. Bhopal, Jabalpur and Indore districts fall under Very Low vulnerability by identifying the sector which makes that district vulnerable. Usually it has been observed that low vulnerability of a district is mainly due to higher adaptive capacity and lower climate sensitivity to water, forest, agriculture and health sectors. Districts of Singrauli, Jhabua, Barwani, Panna, Morena, Sidhi, Rewa and Alirajpur which fall Disaggregated Sectoral Vulnerability contributing to Current Composite Vulnerability for Madhya Pradesh Districts category. Many sectors together contribute to decide the vulnerability status of a district. Each sector used in CVI has been further disaggregated to help understand the main factors that are responsible to make each of the districts vulnerable. The disaggregated indices can help the decision makers to prioritize the development activities in any chosen district under very high vulnerability category have attained this status due to very high social, economic, health (heat stress) and water resource sector vulnerability. An illustration of importance of individual vulnerability indicators contributing to Composite Vulnerability Index has been given at the end. 9
 and RCP8.5 (high emission scenario) scenarios.")
20 Projected Vulnerability Analysis Projected future vulnerability profiles for districts of Madhya Pradesh towards midcentury ( ) and end-century ( ) are developed for projected climatic conditions using RCP4.5 (moderate emission scenario) and RCP8.5 (high emission scenario) scenarios. The overall Composite Vulnerability of the Madhya Pradesh districts is projected to increase towards the mid-century while decrease towards the end-century as compared to the baseline for both the IPCC AR5 climate scenarios. District vulnerability is likely to exacerbate under RCP8.5 scenario as compared to RCP4.5 scenario. Furthermore, projected increase in vulnerability towards end-century is likely to be higher than that of mid-century. Exposure to rainfall variability, drought weeks and sensitivity to heat stress and seasonal crop water stress are projected to increase towards the mid-century as compared to current conditions thus contributing to increase in overall Composite Vulnerability (CV). Overall forest and health (heat stress) vulnerability of the districts is projected to increase towards mid-century and end-century as compared to the baseline for both emission scenarios of RCP4.5 and RCP8.5. Dry Teak Forests are the most vulnerable to impact of climate change. Overall water resources and agriculture vulnerability of the districts is projected to decrease towards mid-century and endcentury as compared to the current conditions for both emission scenarios. Projected increase towards mid-century is attributed to likely increase in exposure to droughts and higher seasonal crop water stress. Situation marginally improves towards end-century as exposure to drought and seasonal crop water stress is projected to decrease. (Reference: Technical Report on Vulnerability Assessment) 10
21 Conclusions and Recommendations The present study is a good beginning for creating an understanding of the changing climatic conditions and their implication to the vulnerability for various sectors individually as well as in an integrated manner, as composite vulnerability at the district level. This information can be very useful for designing appropriate and plausible adaptation options with respect to the specific activities of one s profession and domain. The study then deals with the future climate, both of near future as well as far future in terms of climatic projections made by the international atmospheric modelers. These outputs are used for the State of Madhya Pradesh to analyze how they compare with the conditions of the historical past. It has been found that in general the climatic conditions have been deteriorating and thereby enhancing the vulnerability over Madhya Pradesh. Impacts of the future climatic conditions have been quantified for various sectors and subsequently, changes in vulnerability assessed. This assessment is essential for formulating the adaptation options to cope with the climate change impacts of the future on individual enterprises or on the State as a whole. The framework that has been created and the procedures that have been set up shall be very useful to be adopted for generating the range of scenarios for a range of adaptation options so as to share these with a vast range of stakeholders to create consensus. Importance of these dynamic frameworks is also on account of the fact that the knowledge shall keep on improving with refinements in the predictions for the future. Change from the Previous Vulnerability Assessment (2013) The previous assessment made under collaboration of Ministry of Environment & Forests (MoEF) and Deutsche Gesellschaft fürinternationale Zusammenarbeit (GIZ) on Climate Change Adaptation in Rural Areas of India, executed by INRM Consultants, New Delhi was concluded in The major changes between previous assessment and the current assessment include: IPCC Climate Scenarios o o Previous assessment was developed fo r f u t u re p rojec t e d c l i m a t i c conditions, using PRECIS simulated weather parameters for single emission scenario of IPCC AR4 SRES A1B. Current assessment has been developed for future projected climatic conditions, using CORDEX regional climate model simulated weather parameters for two IPCC AR5 RCP scenarios (RCP4.5 and RCP8.5). Regional climate models o o Previous assessment used climate projections from a single regional climate model. Current assessment uses multimodel climate outputs from 10 models to generate ensemble mean of 3 RCMs to reduce climate model uncertainties. Temporal data o Previous assessment used socioeconomic and other temporal data from 2001 census
22 o Current assessment uses socioeconomic and other temporal data from 2011 census. Methodology o o Previous assessment used multivariate method to combine current and projected period in a single run to derive the indicator weights. Current assessment uses the same multivariate method to derive indicator weights for current and uses the weights derived from current to calculate projected vulnerability. o P r e v i o u s a s s e s s m e n t h a d 4 vulnerability categories (L: Low, M: Indicators Moderate, H: High, VH: Very High), current assessment uses 6 categories (VL: Very Low, L: Low, M: Moderate, H: High, VH: Very High, EH: Extremely High)to represent the vulnerability. o Pre v i o u s a s s e s s m e nt u s e d 6 1 indicators from various sectors. o o Current assessment uses 72 indicators for the same sectors covered in the previous assessment. Some of the additional indicators include: indicators for gender gap, seasonal water resources indicators, heat stress indicators. 12
23 Key Inferences for Madhya Pradesh Observed Climate over Madhya Pradesh ( :63 years) Increasing trends in maximum and minimum temperature have been observed (low confidence). Decreasing trend in annual average precipitation and trend in annual number of rainy days have been observed (low confidence). Extreme events like 1 day maximum precipitation show increasing trend (low confidence), warm nights and warm days show increasing trend (high confidence). Projected Climate - RCP4.5 (low), RCP8.5 (high) (near term: ; long term: ) CORDEX multi-model mean projections of annual temperature changes. Near term: Tmax; 1.30C and 1.60 CTmin: 1.40C and 1.80 Cunder RCP4.5 and RCP8.5. Long term: Tmax; 2.00C and 4.30CTmin: 2.60C and 5.30 Cunder RCP4.5 and RCP8.5. CORDEX multi-model mean projections of annual precipitation changes. Near term: Negligible increase under RCP4.5 and RCP8.5. Long term: 4.4% and 5.8% increase under RCP4.5 and RCP8.5. Projected extreme events: Heavy rainfall, heat waves, floods and drought are likely to increase in future and will become increasingly important and will play a more significant role in disaster management. Climate Change Impact on Water, Forest, Agriculture and Health Projected marginal Increase in SW monsoon stream flow. Water scarcity is a very likely due to increased water demand and lack of good management. Projected increase in drought conditions. Projected increase in frequency and magnitude of flood towards end-century. Likely reduction in the projected flow to some of the reservoirs. Forest: Forests in 17 & 22 Extreme climate events (Increases districts are projected to be in floods and heat stress) impacted towards will have an increasing end-century under RCP4.5 impact on human health and live and RCP8.5 respectively. stock. Months from April to Agriculture: Wheat yield is September are significant projected to decline by on account of either high 10% to 25%, increase in rice temperature or high humidity. and soybean yield is projected. Heat stress conditions are likely to Projected increase in seasonal worsen in future. agriculture water stress during Rabi cropping season. Very high vulnerability category: Singrauli, Jhabua, Barwani, Panna, Morena, Sidhi, Rewa and Alirajpur. District Vulnerability Profiles High vulnerability category: Dindori, Ashoknagar, Shivpuri, Umaria, Sheopur, Chhatarpur, Tikamgarh, West Nimar, Bhind, Damoh, Guna, Satna, Dhar, Katni, Sagar, Mandla and Rajgarh. Very Low vulnerability category: Bhopal, Jabalpur and Indore. 13

24 Summary of Current and Projected Climate for Madhya Pradesh 14

25 Note: Left panel shows summary of historical observed trend in annual maximum, minimum temperature and rainfall. Right panel shows summary of change in projected climate w.r.t baseline. Please refer "Key Inferences-Climate Analysis" section in Executive summary for details. Summary of Change in Projected Climate for Districts of Madhya Pradesh Maximum Temperature Minimum Temperature Rainfal Note: Summary of projected change in temperature and rainfall: RCP4.5 scenario- Top Left panel Mid-century, Top right panel Endcentury, RCP8.5 scenario- Bottom Left panel Mid-century, Bottom right panel End-century. Please refer "Key Inferences-Climate Analysis" section in Executive summary for details. 15

26 Sectoral Impact of Climate Change Summary for Districts of Madhya Pradesh Note: Summary of Sectoral impact of projected change in temperature and rainfall. Impacts on Water availability and Heat stress are depicted in terms of percentage change from baseline RCP4.5 scenario- Top Left panel Mid-century, Top right panel End-century, RCP8.5 scenario- Bottom Left panel Mid-century, Bottom right panel End-centur y. Please refer "Key I n f e r e n c e s - C l i m a t e C h a n g e I m p a c t Assessment" section in Executive summary for details. 16

27 Climate Change Vulnerability for Districts of Madhya Pradesh Note: Current and Projected Composite Vulnerability for districts of Madhya Pradesh constructed using 72 indicators from social, economic, climate, water resources and health sectors. The overall Composite Vulnerability of the districts is projected to increase under RCP4.5 and RCP8.5 scenarios towards mid and end-century. Please refer "Key Inferences-Current and Projected Vulnerability Profile for the Districts of Madhya Pradesh" section in Executive summary for details. 17
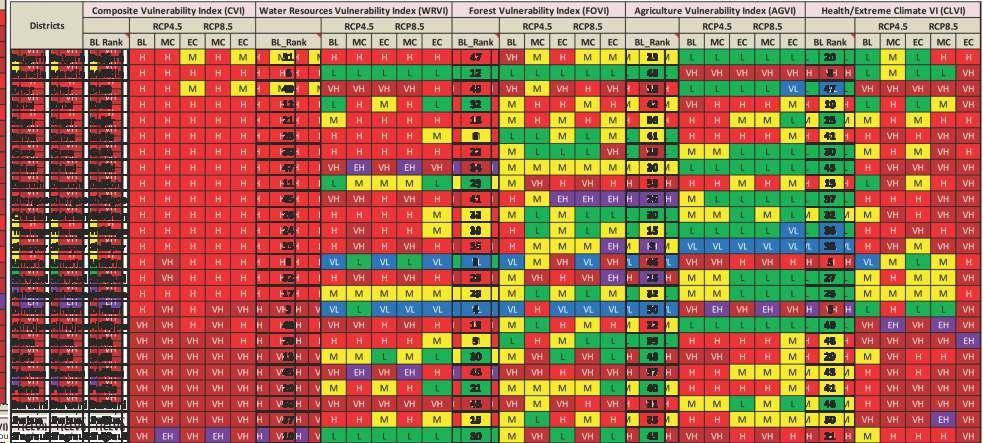
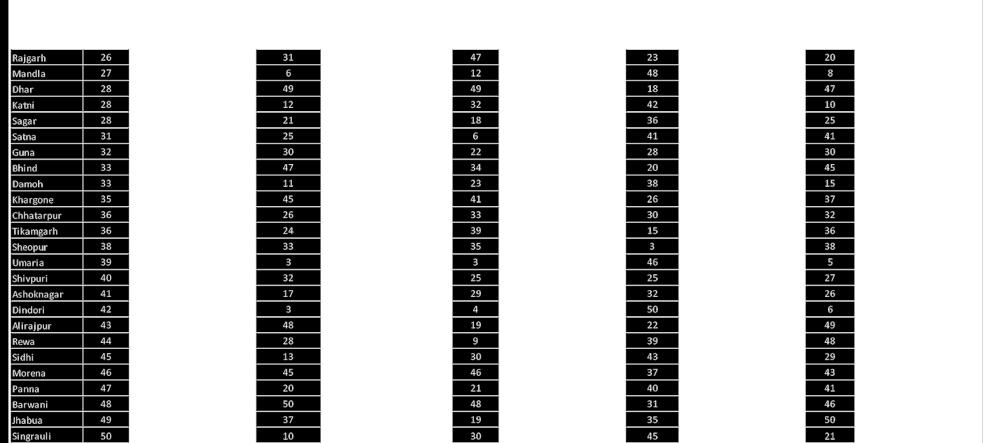
28 District current composite vulnerability along with disaggregated sub components for districts of Madhya Pradesh Districts Rank CV SV E C V CLV WRV FOV AGV Districts Rank CV SV ECV CLV WRV FOV AGV Bhopal 1 VL VL L M H VL L Rajgarh 26 H M M L H VH L Jabalpur 2 VL VL L L L M L Mandla 27 H H M L L L VH Indore 3 VL VL VL M VH M L Dhar 28 H M M VH VH VH L Hoshangabad 4 L L L L H H VL Katni 28 H H H L L M VH Harda 5 L M L H VL M VL Sagar 28 H M H M M M H Narsinghpur 6 L L M L VL H M Satna 31 H M M H H L H Gwalior 7 L VL L H H H L Guna 32 H H M M H M M Dewas 8 L L L L H H L Bhind 33 H M VH H VH M L Neemuch 9 L L M M H H VL Damoh 33 H H VH L L M H Ujjain 10 L L L L H VH L Khargone 35 H M H H VH H M Sehore 11 L M L L M VL L Chhatarpur 36 H H VH M H M M Chhindwara 12 L L M VL H M L Tikamgarh 36 H H VH H H H L Anuppur 13 L M M VL VL L VH Sheopur 38 H VH M H H H VL Raisen 14 L M M M L L L Umaria 39 H VH H VL VL VL VH Datia 15 M M H H M M L Shivpuri 40 H H H M H M M Mandsaur 16 M L M M VH VH L Ashoknagar 41 H H VH M M M M Seoni 17 M M H VL M M H Dindori 42 H VH H L VL VL VH Vidisha 17 M M M L M M L Alirajpur 43 VH M VH VH VH M L Betul 19 M M L L H M M Rewa 44 VH H VH VH H L H Balaghat 20 M L H L M M VH Sidhi 45 VH VH H M M M VH Shajapur 21 M M L L H VH L Morena 46 VH H H H VH VH H Khandwa 22 M M L M H VL M Panna 47 VH VH VH H M M H Ratlam 23 M M M M VH H L Barwani 48 VH H H H VH VH M Burhanpur 24 M M H M VH L L Jhabua 49 VH VH H VH H M H Shahdol 25 M M M VL L L VH Singrauli 50 VH VH VH M L M VH Current and projected composite vulnerability for districts of Madhya Pradesh 18


29 19 Current and projected composite vulnerability for districts of Madhya Pradesh
30 20

31 Illustration of importance of individual vulnerability indicators contributing to Composite Vulnerability Index for top very high vulnerablw and very low vulnerable districts Very High Vulnerability - Singrauli and Jhabua Socio- Eco Biophysical 21

32 Socio- Eco Biophysical 22

33 Very Low Vulnerability: Bhopal and Jabalpur Socio- Eco Biophysical 23

34 Socio- Eco Biophysical 24
35 Annexure No Indicators Abb Unit Functional Relationship with vulnerability Conceptual Basis Time Period Social 1 Density of Population DP Persons/Sq. Km Increase Sensitivity Decadal growth rate of Population GR Percentage Increase Sensitivity Sex-ratio SR No of females/ 1000 males Increase Sensitivity Literacy Rate LR Percentage Decrease Adaptive Capacity Gender gap in literacy rate GGLR Percentage Increase Sensitivity Age Dependency ratio ADR Percentage Increase Sensitivity Child Population in the age group 0-6 CP Percentage Increase Sensitivity Households with access to improved source of drinking water (tap water, covered well, hand Adaptive pump, tubewell) DW Percentage Decrease Capacity Households having access to sanitation facility within the Adaptive premises SF Percentage Decrease Capacity Households having electricity as Adaptive main source of lighting EL Percentage Decrease Capacity Households still dependent on biomass as fuel for cooking BM Percentage Increase Sensitivity Households living in Permanent Adaptive houses PH Percentage Decrease Capacity Households with access to Adaptive communication/transport COMTR Percentage Decrease Capacity Percentage of Population Below Poverty Line BPL Percentage Increase Sensitivity Share of Marginal Workers MGW Percentage Increase Sensitivity Agricultural And Cultivators to Main Workers ACMW Percentage Increase Sensitivity Total work participation rate TWPR Percentage Decrease Adaptive Capacity Gender gap in work participation rate GWPR Percentage Increase Sensitivity Health Centres (Primary Health Centres, Community Health Centres, Sub Centres, Sub Number/Lakh Adaptive divisional and District hospitals ) HC of population Decrease Capacity Beds available in health institutions BHC Number/ Lakh of Adaptive population Decrease Capacity
36 21 Schools (primary/pre-primary junior basic schools, high schools Number/Lakh Adaptive and higher secondary schools) EI of population Decrease Capacity Student Teacher Ratio ST Number Increase Sensitivity Level of urbanization UR Percentage Decrease Adaptive Capacity Schedule Tribes and Scheduled Caste population STSC Percentage Increase Sensitivity Road length RDEN Per 100 sq. km Decrease Adaptive Capacity Crude Birth Rate CBR Percentage Increase Sensitivity Crude Death Rate CDR Percentage Increase Sensitivity Infant Mortality Rate IMR Percentage Increase Sensitivity Total Fertility Rate TFR Percentage Increase Sensitivity Acute diarrhea cases DH Persons Per 100,000 Increase Population Sensitivity Annual Parasite Index-Malaria API Percentage Increase Sensitivity 2010 Economic 32 Per Capita Income (GDP) at Adaptive current prices GDP Rs. '000 Decrease Capacity Households availing banking Adaptive services BNKS Percentage Decrease Capacity Commercial banks CBNK Number/Lakh Adaptive of population Decrease Capacity Total Credit to Total Deposits in Adaptive Banks TCTD Percentage Decrease Capacity Micro, Small & Medium Scale Number/Lakh Adaptive Industrial Units MSME of population Decrease Capacity 2015 Climate 37 Average annual rainfall RF mm Decrease Exposure 38 Standard deviation in annual rainfall STDRF Increase Exposure 39 No. of Rainy Days RD Number of Days Decrease Exposure 40 Extremely Wet Days-Annual total rainfall when rainfall>99th percentile EWD mm Increase Exposure 41 Consecutive Dry Days-maximum number of Consecutive Days With Number Rainfall Less Than 1 mm CDD of Days Increase Exposure 42 Consecutive Wet Days-maximum Number number of Consecutive Days CWD of Days Increase Exposure Heat Index HI Severity of (BL), 2021 days Increase Sensitivity Temperature Humidity Index THI Severity of (MC), days Increase Sensitivity (EC) 26
37 Water Resource 45 Surface Water availability in mm/lakh Adaptive South West Monsoon season SWSWM population Decrease Capacity 46 Surface Water availability in North mm/lakh Adaptive East Monsoon season SWNEM population Decrease Capacity 47 Ground Water availability in mm/lakh Adaptive South West Monsoon season GWSWM population Decrease Capacity 48 Ground Water availability in mm/lakh Adaptive 1981 North East Monsoon season GWNEM population Decrease Capacity Crop water Stress(ET/PET) in (BL), South West Monsoon season CWSSWM Ratio Increase Sensitivity Crop water Stress(ET/PET) in 2050 North East Monsoon season CWSNEM Ratio Increase Sensitivity (MC), 51 Frequency of Drought DR Number of weeks Increase Exposure 2100 (EC) 52 Flood Discharge (1-2% probable flow) FL cumecs-day Increase Exposure Forest 53 Biological richness BR Number Decrease Adaptive Capacity Disturbance index DI Number Increase Sensitivity Canopy cover CC Percentage Increase Sensitivity Slope S Degree Increase Sensitivity Vegetation shift VS Number Increase Sensitivity Agriculture 58 Rice yield RY Kg/hectare Decrease Adaptive 1981 Capacity Wheat yield WY Kg/hectare Decrease Adaptive (BL), Capacity Soyabean yield SY Kg/hectare Decrease Adaptive 2050 Capacity (MC), 61 Chickpea yield CHY Kg/hectare Decrease Adaptive Capacity 2100 (EC) 62 Food grains yield FY Kg/hectare Decrease Adaptive Capacity 63 Net Area Sown NSA Percentage Decrease Adaptive of the district Capacity geographical area 64 Net Irrigated Area IA Percentage to Decrease Adaptive Net Sown Capacity Area 65 Fertilizer Consumption FC Kg/ha Decrease Adaptive Capacity 27
38 28 66 Cropping intensity CI Percentage Decrease Adaptive Capacity 67 Total Wasteland WL Percentage Increase Sensitivity of the district geographical area 68 Land Holdings area below 1 Hectare LH Percentage Increase Sensitivity Livestock unit LP Number per Decrease Adaptive house Capacity holds 70 Poultry Unit POP Number per Decrease Adaptive house Capacity holds 71 Milk production per capita MP gms/day Decrease Adaptive Capacity Egg Production per capita EP eggs/year Decrease Adaptive Capacity 2009
39

40