LESA ASSESSMENT LAUREL SOLAR PROJECT (T16S, R12E, S26, SBB&M)
|
|
|
- Evangeline King
- 5 years ago
- Views:
Transcription
1 LESA ASSESSMENT LAUREL SOLAR PROJECT (T16S, R12E, S26, SBB&M) IMPERIAL COUNTY, CALIFORNIA May 2017 EMA Report No Prepared for: 90FI 8me LLC 111 Woodmere Road, Suite 250 Folsom, CA ENVIRONMENTAL MANAGEMENT ASSOCIATES
2 LAND EVALUATION AND SITE ASSESSMENT MODEL LAUREL SOLAR PROJECT (T16S, R12E, S26, SBB&M) IMPERIAL COUNTY, CALIFORNIA The Land Evaluation and Site Assessment (LESA) model is an approach for rating the relative quality of land resources based upon specific measurable features. The LESA model was first developed by the federal Natural Resources Conservation Service (NRCS) in It was subsequently adapted in 1990 by the California Department of Conservation to evaluate land use decisions that affect the conversion of agriculture lands in California. The formulation of the California LESA Model is intended to provide lead agencies under the California Environmental Quality Act (CEQA) with an optional methodology to ensure that significant effects on the environment of agricultural land conversions are quantitatively and consistently considered in the environmental review process. For determining the potential CEQA significance resulting from the conversion of agricultural lands to some other purpose, the California Agricultural LESA Model has developed Scoring Thresholds which are used to compare the Final LESA Score and the Weighted Factor Scores for the Project with suggested Scoring Decisions. These LESA Scores do not take into consideration any proposed mitigation measures or other factors that might affect a lead agency s determination of the significance of the agricultural lands conversion impact under CEQA. The information provided on the following pages present documentation of the LESA assessment prepared using the California Agricultural LESA Model for the (Project) (APNs , ). The proposed would be constructed on approximately 171 acres of privately owned land located approximately 10 miles Southwest of El Centro, east of the Derrick Road, bisected by West Diehl Road, and west and north of the Campo Verde Solar Project (Figure 1 and Figure 2). i
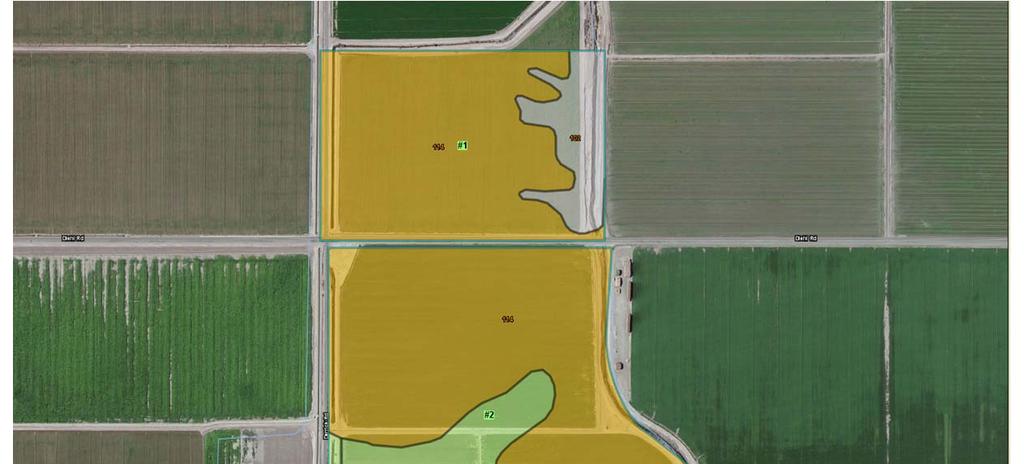
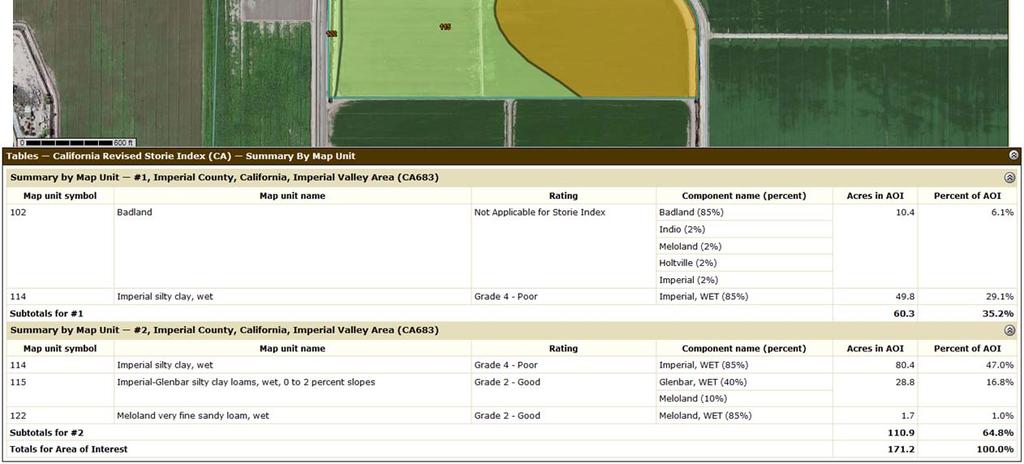
3 LESA ASSESSMENT LAUREL SOLAR PROJECT IMPERIAL COUNTY, CALIFORNIA TABLE OF CONTENTS SUMMARY... i LIST OF FIGURES... ii LIST OF APPENDICES... ii 1. CALIFORNIA LAND EVALUATION AND SITE ASSESSMENT MODEL... 3 A LAND CAPABILITY CLASSIFICATION ( LCC )...3 B STORIE INDEX RATING...3 C PROJECT SIZE RATING...5 D WATER RESOURCES AVAILABILITY RATING...6 E SURROUNDING AGRICULTURAL LAND RATING...7 F SURROUNDING PROTECTED RESOURCE LAND RATING...7 G WEIGHTING OF FACTORS AND FINAL LESA SCORE...9 Page LIST OF FIGURES Figure 1: Location Map... 1 Figure 2: Development Area Map on an Aerial Photographic Base... 2 Figure 3: Development Area Soils Map... 4 Figure 4: Zone of Influence... 8 Page LIST OF APPENDICES APPENDIX A: LAUREL SOLAR PROJECT SOILS DETAILS ii
4 LESALocationV01 Laurel Project Location _ ^ Project Location 4 Miles Coordinate System: NAD 1983 UTM Zone 11N Projection: Transverse MercatorNorth American 1983 Date: 5/16/2017 Author: Carey, D. µ Location Map Figure 1: Location Map 1 _ ^ Project Location
5 LESA_Aerial_View_V Project Location 1 Miles Coordinate System: NAD 1983 UTM Zone 11N Projection: Transverse MercatorNorth American 1983 Date: 5/16/2017 Author: Carey, D. µ Aerial View Figure 2 : Development Area on an Aerial Photographic Base 2 Project Location
6 Land Evaluation Worksheet A B C D E F G H Soil Map Unit* Project Acres Proportion of LCC** LCC Rating LCC Score Storie Storie Index Project Area (irrigated) (irrigated)*** (C x E) Index** Score (C x G) N/A IIIw IIIw IIIw IIIw Totals LCC Total Score Storie Index Total Score Total Project Area (acres)= * The Soil Map Unit information and acreage were determined from the current soil survey information available at the USDA Natural Resources Conservation Service website: (Figure 3). ** The Land Capability Classification and Storie Index information was obtained from the current soil survey information available at the USDA Natural Resources Conservation Service website: (Appendix A). *** The LCC Rating for irrigated land was determined from the LCC Point Rating Table 2 from the LESA Instruction Manual (California Department of Conservation 1997).
7
8 Site Assessment Worksheet 1 Project Size Score* I J K LCC Class I-II LCC Class III LCC Class IV-VIII Project Acres per LCC Class 49.8 Project Acres per LCC Class 80.4 Project Acres per LCC Class 28.8 Project Acres per LCC Class 1.7 Total Project Acres per LCC Class * Project Size Scores Highest Project Size Score 100 * Project Size Score was determined from the Project Size Scoring Table from the LESA Instruction Manual (California Department of Conservation 1997).
9 Site Assessment Worksheet 2 Water Resources Availability A B C D E Project Portion Water Source Proportion of Project Area Water Availability Score* Weighted Availability Score (C x D) 1 Irrigation District Only (Must Sum to 1.0) Total Water Resource Score * The Water Availability Score was determined using the Water Resources Availability Scoring Table from the LESA Instruction Manual (California Department of Conservation 1997). 100
10 Site Assessment Worksheet 3 Surrounding Agricultural Land & Surrounding Protected Resource Land A B C D E F G Zone of Influence* Surrounding Agricultural Land Score (From LESA Manual Percent Acres of Percent in Protected Acres in Protected Agriculture Resource Agriculture Resource (B/A) Land Land (C/A) Table 6) Total Acres Surrounding Protected Resource Land Score (From LESA Manual Table 7)** * In conformance with the instructions in the LESA Instruction Manual (California Department of Conservation 1997), the Zone of Influence was determined by drawing the smallest rectangle that could completely encompass the entire Project Area. A second rectangle was then drawn which extended one quarter mile on all sides beyond the first rectangle. The Zone of Influence is represented by the entire area of all parcels with any lands inside the outer rectangle, less the area of the proposed project (Figure 4). ** The LESA Instruction Manual (California Department of Conservation 1997) describes Protected Resource Land as those lands with long term use restrictions that are compatible with or supportive of agricultural uses of land. Included among them are the following: Williamson Act contracted lands; Publicly owned lands maintained as park, forest, or watershed resources; and Lands with agricultural, wildlife habitat, open space, or other natural resource easements that restrict the conversion of such land to urban or industrial uses. Surrounding Parcels*** Acres Protected Resource Land? Percent Protected Resource Land Acres in Protected Land Agricultural Land? Percent Agricultural Land Acres of Agriculture N 0 0 Y N 0 0 Y N 0 0 Y N 0 0 N N 0 0 Y N 0 0 Y N 0 0 Y N 0 0 N N 0 0 N N 0 0 Y N 0 0 Y N 0 0 N N 0 0 N N 0 0 N N 0 0 N N 0 0 Y N 0 0 Y N 0 0 N N 0 0 N N 0 0 Y Total Total 0 Total 685 ***The Imperial County Assessors website was accessed to identify the surrounding parcel numbers ( The percentage of agriculture was determined from a map overlay used to estimate the proportion of land in agriculture and the California Department of Conservation Important Farmland Map Series.
 Influenced Parcels")
11 Figure 4: Zone of Influence Rectangle Zone of Influence (1/4 mile) Influenced Parcels
12 Final LESA Score Sheet Factor Scores Factor Weight Weighted Factor Scores Total LESA Score LE Factors Land Capability Classification to 39 Points Storie Index LE subtotal SA Factors 40 to 59 Points Project Size Water Resource Availability Surrounding Agricultural Land to 79 Points Protected Resource Land SA Subtotal Total LESA to 100 Points Score California LESA Model Scoring Thresholds Not Considered Significant Considered Significant unless either LE or SA subscore is less than 20 points Considered Significant Scoring Decision Considered Significant only if LE and SA subscores are each greater than or equal to 20 points
13 APPENDIX A: LAUREL SOLAR PROJECT SOILS DETAILS
14 Map Unit Description: Badland---Imperial County, California, Imperial Valley Area Imperial County, California, Imperial Valley Area 102 Badland Map Unit Setting National map unit symbol: h8z8 Mean annual precipitation: 0 to 3 inches Mean annual air temperature: 72 to 75 degrees F Frost-free period: 300 to 350 days Farmland classification: Not prime farmland Map Unit Composition Badland: 85 percent Minor components: 8 percent Estimates are based on observations, descriptions, and transects of the mapunit. Description of Badland Setting Parent material: Alluvium derived from mixed Properties and qualities Slope: 30 to 75 percent Depth to restrictive feature: 0 to 4 inches to paralithic bedrock Runoff class: High Interpretive groups Land capability classification (irrigated): None specified Land capability classification (nonirrigated): 8e Minor Components Imperial Percent of map unit: 2 percent Holtville Percent of map unit: 2 percent Meloland Percent of map unit: 2 percent Indio Percent of map unit: 2 percent Natural Resources Conservation Service Web Soil Survey National Cooperative Soil Survey 5/15/2017 Page 1 of 2
15 Map Unit Description: Badland---Imperial County, California, Imperial Valley Area Data Source Information Soil Survey Area: Imperial County, California, Imperial Valley Area Survey Area Data: Version 8, Sep 12, 2016 Natural Resources Conservation Service Web Soil Survey National Cooperative Soil Survey 5/15/2017 Page 2 of 2
16 Map Unit Description: Imperial silty clay, wet---imperial County, California, Imperial Valley Area Imperial County, California, Imperial Valley Area 114 Imperial silty clay, wet Map Unit Setting National map unit symbol: h8zn Elevation: -230 to 200 feet Mean annual precipitation: 0 to 3 inches Mean annual air temperature: 72 to 75 degrees F Frost-free period: 300 to 350 days Farmland classification: Farmland of statewide importance Map Unit Composition Imperial, wet, and similar soils: 85 percent Minor components: 15 percent Estimates are based on observations, descriptions, and transects of the mapunit. Description of Imperial, Wet Setting Landform: Basin floors Landform position (three-dimensional): Talf Down-slope shape: Linear Across-slope shape: Linear Parent material: Clayey alluvium derived from mixed and/or clayey lacustrine deposits derived from mixed Typical profile H1-0 to 12 inches: silty clay H2-12 to 60 inches: silty clay loam Properties and qualities Slope: 0 to 2 percent Depth to restrictive feature: More than 80 inches Natural drainage class: Moderately well drained Capacity of the most limiting layer to transmit water (Ksat): Moderately low to moderately high (0.06 to 0.20 in/hr) Depth to water table: More than 80 inches Frequency of flooding: None Frequency of ponding: None Calcium carbonate, maximum in profile: 5 percent Salinity, maximum in profile: Slightly saline to moderately saline (4.0 to 8.0 mmhos/cm) Sodium adsorption ratio, maximum in profile: 20.0 Available water storage in profile: Moderate (about 8.3 inches) Interpretive groups Land capability classification (irrigated): 3w Land capability classification (nonirrigated): 7w Hydrologic Soil Group: C Natural Resources Conservation Service Web Soil Survey National Cooperative Soil Survey 5/15/2017 Page 1 of 2
17 Map Unit Description: Imperial silty clay, wet---imperial County, California, Imperial Valley Area Minor Components Glenbar Percent of map unit: 4 percent Meloland Percent of map unit: 4 percent Holtville Percent of map unit: 4 percent Niland Percent of map unit: 3 percent Data Source Information Soil Survey Area: Imperial County, California, Imperial Valley Area Survey Area Data: Version 8, Sep 12, 2016 Natural Resources Conservation Service Web Soil Survey National Cooperative Soil Survey 5/15/2017 Page 2 of 2
18 Map Unit Description: Imperial silty clay, wet---imperial County, California, Imperial Valley Area Imperial County, California, Imperial Valley Area 114 Imperial silty clay, wet Map Unit Setting National map unit symbol: h8zn Elevation: -230 to 200 feet Mean annual precipitation: 0 to 3 inches Mean annual air temperature: 72 to 75 degrees F Frost-free period: 300 to 350 days Farmland classification: Farmland of statewide importance Map Unit Composition Imperial, wet, and similar soils: 85 percent Minor components: 15 percent Estimates are based on observations, descriptions, and transects of the mapunit. Description of Imperial, Wet Setting Landform: Basin floors Landform position (three-dimensional): Talf Down-slope shape: Linear Across-slope shape: Linear Parent material: Clayey alluvium derived from mixed and/or clayey lacustrine deposits derived from mixed Typical profile H1-0 to 12 inches: silty clay H2-12 to 60 inches: silty clay loam Properties and qualities Slope: 0 to 2 percent Depth to restrictive feature: More than 80 inches Natural drainage class: Moderately well drained Capacity of the most limiting layer to transmit water (Ksat): Moderately low to moderately high (0.06 to 0.20 in/hr) Depth to water table: More than 80 inches Frequency of flooding: None Frequency of ponding: None Calcium carbonate, maximum in profile: 5 percent Salinity, maximum in profile: Slightly saline to moderately saline (4.0 to 8.0 mmhos/cm) Sodium adsorption ratio, maximum in profile: 20.0 Available water storage in profile: Moderate (about 8.3 inches) Interpretive groups Land capability classification (irrigated): 3w Land capability classification (nonirrigated): 7w Hydrologic Soil Group: C Natural Resources Conservation Service Web Soil Survey National Cooperative Soil Survey 5/15/2017 Page 1 of 2
19 Map Unit Description: Imperial silty clay, wet---imperial County, California, Imperial Valley Area Minor Components Glenbar Percent of map unit: 4 percent Meloland Percent of map unit: 4 percent Holtville Percent of map unit: 4 percent Niland Percent of map unit: 3 percent Data Source Information Soil Survey Area: Imperial County, California, Imperial Valley Area Survey Area Data: Version 8, Sep 12, 2016 Natural Resources Conservation Service Web Soil Survey National Cooperative Soil Survey 5/15/2017 Page 2 of 2
20 Map Unit Description: Imperial-Glenbar silty clay loams, wet, 0 to 2 percent slopes---imperial County, California, Imperial Valley Area Imperial County, California, Imperial Valley Area 115 Imperial-Glenbar silty clay loams, wet, 0 to 2 percent slopes Map Unit Setting National map unit symbol: h8zp Elevation: -230 to 200 feet Mean annual precipitation: 0 to 3 inches Mean annual air temperature: 72 to 75 degrees F Frost-free period: 300 to 350 days Farmland classification: Farmland of statewide importance Map Unit Composition Imperial, wet, and similar soils: 40 percent Glenbar, wet, and similar soils: 40 percent Minor components: 20 percent Estimates are based on observations, descriptions, and transects of the mapunit. Description of Imperial, Wet Setting Landform: Basin floors Landform position (three-dimensional): Talf Down-slope shape: Linear Across-slope shape: Linear Parent material: Clayey alluvium derived from mixed and/or clayey lacustrine deposits derived from mixed Typical profile H1-0 to 12 inches: silty clay loam H2-12 to 60 inches: silty clay loam Properties and qualities Slope: 0 to 2 percent Depth to restrictive feature: More than 80 inches Natural drainage class: Moderately well drained Runoff class: Low Capacity of the most limiting layer to transmit water (Ksat): Moderately high (0.20 to 0.57 in/hr) Depth to water table: More than 80 inches Frequency of flooding: None Frequency of ponding: None Calcium carbonate, maximum in profile: 5 percent Salinity, maximum in profile: Slightly saline to moderately saline (4.0 to 8.0 mmhos/cm) Sodium adsorption ratio, maximum in profile: 20.0 Available water storage in profile: Moderate (about 8.6 inches) Interpretive groups Land capability classification (irrigated): 3w Natural Resources Conservation Service Web Soil Survey National Cooperative Soil Survey 5/15/2017 Page 1 of 2
21 Map Unit Description: Imperial-Glenbar silty clay loams, wet, 0 to 2 percent slopes---imperial County, California, Imperial Valley Area Land capability classification (nonirrigated): 7w Hydrologic Soil Group: C Description of Glenbar, Wet Setting Landform: Basin floors Landform position (three-dimensional): Talf Down-slope shape: Linear Across-slope shape: Linear Parent material: Alluvium derived from mixed Typical profile H1-0 to 13 inches: silty clay loam H2-13 to 60 inches: clay loam Properties and qualities Slope: 0 to 2 percent Depth to restrictive feature: More than 80 inches Natural drainage class: Moderately well drained Runoff class: Low Capacity of the most limiting layer to transmit water (Ksat): Moderately high (0.20 to 0.57 in/hr) Depth to water table: More than 80 inches Frequency of flooding: None Frequency of ponding: None Calcium carbonate, maximum in profile: 5 percent Salinity, maximum in profile: Very slightly saline to moderately saline (2.0 to 8.0 mmhos/cm) Sodium adsorption ratio, maximum in profile: 15.0 Available water storage in profile: High (about 10.8 inches) Interpretive groups Land capability classification (irrigated): 3w Land capability classification (nonirrigated): 7w Hydrologic Soil Group: C Minor Components Holtville Percent of map unit: 10 percent Meloland Percent of map unit: 10 percent Data Source Information Soil Survey Area: Imperial County, California, Imperial Valley Area Survey Area Data: Version 8, Sep 12, 2016 Natural Resources Conservation Service Web Soil Survey National Cooperative Soil Survey 5/15/2017 Page 2 of 2
22 Map Unit Description: Meloland very fine sandy loam, wet---imperial County, California, Imperial Valley Area Imperial County, California, Imperial Valley Area 122 Meloland very fine sandy loam, wet Map Unit Setting National map unit symbol: h8zx Elevation: -230 to 200 feet Mean annual precipitation: 0 to 3 inches Mean annual air temperature: 72 to 75 degrees F Frost-free period: 300 to 350 days Farmland classification: Prime farmland if irrigated and drained Map Unit Composition Meloland, wet, and similar soils: 85 percent Minor components: 15 percent Estimates are based on observations, descriptions, and transects of the mapunit. Description of Meloland, Wet Setting Landform: Basin floors Landform position (three-dimensional): Talf Down-slope shape: Linear Across-slope shape: Linear Parent material: Alluvium derived from mixed and/or eolian deposits derived from mixed Typical profile H1-0 to 12 inches: very fine sandy loam H2-12 to 26 inches: stratified loamy fine sand to silt loam H3-26 to 71 inches: clay Properties and qualities Slope: 0 to 2 percent Depth to restrictive feature: More than 80 inches Natural drainage class: Moderately well drained Runoff class: Low Capacity of the most limiting layer to transmit water (Ksat): Very low to moderately low (0.00 to 0.06 in/hr) Depth to water table: More than 80 inches Frequency of flooding: None Frequency of ponding: None Calcium carbonate, maximum in profile: 5 percent Salinity, maximum in profile: Moderately saline to strongly saline (8.0 to 16.0 mmhos/cm) Sodium adsorption ratio, maximum in profile: 13.0 Available water storage in profile: Moderate (about 7.8 inches) Interpretive groups Land capability classification (irrigated): 3w Land capability classification (nonirrigated): 7w Natural Resources Conservation Service Web Soil Survey National Cooperative Soil Survey 5/15/2017 Page 1 of 2
23 Map Unit Description: Meloland very fine sandy loam, wet---imperial County, California, Imperial Valley Area Hydrologic Soil Group: D Minor Components Imperial Percent of map unit: 3 percent Indio Percent of map unit: 3 percent Holtville Percent of map unit: 3 percent Glenbar Percent of map unit: 3 percent Vint Percent of map unit: 3 percent Data Source Information Soil Survey Area: Imperial County, California, Imperial Valley Area Survey Area Data: Version 8, Sep 12, 2016 Natural Resources Conservation Service Web Soil Survey National Cooperative Soil Survey 5/15/2017 Page 2 of 2
24 California Revised Storie Index (CA)---Imperial County, California, Imperial Valley Area California Revised Storie Index (CA) The Revised Storie Index is a rating system based on soil properties that govern the potential for soil map unit components to be used for irrigated agriculture in California. The Revised Storie Index assesses the productivity of a soil from the following four characteristics: - Factor A: degree of soil profile development - Factor B: texture of the surface layer - Factor C: steepness of slope - Factor X: drainage class, landform, erosion class, flooding and ponding frequency and duration, soil ph, soluble salt content as measured by electrical conductivity, and sodium adsorption ratio Revised Storie Index numerical ratings have been combined into six classes as follows: - Grade 1: Excellent (81 to 100) - Grade 2: Good (61 to 80) - Grade 3: Fair (41 to 60) - Grade 4: Poor (21 to 40) - Grade 5: Very poor (11 to 20) - Grade 6: Nonagricultural (10 or less) Reference: O'Geen, A.T., Southard, S.B., Southard, R.J A Revised Storie Index for Use with Digital Soils Information. University of California Division of Agriculture and Natural Resources. Publication pdf Report California Revised Storie Index (CA) California Revised Storie Index (CA) Imperial County, California, Imperial Valley Area Map symbol and soil name Pct. of map unit California Revised Storie Index (CA) Rating class Value 102 Badland Badland 114 Imperial silty clay, wet 85 Not Applicable for Storie Index Imperial, WET 85 Grade 4 - Poor Imperial-Glenbar silty clay loams, wet, 0 to 2 percent slopes Glenbar, WET 40 Grade 2 - Good 68 Imperial, WET 40 Grade 3 - Fair 57 Natural Resources Conservation Service Web Soil Survey National Cooperative Soil Survey 5/15/2017 Page 1 of 2
25 California Revised Storie Index (CA)---Imperial County, California, Imperial Valley Area California Revised Storie Index (CA) Imperial County, California, Imperial Valley Area Map symbol and soil name Pct. of map unit California Revised Storie Index (CA) Rating class Value 122 Meloland very fine sandy loam, wet Meloland, WET 85 Grade 2 - Good 77 Data Source Information Soil Survey Area: Imperial County, California, Imperial Valley Area Survey Area Data: Version 8, Sep 12, 2016 Natural Resources Conservation Service Web Soil Survey National Cooperative Soil Survey 5/15/2017 Page 2 of 2