Land Development and Soil Characteristics Affects on Runoff
|
|
|
- Lionel Stewart
- 5 years ago
- Views:
Transcription

1 Land Development and Soil Characteristics Affects on Runoff Robert Pitt, Celina Bochis, and Pauline Johnson Department of Civil, Construction and Environmental Engineering The University of Alabama Tuscaloosa, AL Celina Bochis photo
2 Purpose of Data Collection Impervious surfaces have the greatest effects on runoff characteristics for most events (runoff volume and pollutant yields) and can be the major sources of many stormwater pollutants However, pervious surfaces can be very important for larger events
3 Directly connected impervious surfaces dominate flow sources during rains <0.5 inches Disturbed urban soils can become very important runoff source areas during larger rains
4 Detailed impervious surface area information is lacking for most areas, especially concerning how those areas are connected to the drainage system. Available data are not reflective of detailed observations and can lead to modeling and other errors. Disturbed urban soils have infiltration characteristics that differ greatly from most published soil information sources. These actual characteristics must be considered in management and modeling decisions.


5
6 Soil Compaction and Recovery of Infiltration Rates Typical site development dramatically alters soil density. This significantly reduces infiltration rates, especially if clays are present. Also hinders plant growth by reducing root penetration (New Jersey NRCS was one of the first groups that researched this problem).


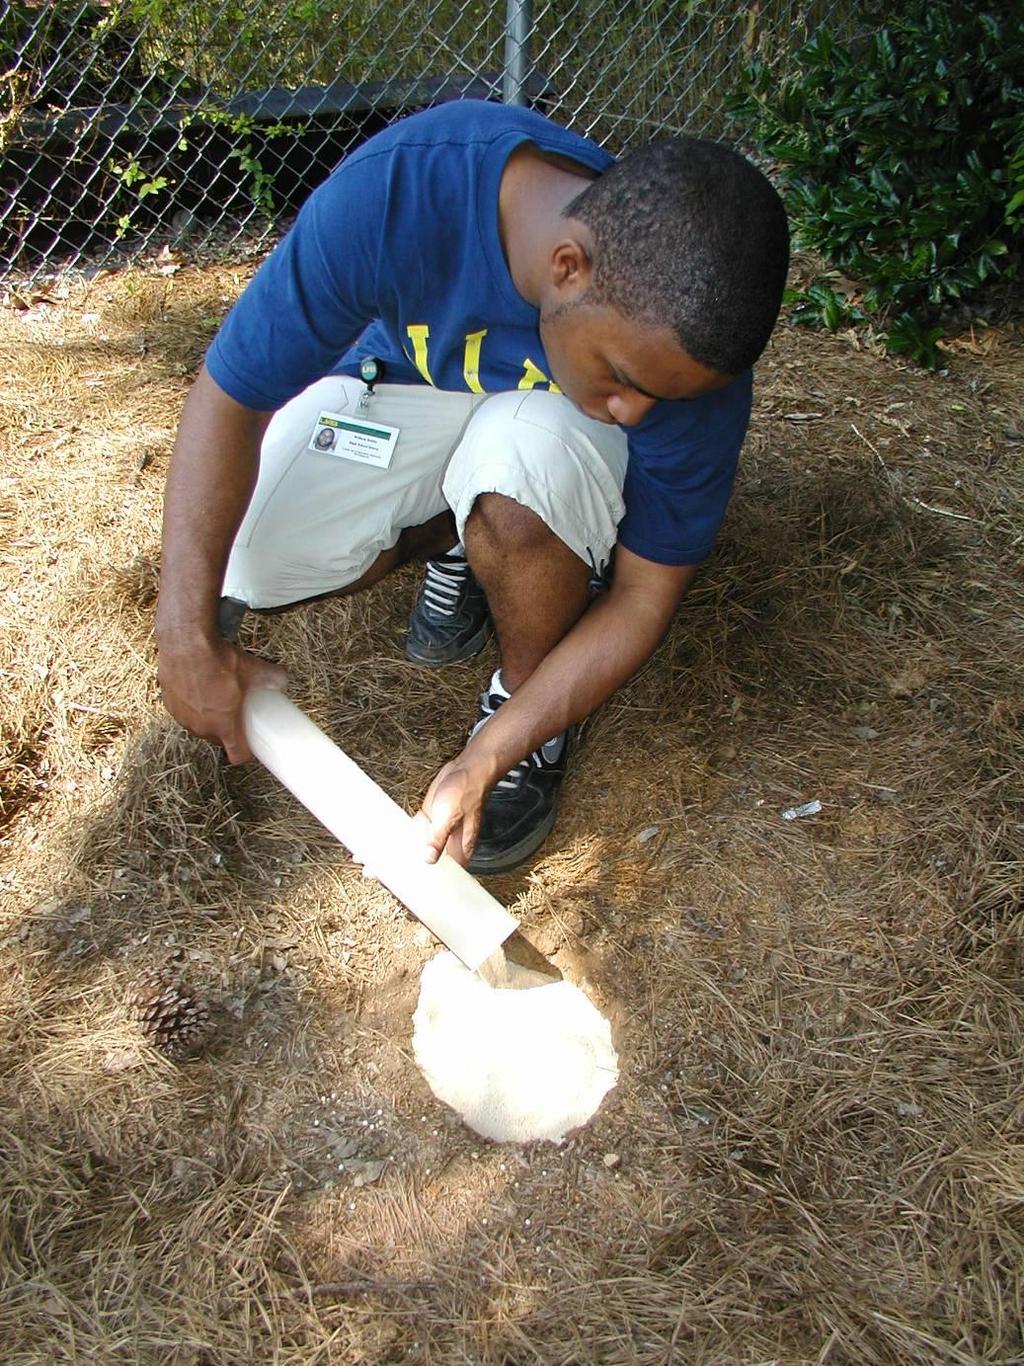
7 Urban Soils Compacted during and after Development
8 Infiltration Rates in Disturbed Sandy Urban Soils Infiltration Rates in Disturbed Clayey Urban Soils Pitt, et al. 1999
9 Infiltration Measurements for Noncompacted, Sandy Soils (Pitt, et al. 1999)
10 Pitt, et al. 2002
11 Long-Term Sustainable Average Infiltration Rates Soil Texture Sandy Loam Silt Loam Compaction Method Hand Standard Modified Hand Standard Modified Dry Bulk Density (g/cc) Long-term Average Infilt. Rate (in/hr) Compaction, especially when a small amount of clay is present, causes a large loss in infiltration capacity. Clay Loam Hand Standard Modified <<0.001 Pitt, et al. 2002

12 Compaction Measurements Soil Density Measurements
13 Types of Solutions to Infiltration Problems Use organic soil amendments to improve existing soil structure or restore soil structure after construction Remove soil layer with poor infiltration qualities Replace soil with improved soil mix Mix sand, organic matter, and native soil (if no clay) Use deep rooted plants or tilling to improve structure (but only under correct moisture conditions) Chisel plow, deep tilling, native plants Pre-treat water Select different site

14 Typical household lawn aerators are ineffective in restoring infiltration capacity in compacted soils.


15 Natural processes work best to solve compaction, but can take decades.


16 Soil modifications for rain gardens and other biofiltration areas can significantly increase treatment and infiltration capacity compared to native soils. (King County, Washington, test plots)
17 Enhanced Infiltration with Amendments Average Infiltration Rate (in/h) UW test plot 1 Alderwood soil alone 0.5 UW test plot 2 Alderwood soil with Ceder Grove compost (old site) UW test plot 5 Alderwood soil alone UW test plot 6 Alderwood soil with GroCo compost (old site) 3.3 Six to eleven times increased infiltration rates using compost-amended soils measured during long-term tests using large test plots and actual rains (these plots were 3 years old).
18 Changes in Mass Discharges for Plots having Amended Soil Compared to Unamended Soil Constituent Surface Runoff Mass Discharges Subsurface Flow Mass Discharges Runoff Volume (due to ET) Phosphate Ammonia Nitrate Copper Zinc Increased mass discharges in subsurface water pollutants observed for many constituents (new plots).
19 Water Quality and Quantity Effects of Amending Urban Soils with Compost Surface runoff rates and volumes decreased by six to ten eleven after amending the soils with compost, compared to unamended sites. Unfortunately, the concentrations of many pollutants increased in surface runoff from amended soil plots, especially nutrients which were leached from the fresh compost. However, the several year old test sites had less, but still elevated concentrations, compared to unamended soil-only test plots.

20 Street dirt washoff and runoff test plot, Toronto Pitt 1987

21 Runoff response curve for typical residential street, Toronto Pitt 1987
22 Predicted Runoff (in) Observed vs. Predicted Runoff at Madison Maintenance Yard Outfall Observed Runoff (in)
23 Approach for Land Cover Investigations Investigated many land uses in the Birmingham, AL, area: 1 large watershed, the Little Shades Creek Watershed (125 neighborhoods / 6 land uses) (original data collected in mid 1990s by USDA Earth Team volunteers) 5 drainage areas (40 neighborhoods having 2-6 land uses each) which are part of the Jefferson County, AL, Stormwater Permit Monitoring Program (intensive field investigations and surveys were conducted as part of this thesis research) Used WinSLAMM to: Calculated runoff characteristics Estimated the biological conditions of the receiving waters due to quantity of runoff for different land use and development characteristics
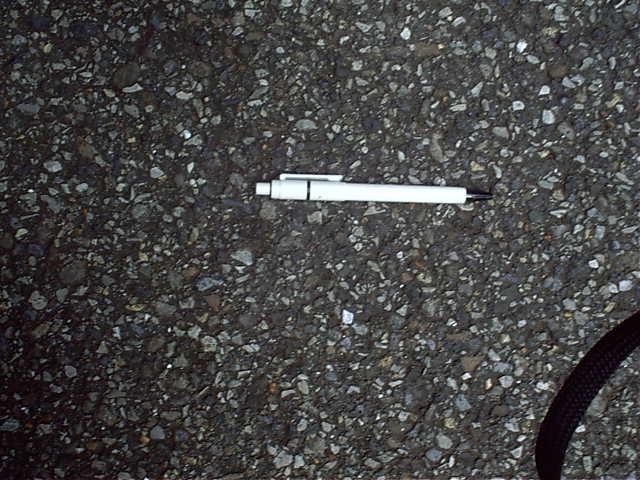
24 Field Data Collection Delineation of the watersheds and neighborhoods using aerial photographs, topographic maps, and on-site surveys Single land use surveys: 6 to 12 neighborhoods studied in detail per land use in each watershed to determine the variability of the development characteristics Site Inventory had 2 parts: Field data collection Aerial photographic measurements of different land covers Each site had at least two photographs taken: one as a general view one as a close-up of the street texture


25 Little Shades Creek Jefferson Co, AL Jefferson Co. MS4 Monitoring Sites Birmingham, AL
 3. Pavement conditions and texture (smooth, interm., rough) 4.")
26 Field Inventory Sheet Prepared for Each Neighborhood When in the field we look for: 1. Roof types (flat or pitched) 2. Roof connections (connected, disconnected) 3. Pavement conditions and texture (smooth, interm., rough) 4. Storm drainage type (grass swales, curb and gutters, and roof drains)


27 Village Creek Site (SWMA 002) Birmingham, AL

28 Example of high resolution color satellite image (Google)
29 Land Use Categories Examined Residential High, medium, low density Apartments, Multi- family units Commercial Strip commercial, shopping centers Office parks, downtown business district Industrial Manufacturing (power plants, steel mills, cement plants) Non-manufacturing (warehouses) Medium Industrial (lumber yards, junk and auto salvage yards, storage areas) Institutional Schools, churches, hospitals, nursing homes Open Space Parks, cemeteries, golf courses Vacant spaces, undeveloped areas Freeways drained by swales
 TIA = 25% DCIA = 15% TR-55 =")
30 Little Shades Creek Watershed Average Land Cover Distribution High Density Residential (6 houses/acre) TIA = 25% DCIA = 15% TR-55 = 52-65%


31 TIA = 20% DCIA = 15% TR-55 = 25-52% TIA = 61% DCIA = 60% TR-55 = 85% TIA = 10% DCIA = 6.7% TR-55 = 20-25% TIA = 67% DCIA = 64% TR-55 = 85%
32 Little Shades Creek Watershed Variation in Land Cover Distribution
33 Little Shades Creek and Jefferson Co. Drainage Areas: DCIA by Land Use
34 Average Percent Directly Connected Land Use Impervious Area Local Conditions TR 55 (using interpolation) HDR (> 6 units/ac) MDR (2-6 units/ac) LDR (< 2 units/ac) 5 23 APARTMENTS COM IND TR- 55 assumes all impervious areas to be directly connected to the drainage system Overestimation of impervious cover for local conditions

35 Figure and Table from Center for Watershed Protection Urban Steam Classification Channel Stability Aquatic Life Biodiversity Sensitive 0 10% Imperviousness Impacted 11 25% Imperviousness Damaged % Imperviousness Stable Unstable Highly Unstable Good/Excellent Fair/Good Poor
36 Rv Relationship between Directly Connected Impervious Areas, Volumetric Runoff Coefficient, and Expected Biological Conditions Relationship Between Directly Connecting Impervious Area (%) and the Calculated Rv for Each Soil Type Poor Good Fair Directly Connected Impervious Area (%) Sandy Soil Rv Silty Soil Rv Clayey Soil Rv
37 Watershed ID Major Land Use Area (ac) Pervious Areas (%) Directly Connected Impervious Areas (%) Disconnected Impervious Areas (%) Vol. Runoff Coeff. (Rv) Expected Biological Conditions of Receiving Waters ALJC 001 ALJC 002 IND Poor IND Poor ALJC 009 ALJC 010 Resid. High Dens. Resid. Med. Dens Poor Poor ALJC 012 Little Shades Creek COM Poor RES Poor
38 Discharge (cfs) Flow-Duration Curves for Different Stormwater Conservation Design Practices 140 Flow Duration Curves are Ranked in Order of Peak Flows Top Set: No Controls Swales Middle Set: Pond Pond and Swales Bottom Set: Biorentention Swales and Bioretention Pond and Bioretention Pond, Swales and Bioretention % Greater than Discharge Rate
39 $/1000 cu. Ft Reduced Cost Effectiveness of Stormwater Control Practices for Runoff Volume Reductions Pond Pond and Swale Swale Pond and Bioretention Pond, Swales and Bioretention 20 Bioretention Swales and Bioretention Max % Runoff Reduced
40 Example of Stormwater Control Implementation Annualized Total Costs ($/year/ac) No controls Pond Only Swales Only Bioretention Only Pond, Swales and Bioretention Runoff Coefficient (Rv) % Reduction of Total Runoff Volume Discharges Unit Removal Costs for Runoff Volume ($/ft 3 ) Expected biological conditions in receiving waters (based on Rv) n/a 1.4% 10% 58% 67% n/a poor poor poor poor fair Site ALJC 012 Area 228 acres = 92.3 ha Bioretention devices give the greatest reduction in runoff volume discharged The biological conditions improved from poor to fair due to stormwater controls
41 Combinations of Controls Needed to Meet Many Stormwater Management Objectives Smallest storms should be captured on-site for reuse, or infiltrated Design controls to treat runoff that cannot be infiltrated on site Provide controls to reduce energy of large events that would otherwise affect habitat Provide conventional flood and drainage controls Pitt, et al. (2000)
42 Conclusions Literature assumptions on impervious cover are not very accurate when applied to SE US conditions Almost all impervious surfaces are directly connected in the Jefferson County study areas examined Impervious cover variability within land uses need to be considered when modeling runoff conditions WinSLAMM showed that stream quality in the receiving waters is in poor condition, a fact confirmed by in-stream investigations by the SWMA biologists, Substantial applications of complimentary stormwater controls are needed to improve these conditions.
43 Acknowledgments Storm Water Management Authority at Birmingham, AL who provided the data SWMA employees who helped in this research Jefferson Co. NRCS Office, USDA (Earth Team) Many UA-CE graduate students who helped in the field data collection