Scott Valley Siskiyou County, California: Voluntary Private Well Water Level Monitoring Program Spring 2006 January 2016
|
|
|
- Oswald Norton
- 5 years ago
- Views:
Transcription
 University of California Davis")
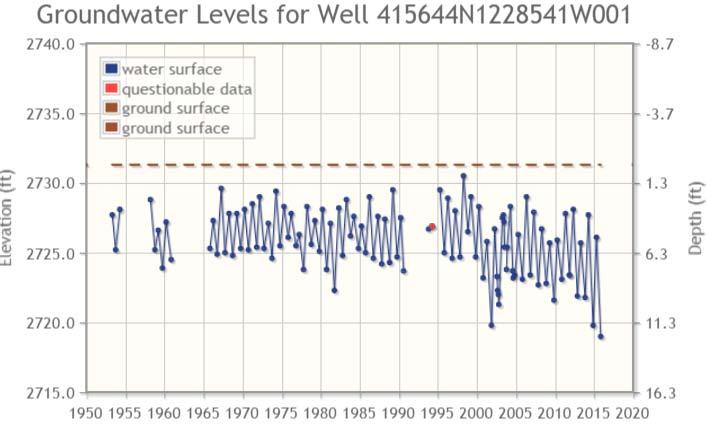
1 Scott Valley Siskiyou County, California: Voluntary Private Well Water Level Monitoring Program Spring 2006 January 2016 (Data collected monthly except January 2011) University of California Davis


2 Zones for Private Well Data Network, Scott Valley Alluvial Aquifer Valley Floor Discharge Zone Eastside Gulches Upper Westside Southern Valley Floor 2

3 Depth to Groundwater: Upper Westside 3

4 Depth to Groundwater: Discharge Zone 4
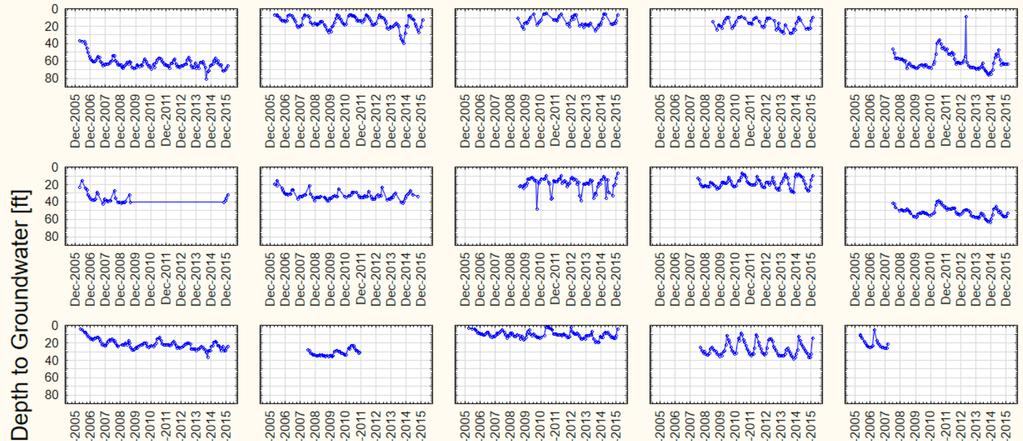
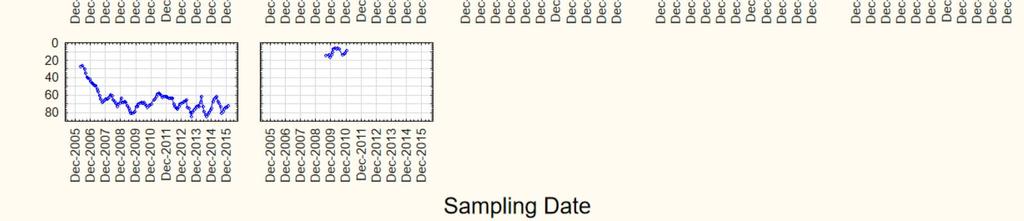
5 Depth to Groundwater: Eastside Gulches 5

6 Depth to Groundwater: Southern Valley Floor 6
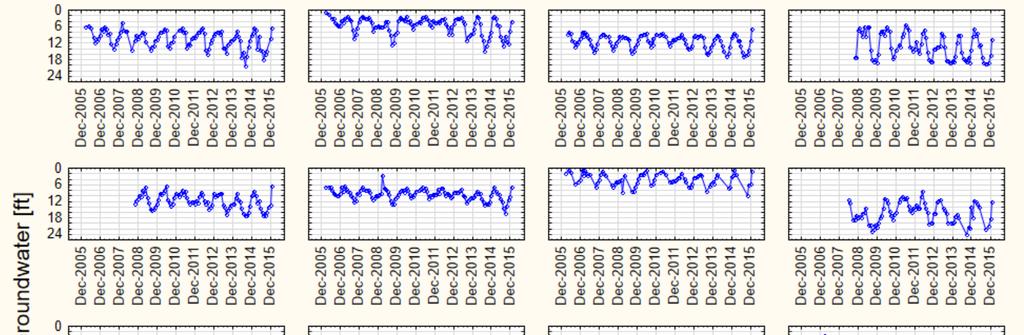
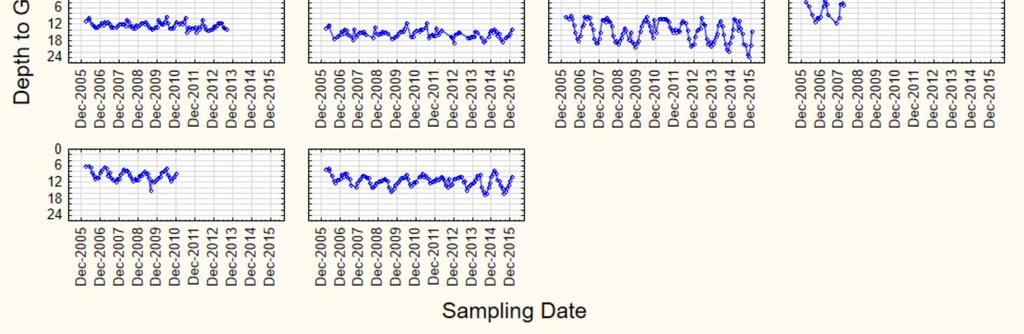
7 Depth to Groundwater: Valley Floor 7
8 Statistical Summary Note: The following statistical analysis was performed on the depth to groundwater from the ground surface. The depth to groundwater from the ground surface may differ from the depth to groundwater from the well reference point (previous figures) by 1 3 feet. Seasonal data are averaged for the following months: Winter : January March (no irrigation) Spring : April June (irrigation season starting in April/May) Summer : July August (irrigation season) Fall : September December (some irrigation in September) 8


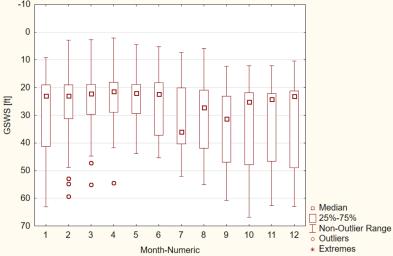
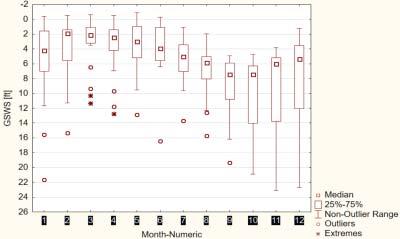
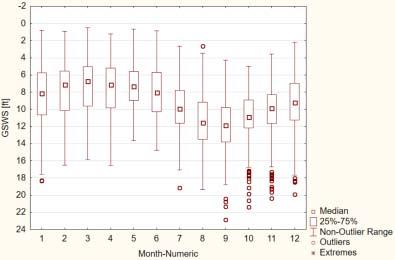
9 Water Level: Monthly Median, Quartiles by Region 9


10 Long term trends in seasonal water levels: Upper Westside WINTER SPRING SUMMER FALL 10


11 Long term trends in seasonal water levels: Eastside Gulches WINTER SPRING SUMMER FALL 11


12 Long term trends in seasonal water levels: Discharge Zone WINTER SPRING SUMMER FALL 12


13 Long term trends in seasonal water levels: Southern Valley Floor WINTER SPRING SUMMER FALL 13


14 Long term trends in seasonal water levels: Valley Floor WINTER SPRING SUMMER FALL 14


15 Long term trends in seasonal water levels: All Private Well Monitoring Wells WINTER SPRING SUMMER FALL 15


16 Average Depth to Groundwater in Private Monitoring Wells 16


17 Average Depth to Groundwater in Private Monitoring Wells includes only wells currently in the program (since 2008 or earlier) 17


18 Annual Average Depth to Groundwater in Private Monitoring Wells includes only wells currently in the program (since 2008 or earlier) 18


19 Average January Depth to Groundwater in Private Monitoring Wells includes only wells currently in the program (since 2008 or earlier) 19


20 Public Water Level Monitoring Program (County/DWR) blue shaded period: Jan 2001 Jan

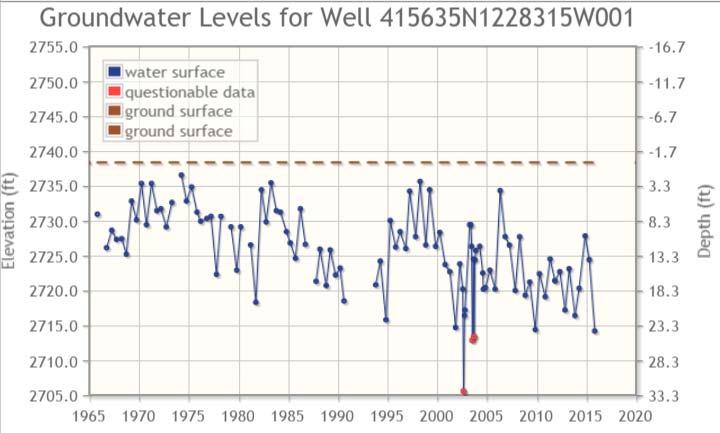


21 Public Water Level Monitoring Program (County/DWR) blue shaded period: Jan 2001 Jan


22 Public Water Level Monitoring Program (County/DWR)


23 Public Water Level Monitoring Program (County/DWR)


24 average actual 24


25 average actual 25
26 Summary Deepest water levels occur in wells around the margin of Scott Valley: on the upper westside and in the eastside gulches. Water levels in the discharge zone and on the valley floor are generally shallow Typical irrigation season is from April/May (depending on rains) until Labor Day Water levels are highest in the spring (April June), often around May, after the irrigation season begins Water levels may continue to drop after Labor Day, through September and October, corresponding to low Scott River flows. Groundwater level recovery often begins around New Year Water levels decrease year over year during drought, especially in the summer/fall 2009 had lower water levels in many regions than 2014 or 2015 An exceptional recovery of water levels was observed winter (Jan Mar 2015), which persevered somewhat through spring (Apr Jun 2015), summer (Jul Sep 2015) and fall (Oct Dec 2015). In 2015, with curtailments in place and little snowpack, water levels dropped again during the 2 nd quarter (earlier than usual). But with the starting water levels for the irrigation season, on average, as high or higher than 2011 and higher than it has been at any other time since 2007/08, spring water levels were not as deep in 2015 as in 2014 and neither were summer water levels. Despite a winter starting point as high as in 2011, the spring and summer 2015 water levels were lower than in 2012 or 2013 hence the water level drop from winter to spring was quite significant, possibly because of earlier and more pumping than in The public water level monitoring results, measured twice per year, are overall consistent with those of the private water level monitoring network. 26