Peter Randall Solar Kingdom Ltd
|
|
|
- Meagan Harvey
- 5 years ago
- Views:
Transcription
1 Peter Randall Solar Kingdom Ltd
2

3
4 How is Solar Doing?
5 How is Solar Doing? Now an Established Industry
6 How is Solar Doing? Now an Established Industry UK a Major Market

7 Estimated Total installed capacity 4.63GW Source STA & Solarbuzz

8 Total Deployment 2.21GW 2.0GW 0.48GW 0-50kW Building Mounted 50kW-1MW Building Mounted 1MW+ Ground Mounted & Building Mounted
9 Up to 50kw: 2.0GW
10
11
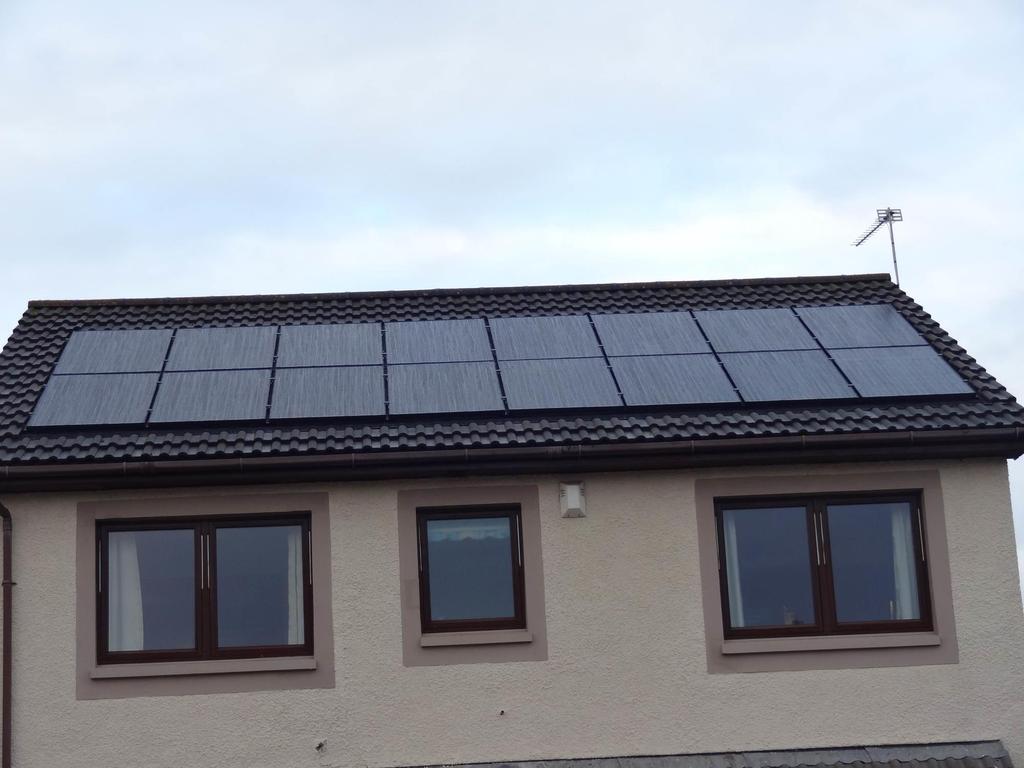
12 Up to 50kw: 2.0GW Half a Million roofs
13 Up to 50kw: 2.0GW Half a Million roofs Target One Million by 2016
14 Over 1MW: 2.21GW
15

16
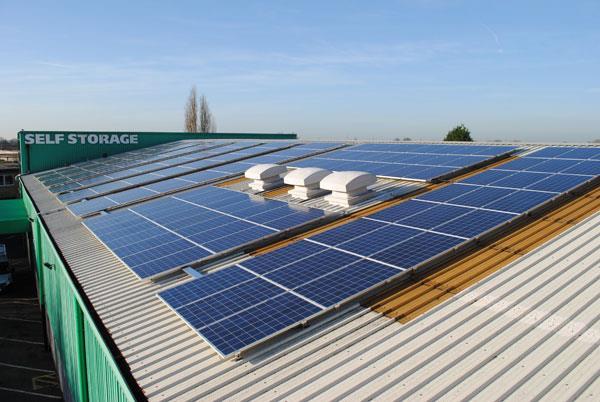
17 50kw-5MW 0.48GW
18
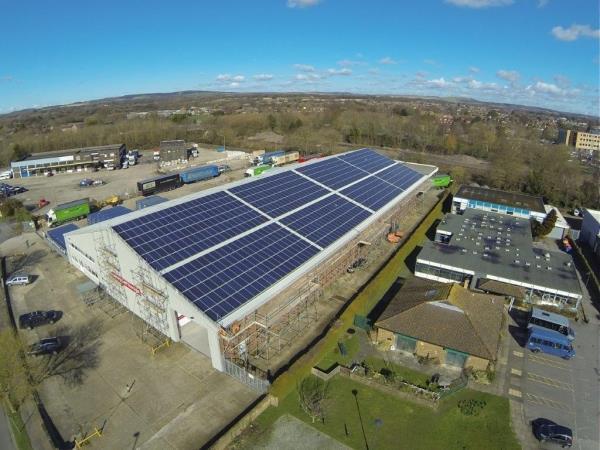
19 50kw-5MW 0.48GW The BIG Opportunity
20 National Solar Strategy
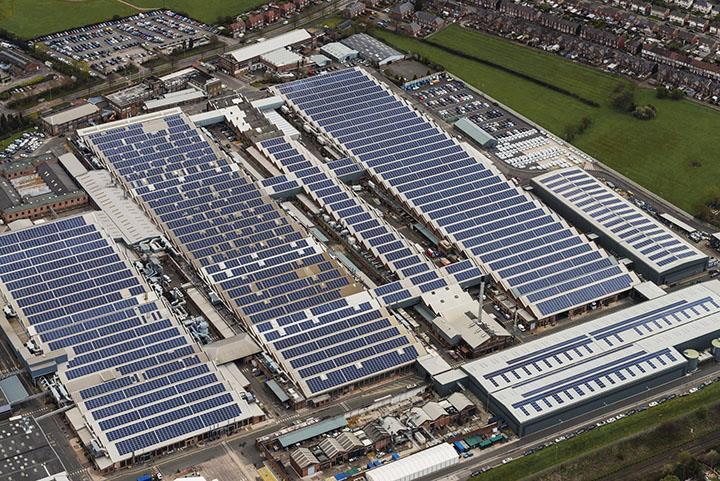
21 National Solar Strategy Indentifies Mid scale Rooftop solar as a Major opportunity
22 National Solar Strategy 250,00Ha south facing Commercial rooftops
23 National Solar Strategy Mid scale Rooftops 250,00Ha south facing 125GW potential
24 National Solar Strategy Mid scale Rooftops 250,00Ha south facing 125GW potential 20GW = 16% of available space
25 Barriers to Deployment
26 Barriers to Deployment Permitted Development Rights
27 Barriers to Deployment Permitted Development Rights ROO-FIT Process
28 Barriers to Deployment Permitted Development Rights ROO-FIT Process Feed-In Tariff
29 Barriers to Deployment Permitted Development Rights ROO-FIT Process Feed-In Tariff Landlord/Tennant
30 Barriers to Deployment
31 Barriers to Deployment Consultation on changes to financial support for solar PV 13 th May 2104
32 Barriers to Deployment Consultation on changes to financial support for solar PV No action proposed on key barriers in FITs
33 What Has Made Field Scale Solar a Success?
34 What Has Made Field Scale Solar a Success? Good Practice
35 What Has Made Field Scale Solar a Success? Good Practice Community engagement
36 What Has Made Field Scale Solar a Success? Good Practice Community engagement STA 10 commitments
37 What Has Made Field Scale Solar a Success? Good Practice Community engagement STA 10 commitments National Solar Centre Planning Guidance
38 What Has Made Field Scale Solar a Success? Good Practice Community engagement STA 10 commitments National Solar Centre Planning Guidance New Guidance on biodiversity

39

40

41 DECC Public Attitude Survey Solar No 1 with 85% support
42 Consultation on changes to financial support for solar PV 13 th May 2104 Curtailment of developments over 5MW under RO from 2015
43 The Business Case For Solar
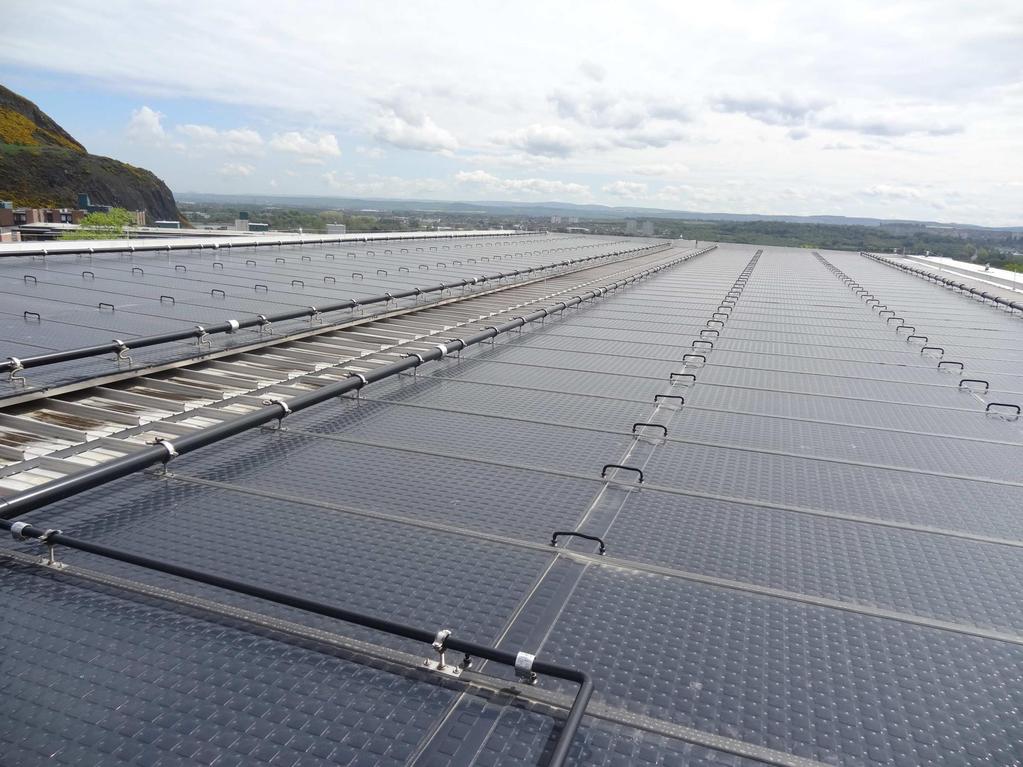
44 Commercial Installation Bridge of Don
45 7 Daily Load Profile %
46 12 Seasonalised Consumption Profile % Jan Feb Mar Apr May Jun Jul Aug Sep Oct Nov Dec
47 12 Annualized Consumption Profile Jan Feb Mar Apr May Jun Jul Aug Sep Oct Nov Dec
48 Consumption Requirement 40,000KWh Jan Feb Mar Apr May Jun Jul Aug Sep Oct Nov Dec
49 Energy from Inverter (AC) 19048KWh Consumption Requirement 40,000KWh Jan Feb Mar Apr May Jun Jul Aug Sep Oct Nov Dec
50 Energy from Inverter (AC) 19048KWh Direct Use of PV Energy 11244KWh Consumption Requirement 40,000KWh 0 Jan Feb Mar Apr May Jun Jul Aug Sep Oct Nov Dec
51 Is it worth it?
52 Is it worth it? Feed in Tariff Payment 12.57p/KWh
53 Is it worth it? Feed in Tariff Payment 12.57p/KWh Deemed Export Tariff Payment 3.305p/KWh
54 Is it worth it? Feed in Tariff Payment 12.57p/KWh Deemed Export Tariff Payment 3.305p/KWh Total p/KWh
55 Is it worth it? Current cost of electricity 11p/KWh
56 Is it worth it? Current cost of electricity 11p/KWh Assessment Period 20 years
57 Is it worth it? Current cost of electricity 11p/KWh Assessment Period 20 years Running Costs pa
58 Is it worth it? Historic Inflation RPI/CPI 3%
59 Is it worth it? Historic Inflation RPI/CPI 3% Fuel Price Inflation 5.66%
60 Is it worth it? Historic Inflation RPI/CPI 3% Fuel Price Inflation 5.66% Discount Rate 5%
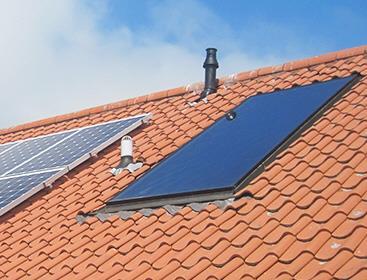
61 Is it worth it?
62 Is it worth it? Yield on Investment: 18.6%
63 Is it worth it? Yield on Investment: 18.6% Payback Period: 6.7 Years
64 Is it worth it? Yield on Investment: 18.6% Payback Period: 6.7 Years Net Present Value: 41800
65 Calculations take no account of tax position or incentives

66 Calculations take no account of tax position or incentives Annual Investment Allowance

67
68 SOLAR THERMAL
69
70 SOLAR THERMAL Domestic and Commercial Renewable Heat Incentive
71 SOLAR THERMAL Ideal for restricted roof space
72 SOLAR THERMAL Twice as efficient as PV
73 SOLAR THERMAL Energy is easily stored
74 SOLAR THERMAL Process, Commercial and Community Heat
75